Calvert Beach, MD
Calvert Beach Map
Calvert Beach Overview
1,026
TOTAL POPULATION
517
MALE POPULATION
509
FEMALE POPULATION
101.57
MALES / 100 FEMALES
98.45
FEMALES / 100 MALES
39.3
MEDIAN AGE
3.6
AVG FAMILY SIZE
3.2
AVG HOUSEHOLD SIZE
$34,408
PER CAPITA INCOME
$111,563
AVG FAMILY INCOME
$104,063
AVG HOUSEHOLD INCOME
0.33
INEQUALITY / GINI INDEX
512
LABOR FORCE [ PEOPLE ]
67.9%
PERCENT IN LABOR FORCE
4.6%
UNEMPLOYMENT RATE
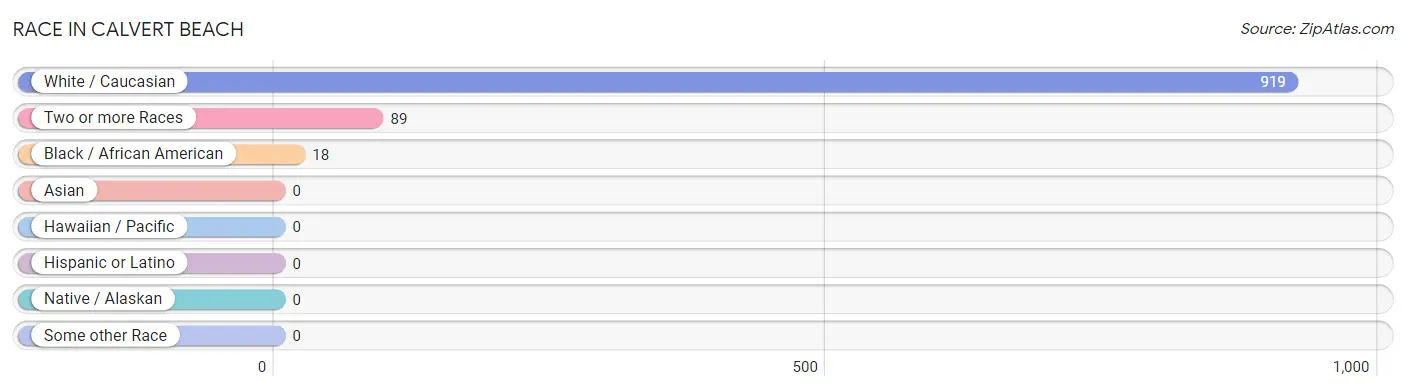
Race in Calvert Beach
The most populous races in Calvert Beach are White / Caucasian (919 | 89.6%), Two or more Races (89 | 8.7%), and Black / African American (18 | 1.8%).
| Race | # Population | % Population |
| Asian | 0 | 0.0% |
| Black / African American | 18 | 1.8% |
| Hawaiian / Pacific | 0 | 0.0% |
| Hispanic or Latino | 0 | 0.0% |
| Native / Alaskan | 0 | 0.0% |
| White / Caucasian | 919 | 89.6% |
| Two or more Races | 89 | 8.7% |
| Some other Race | 0 | 0.0% |
| Total | 1,026 | 100.0% |
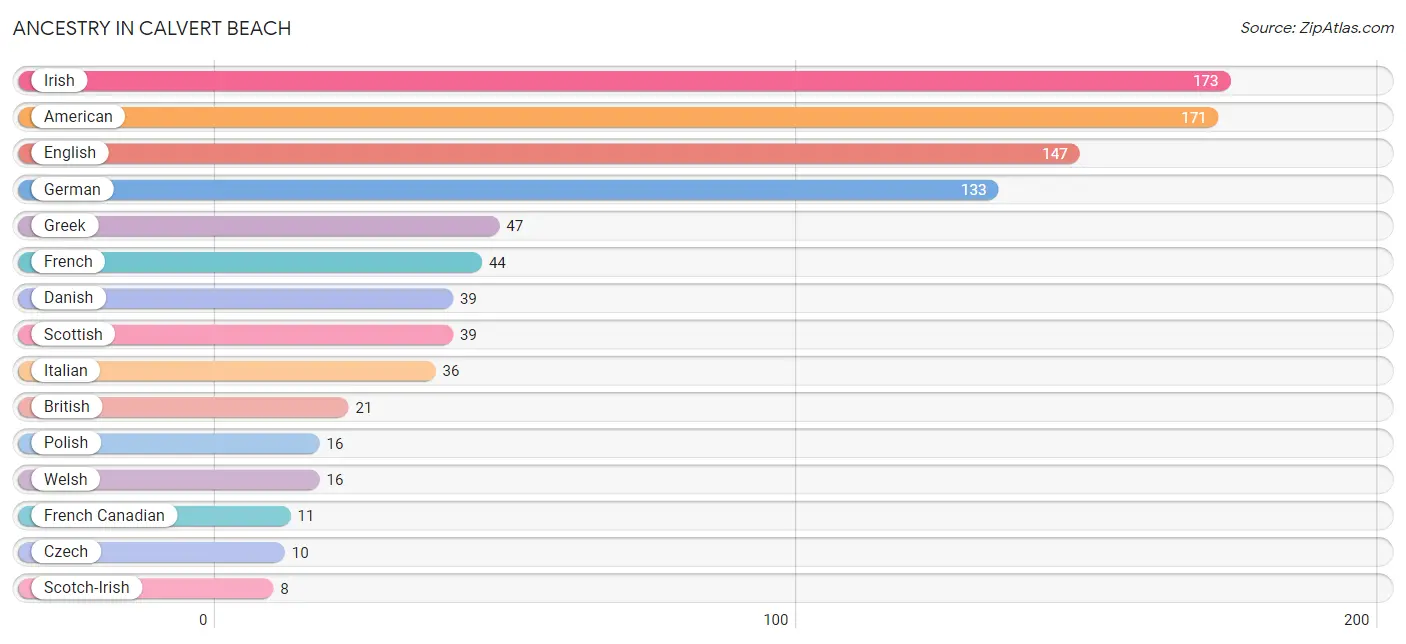
Ancestry in Calvert Beach
The most populous ancestries reported in Calvert Beach are Irish (173 | 16.9%), American (171 | 16.7%), English (147 | 14.3%), German (133 | 13.0%), and Greek (47 | 4.6%), together accounting for 65.4% of all Calvert Beach residents.
| Ancestry | # Population | % Population |
| American | 171 | 16.7% |
| British | 21 | 2.1% |
| Czech | 10 | 1.0% |
| Danish | 39 | 3.8% |
| English | 147 | 14.3% |
| French | 44 | 4.3% |
| French Canadian | 11 | 1.1% |
| German | 133 | 13.0% |
| Greek | 47 | 4.6% |
| Irish | 173 | 16.9% |
| Italian | 36 | 3.5% |
| Polish | 16 | 1.6% |
| Scotch-Irish | 8 | 0.8% |
| Scottish | 39 | 3.8% |
| Welsh | 16 | 1.6% | View All 15 Rows |
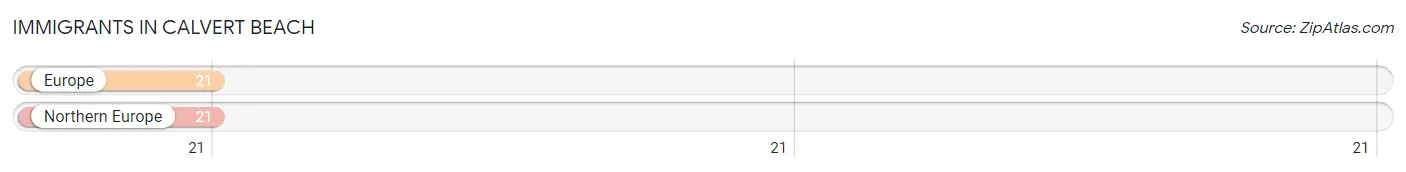
Immigrants in Calvert Beach
The most numerous immigrant groups reported in Calvert Beach came from Europe (21 | 2.1%), and Northern Europe (21 | 2.1%), together accounting for 4.1% of all Calvert Beach residents.
| Immigration Origin | # Population | % Population |
| Europe | 21 | 2.1% |
| Northern Europe | 21 | 2.1% | View All 2 Rows |
Sex and Age in Calvert Beach
Sex and Age in Calvert Beach
The most populous age groups in Calvert Beach are 40 to 44 Years (99 | 19.2%) for men and 5 to 9 Years (117 | 23.0%) for women.
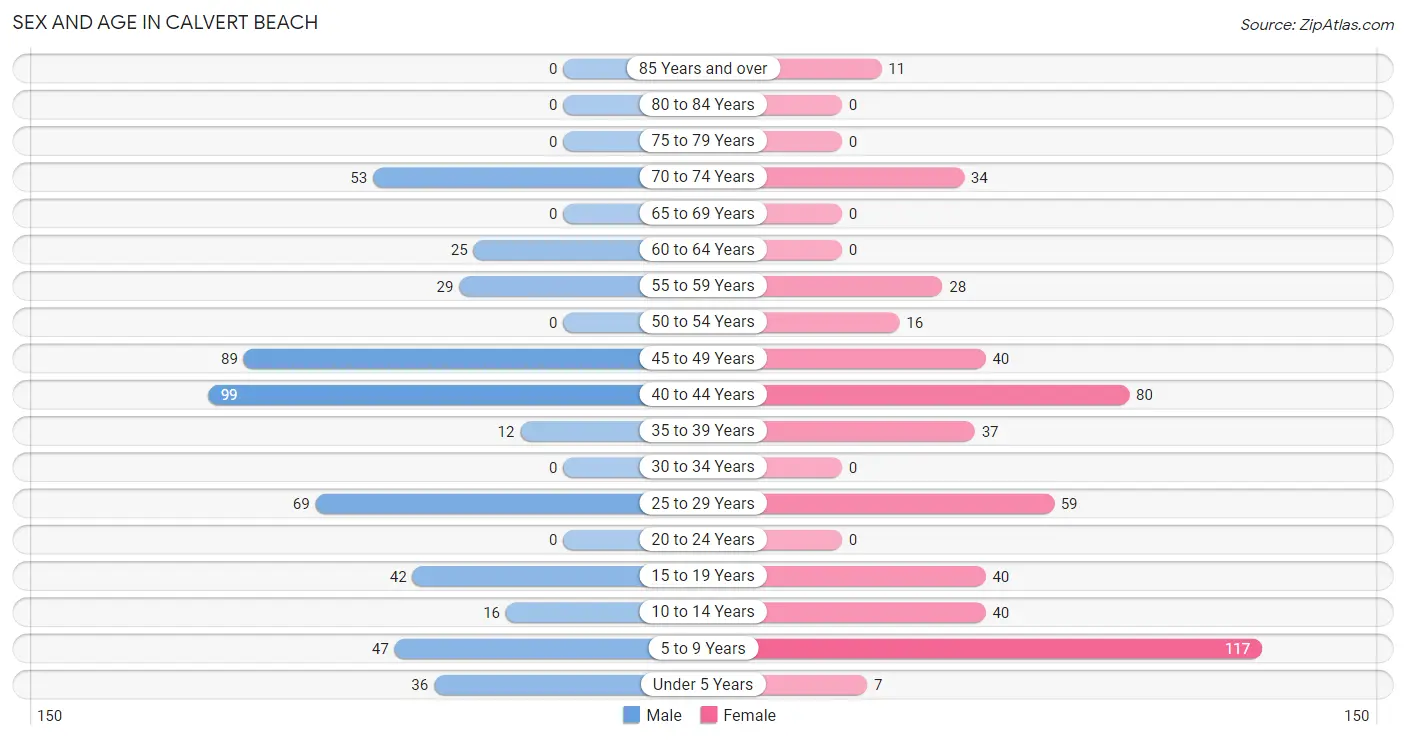
| Age Bracket | Male | Female |
| Under 5 Years | 36 (7.0%) | 7 (1.4%) |
| 5 to 9 Years | 47 (9.1%) | 117 (23.0%) |
| 10 to 14 Years | 16 (3.1%) | 40 (7.9%) |
| 15 to 19 Years | 42 (8.1%) | 40 (7.9%) |
| 20 to 24 Years | 0 (0.0%) | 0 (0.0%) |
| 25 to 29 Years | 69 (13.4%) | 59 (11.6%) |
| 30 to 34 Years | 0 (0.0%) | 0 (0.0%) |
| 35 to 39 Years | 12 (2.3%) | 37 (7.3%) |
| 40 to 44 Years | 99 (19.2%) | 80 (15.7%) |
| 45 to 49 Years | 89 (17.2%) | 40 (7.9%) |
| 50 to 54 Years | 0 (0.0%) | 16 (3.1%) |
| 55 to 59 Years | 29 (5.6%) | 28 (5.5%) |
| 60 to 64 Years | 25 (4.8%) | 0 (0.0%) |
| 65 to 69 Years | 0 (0.0%) | 0 (0.0%) |
| 70 to 74 Years | 53 (10.2%) | 34 (6.7%) |
| 75 to 79 Years | 0 (0.0%) | 0 (0.0%) |
| 80 to 84 Years | 0 (0.0%) | 0 (0.0%) |
| 85 Years and over | 0 (0.0%) | 11 (2.2%) |
| Total | 517 (100.0%) | 509 (100.0%) |
Families and Households in Calvert Beach
Median Family Size in Calvert Beach
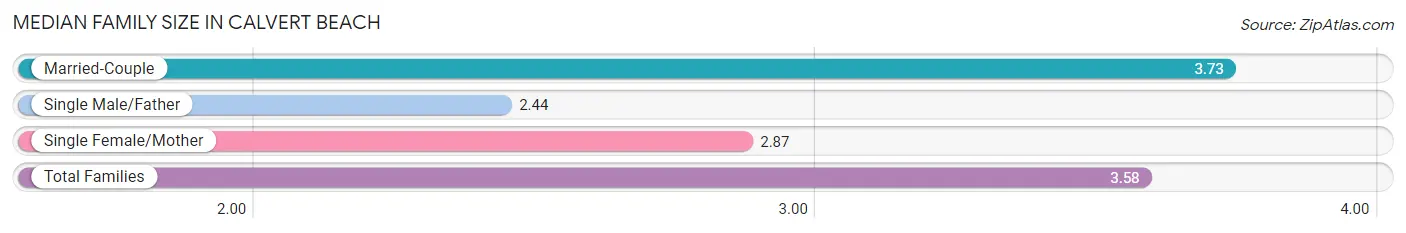
The median family size in Calvert Beach is 3.58 persons per family, with married-couple families (230 | 85.5%) accounting for the largest median family size of 3.73 persons per family. On the other hand, single male/father families (16 | 5.9%) represent the smallest median family size with 2.44 persons per family.
| Family Type | # Families | Family Size |
| Married-Couple | 230 (85.5%) | 3.73 |
| Single Male/Father | 16 (5.9%) | 2.44 |
| Single Female/Mother | 23 (8.6%) | 2.87 |
| Total Families | 269 (100.0%) | 3.58 |
Median Household Size in Calvert Beach
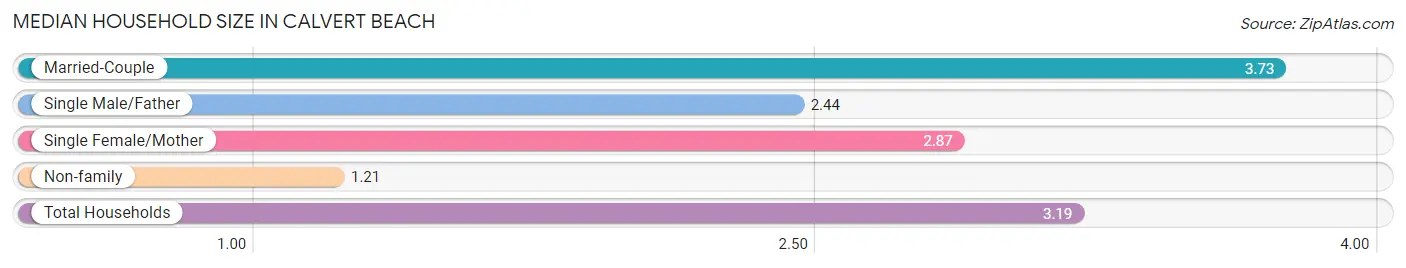
The median household size in Calvert Beach is 3.19 persons per household, with married-couple households (230 | 71.4%) accounting for the largest median household size of 3.73 persons per household. non-family households (53 | 16.5%) represent the smallest median household size with 1.21 persons per household.
| Household Type | # Households | Household Size |
| Married-Couple | 230 (71.4%) | 3.73 |
| Single Male/Father | 16 (5.0%) | 2.44 |
| Single Female/Mother | 23 (7.1%) | 2.87 |
| Non-family | 53 (16.5%) | 1.21 |
| Total Households | 322 (100.0%) | 3.19 |
Household Size by Marriage Status in Calvert Beach
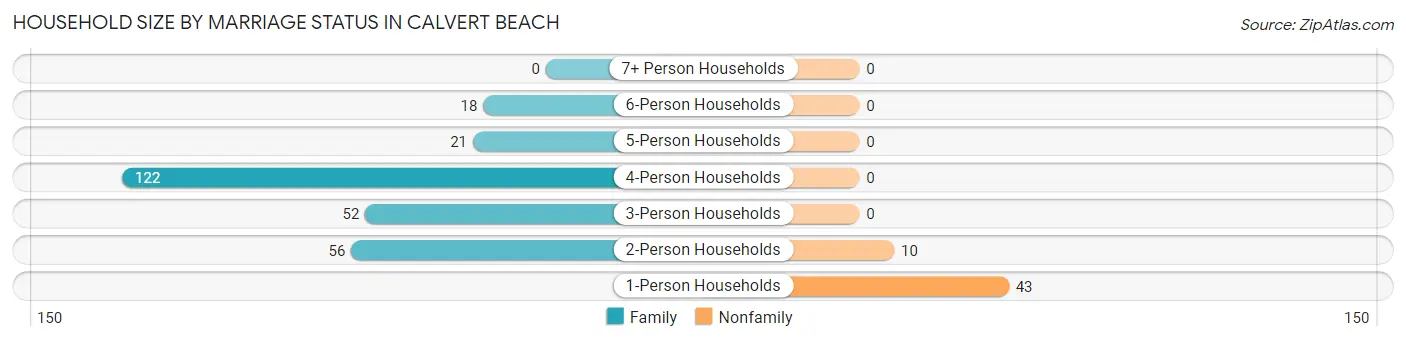
Out of a total of 322 households in Calvert Beach, 269 (83.5%) are family households, while 53 (16.5%) are nonfamily households. The most numerous type of family households are 4-person households, comprising 122, and the most common type of nonfamily households are 1-person households, comprising 43.
| Household Size | Family Households | Nonfamily Households |
| 1-Person Households | - | 43 (13.4%) |
| 2-Person Households | 56 (17.4%) | 10 (3.1%) |
| 3-Person Households | 52 (16.2%) | 0 (0.0%) |
| 4-Person Households | 122 (37.9%) | 0 (0.0%) |
| 5-Person Households | 21 (6.5%) | 0 (0.0%) |
| 6-Person Households | 18 (5.6%) | 0 (0.0%) |
| 7+ Person Households | 0 (0.0%) | 0 (0.0%) |
| Total | 269 (83.5%) | 53 (16.5%) |
Female Fertility in Calvert Beach
Fertility by Age in Calvert Beach
Average fertility rate in Calvert Beach is 55.0 births per 1,000 women. Women in the age bracket of 20 to 34 years have the highest fertility rate with 237.0 births per 1,000 women. Women in the age bracket of 20 to 34 years acount for 100.0% of all women with births.
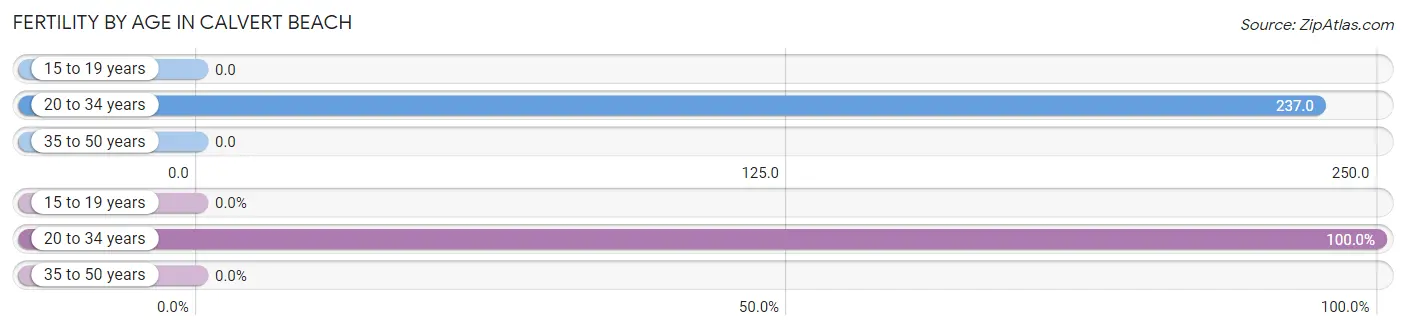
| Age Bracket | Women with Births | Births / 1,000 Women |
| 15 to 19 years | 0 (0.0%) | 0.0 |
| 20 to 34 years | 14 (100.0%) | 237.0 |
| 35 to 50 years | 0 (0.0%) | 0.0 |
| Total | 14 (100.0%) | 55.0 |
Fertility by Age by Marriage Status in Calvert Beach
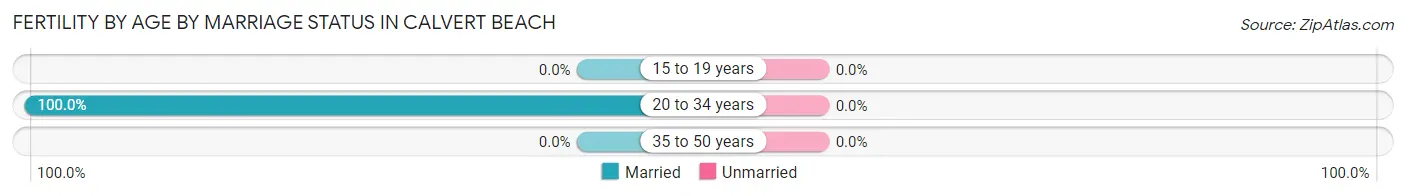
| Age Bracket | Married | Unmarried |
| 15 to 19 years | 0 (0.0%) | 0 (0.0%) |
| 20 to 34 years | 14 (100.0%) | 0 (0.0%) |
| 35 to 50 years | 0 (0.0%) | 0 (0.0%) |
| Total | 14 (100.0%) | 0 (0.0%) |
Fertility by Education in Calvert Beach
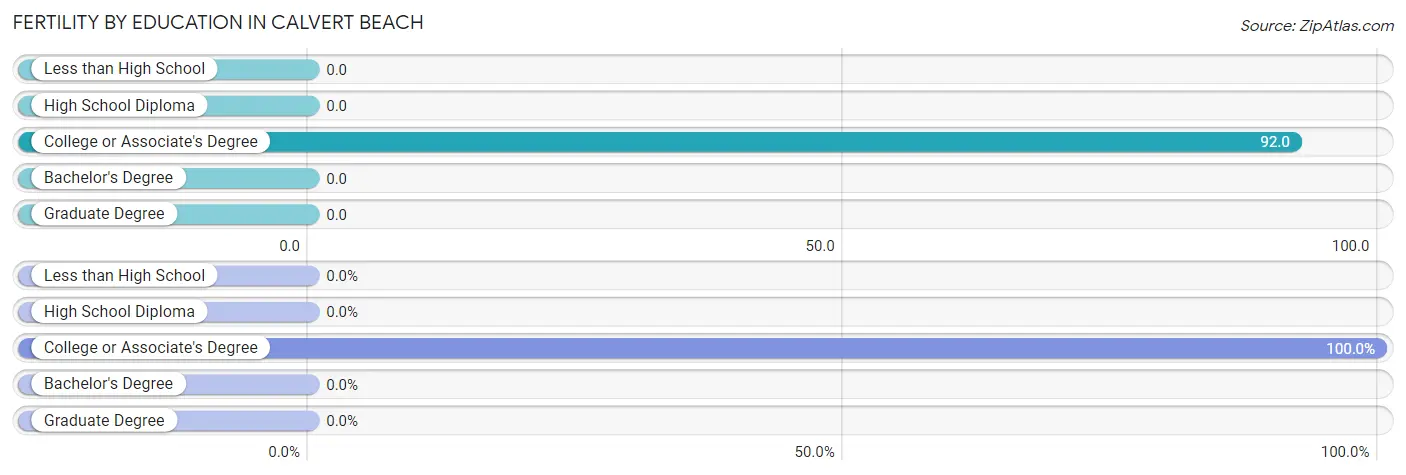
| Educational Attainment | Women with Births | Births / 1,000 Women |
| Less than High School | 0 (0.0%) | 0.0 |
| High School Diploma | 0 (0.0%) | 0.0 |
| College or Associate's Degree | 14 (100.0%) | 92.0 |
| Bachelor's Degree | 0 (0.0%) | 0.0 |
| Graduate Degree | 0 (0.0%) | 0.0 |
| Total | 14 (100.0%) | 55.0 |
Fertility by Education by Marriage Status in Calvert Beach
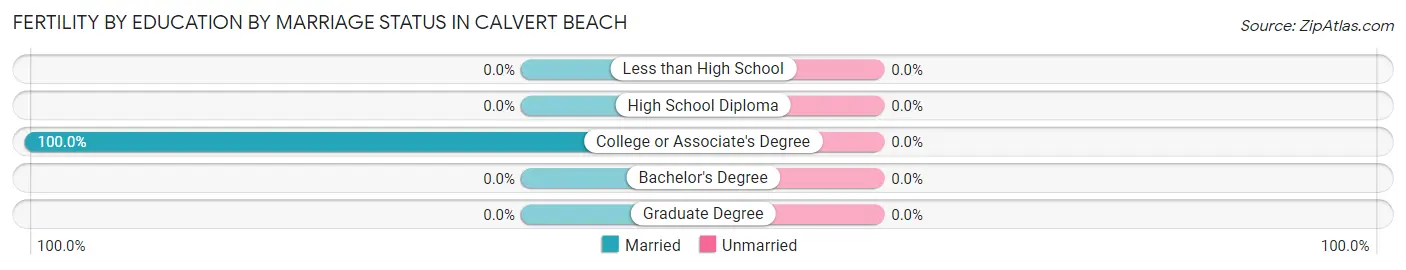
| Educational Attainment | Married | Unmarried |
| Less than High School | 0 (0.0%) | 0 (0.0%) |
| High School Diploma | 0 (0.0%) | 0 (0.0%) |
| College or Associate's Degree | 14 (100.0%) | 0 (0.0%) |
| Bachelor's Degree | 0 (0.0%) | 0 (0.0%) |
| Graduate Degree | 0 (0.0%) | 0 (0.0%) |
| Total | 14 (100.0%) | 0 (0.0%) |
Income in Calvert Beach
Income Overview in Calvert Beach
Per Capita Income in Calvert Beach is $34,408, while median incomes of families and households are $111,563 and $104,063 respectively.
| Characteristic | Number | Measure |
| Per Capita Income | 1,026 | $34,408 |
| Median Family Income | 269 | $111,563 |
| Mean Family Income | 269 | $111,461 |
| Median Household Income | 322 | $104,063 |
| Mean Household Income | 322 | $104,296 |
| Income Deficit | 269 | $0 |
| Wage / Income Gap (%) | 1,026 | 0.00% |
| Wage / Income Gap ($) | 1,026 | 100.00¢ per $1 |
| Gini / Inequality Index | 1,026 | 0.33 |
Earnings by Sex in Calvert Beach
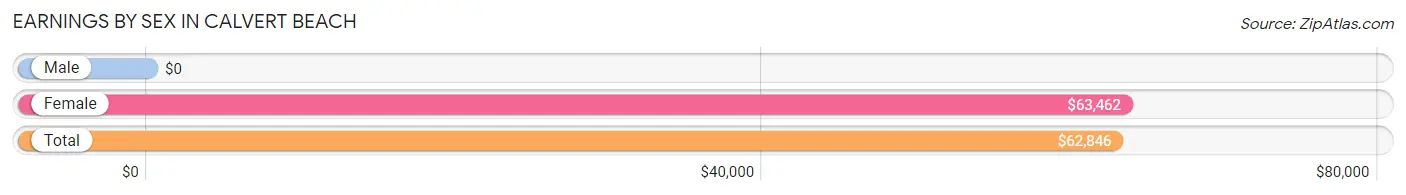
| Sex | Number | Average Earnings |
| Male | 318 (56.4%) | $0 |
| Female | 246 (43.6%) | $63,462 |
| Total | 564 (100.0%) | $62,846 |
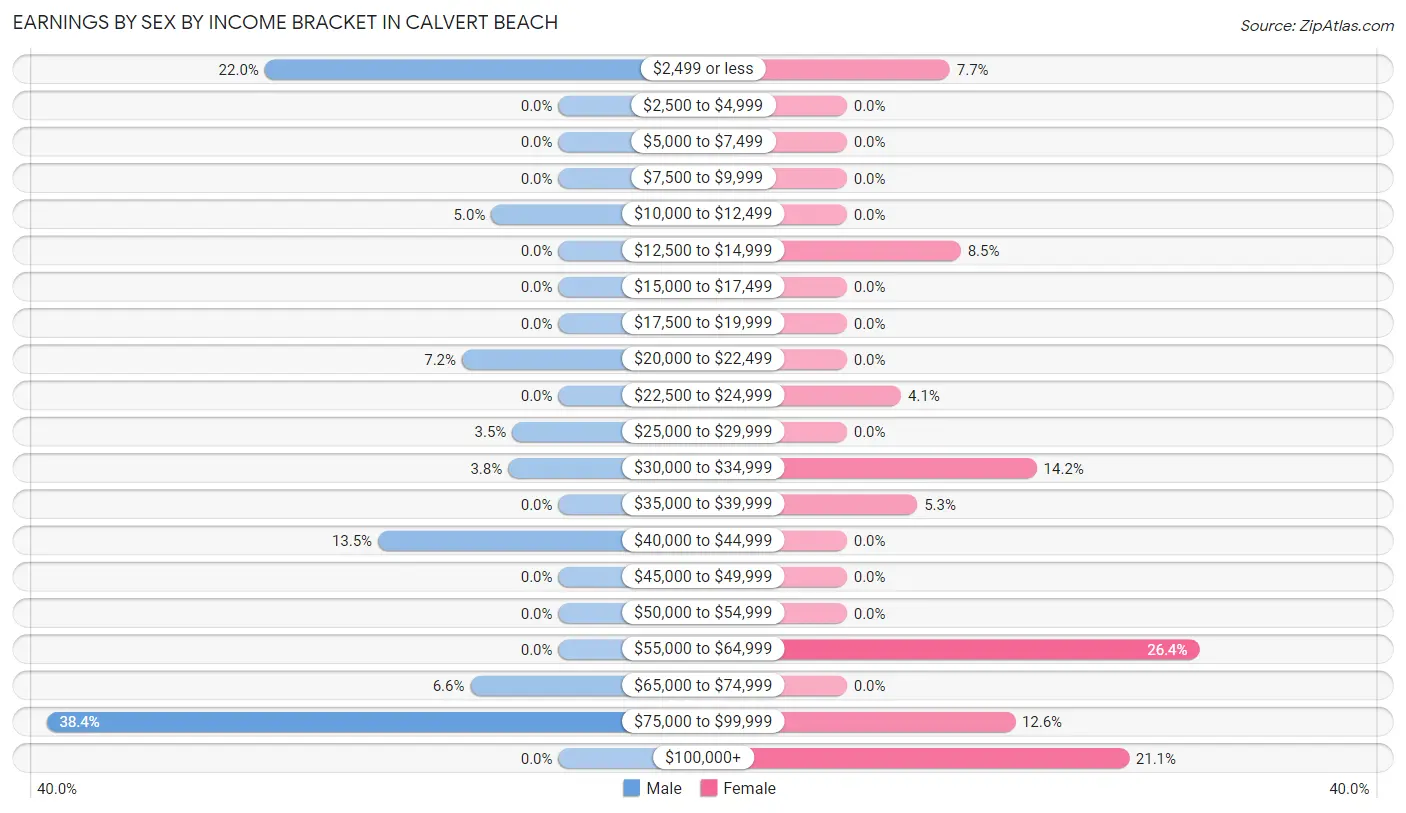
Earnings by Sex by Income Bracket in Calvert Beach
The most common earnings brackets in Calvert Beach are $75,000 to $99,999 for men (122 | 38.4%) and $55,000 to $64,999 for women (65 | 26.4%).
| Income | Male | Female |
| $2,499 or less | 70 (22.0%) | 19 (7.7%) |
| $2,500 to $4,999 | 0 (0.0%) | 0 (0.0%) |
| $5,000 to $7,499 | 0 (0.0%) | 0 (0.0%) |
| $7,500 to $9,999 | 0 (0.0%) | 0 (0.0%) |
| $10,000 to $12,499 | 16 (5.0%) | 0 (0.0%) |
| $12,500 to $14,999 | 0 (0.0%) | 21 (8.5%) |
| $15,000 to $17,499 | 0 (0.0%) | 0 (0.0%) |
| $17,500 to $19,999 | 0 (0.0%) | 0 (0.0%) |
| $20,000 to $22,499 | 23 (7.2%) | 0 (0.0%) |
| $22,500 to $24,999 | 0 (0.0%) | 10 (4.1%) |
| $25,000 to $29,999 | 11 (3.5%) | 0 (0.0%) |
| $30,000 to $34,999 | 12 (3.8%) | 35 (14.2%) |
| $35,000 to $39,999 | 0 (0.0%) | 13 (5.3%) |
| $40,000 to $44,999 | 43 (13.5%) | 0 (0.0%) |
| $45,000 to $49,999 | 0 (0.0%) | 0 (0.0%) |
| $50,000 to $54,999 | 0 (0.0%) | 0 (0.0%) |
| $55,000 to $64,999 | 0 (0.0%) | 65 (26.4%) |
| $65,000 to $74,999 | 21 (6.6%) | 0 (0.0%) |
| $75,000 to $99,999 | 122 (38.4%) | 31 (12.6%) |
| $100,000+ | 0 (0.0%) | 52 (21.1%) |
| Total | 318 (100.0%) | 246 (100.0%) |
Earnings by Sex by Educational Attainment in Calvert Beach
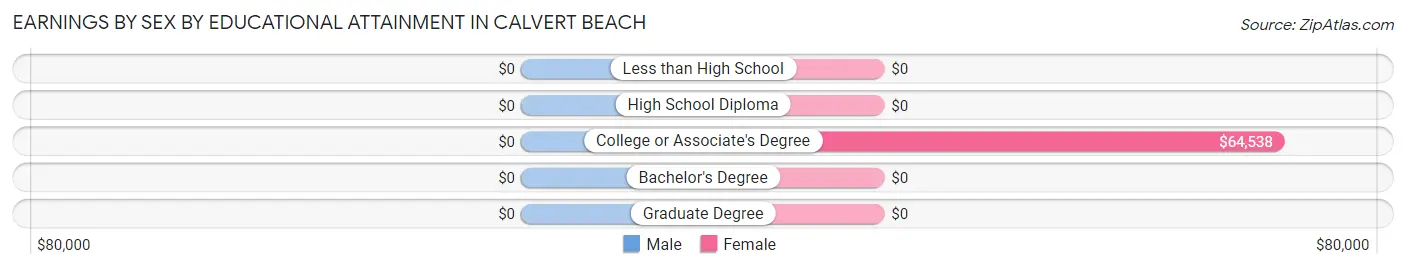
| Educational Attainment | Male Income | Female Income |
| Less than High School | - | - |
| High School Diploma | - | - |
| College or Associate's Degree | - | - |
| Bachelor's Degree | - | - |
| Graduate Degree | - | - |
| Total | $67,560 | $64,231 |
Family Income in Calvert Beach
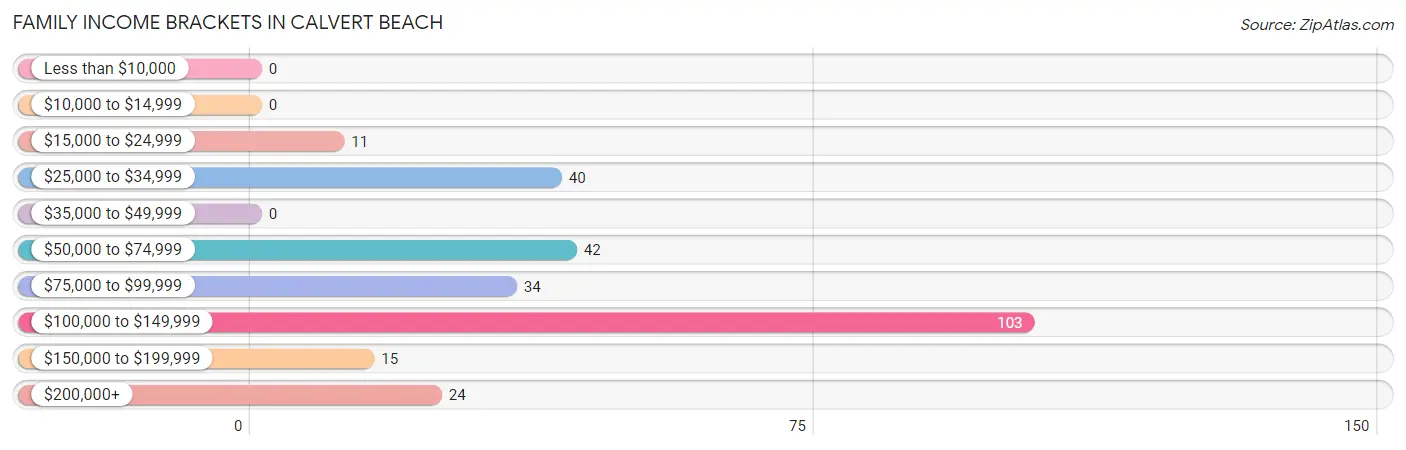
Family Income Brackets in Calvert Beach
According to the Calvert Beach family income data, there are 103 families falling into the $100,000 to $149,999 income range, which is the most common income bracket and makes up 38.3% of all families.
| Income Bracket | # Families | % Families |
| Less than $10,000 | 0 | 0.0% |
| $10,000 to $14,999 | 0 | 0.0% |
| $15,000 to $24,999 | 11 | 4.1% |
| $25,000 to $34,999 | 40 | 14.9% |
| $35,000 to $49,999 | 0 | 0.0% |
| $50,000 to $74,999 | 42 | 15.6% |
| $75,000 to $99,999 | 34 | 12.6% |
| $100,000 to $149,999 | 103 | 38.3% |
| $150,000 to $199,999 | 15 | 5.6% |
| $200,000+ | 24 | 8.9% |
Family Income by Famaliy Size in Calvert Beach
2-person families (56 | 20.8%) account for the highest median family income in Calvert Beach with $57,024 per family, while 2-person families (56 | 20.8%) have the highest median income of $28,512 per family member.
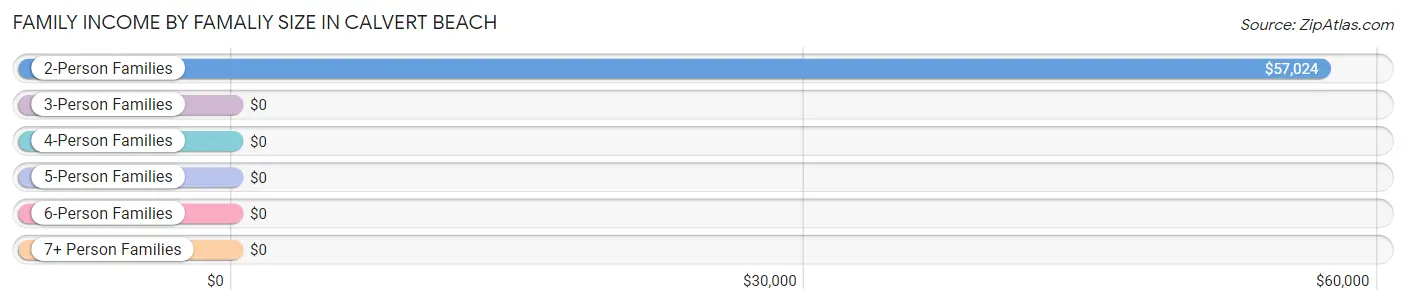
| Income Bracket | # Families | Median Income |
| 2-Person Families | 56 (20.8%) | $57,024 |
| 3-Person Families | 52 (19.3%) | $0 |
| 4-Person Families | 122 (45.4%) | $0 |
| 5-Person Families | 21 (7.8%) | $0 |
| 6-Person Families | 18 (6.7%) | $0 |
| 7+ Person Families | 0 (0.0%) | $0 |
| Total | 269 (100.0%) | $111,563 |
Family Income by Number of Earners in Calvert Beach
The median family income in Calvert Beach is $111,563, with families comprising 3+ earners (55) having the highest median family income of $184,417, while families with no earners (40) have the lowest median family income of $56,071, accounting for 20.4% and 14.9% of families, respectively.
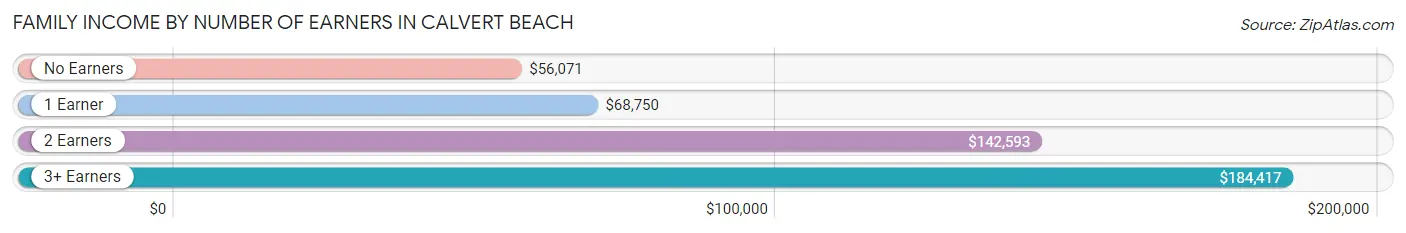
| Number of Earners | # Families | Median Income |
| No Earners | 40 (14.9%) | $56,071 |
| 1 Earner | 45 (16.7%) | $68,750 |
| 2 Earners | 129 (48.0%) | $142,593 |
| 3+ Earners | 55 (20.4%) | $184,417 |
| Total | 269 (100.0%) | $111,563 |
Household Income in Calvert Beach
Household Income Brackets in Calvert Beach
With 127 households falling in the category, the $100,000 to $149,999 income range is the most frequent in Calvert Beach, accounting for 39.4% of all households.
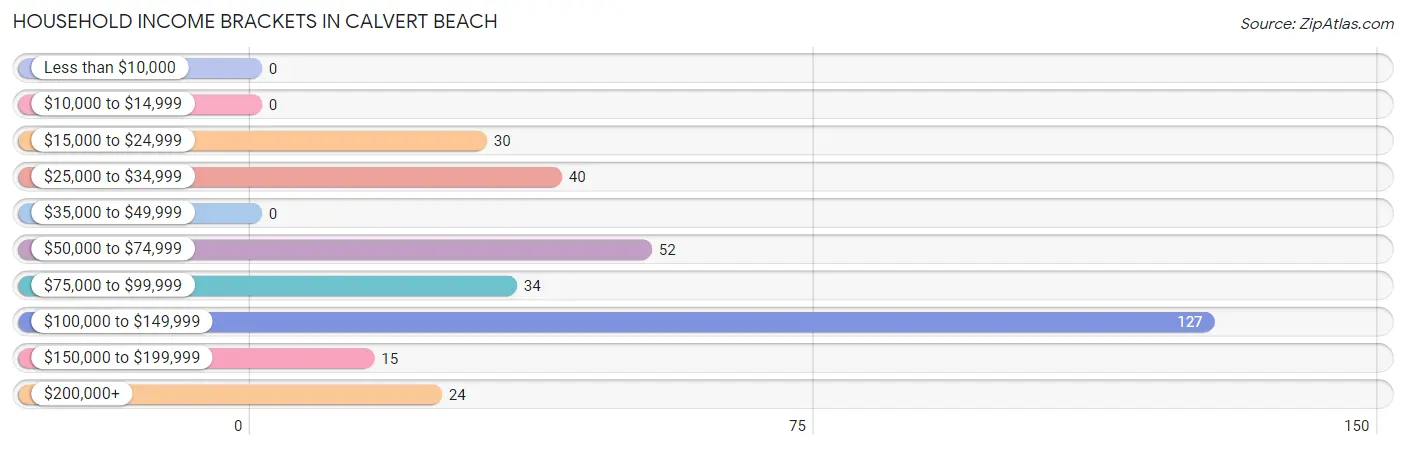
| Income Bracket | # Households | % Households |
| Less than $10,000 | 0 | 0.0% |
| $10,000 to $14,999 | 0 | 0.0% |
| $15,000 to $24,999 | 30 | 9.3% |
| $25,000 to $34,999 | 40 | 12.4% |
| $35,000 to $49,999 | 0 | 0.0% |
| $50,000 to $74,999 | 52 | 16.1% |
| $75,000 to $99,999 | 34 | 10.6% |
| $100,000 to $149,999 | 127 | 39.4% |
| $150,000 to $199,999 | 15 | 4.7% |
| $200,000+ | 24 | 7.5% |
Household Income by Householder Age in Calvert Beach
The median household income in Calvert Beach is $104,063, with the highest median household income of $142,668 found in the 25 to 44 years age bracket for the primary householder. A total of 155 households (48.1%) fall into this category.
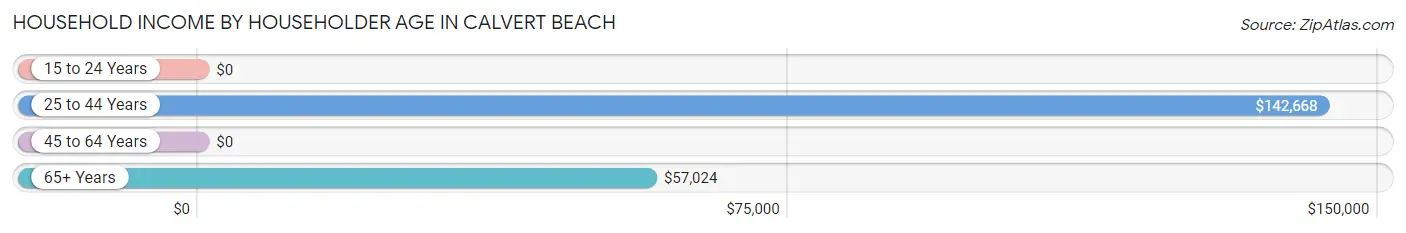
| Income Bracket | # Households | Median Income |
| 15 to 24 Years | 0 (0.0%) | $0 |
| 25 to 44 Years | 155 (48.1%) | $142,668 |
| 45 to 64 Years | 95 (29.5%) | $0 |
| 65+ Years | 72 (22.4%) | $57,024 |
| Total | 322 (100.0%) | $104,063 |
Poverty in Calvert Beach
Income Below Poverty by Sex and Age in Calvert Beach
| Age Bracket | Male | Female |
| Under 5 Years | 0 (0.0%) | 0 (0.0%) |
| 5 Years | 0 (0.0%) | 0 (0.0%) |
| 6 to 11 Years | 0 (0.0%) | 0 (0.0%) |
| 12 to 14 Years | 0 (0.0%) | 0 (0.0%) |
| 15 Years | 0 (0.0%) | 0 (0.0%) |
| 16 and 17 Years | 0 (0.0%) | 0 (0.0%) |
| 18 to 24 Years | 0 (0.0%) | 0 (0.0%) |
| 25 to 34 Years | 0 (0.0%) | 0 (0.0%) |
| 35 to 44 Years | 0 (0.0%) | 0 (0.0%) |
| 45 to 54 Years | 0 (0.0%) | 0 (0.0%) |
| 55 to 64 Years | 0 (0.0%) | 0 (0.0%) |
| 65 to 74 Years | 0 (0.0%) | 0 (0.0%) |
| 75 Years and over | 0 (0.0%) | 0 (0.0%) |
| Total | 0 (0.0%) | 0 (0.0%) |
Income Above Poverty by Sex and Age in Calvert Beach
According to the poverty statistics in Calvert Beach, males aged under 5 years and females aged under 5 years are the age groups that are most secure financially, with 100.0% of males and 100.0% of females in these age groups living above the poverty line.
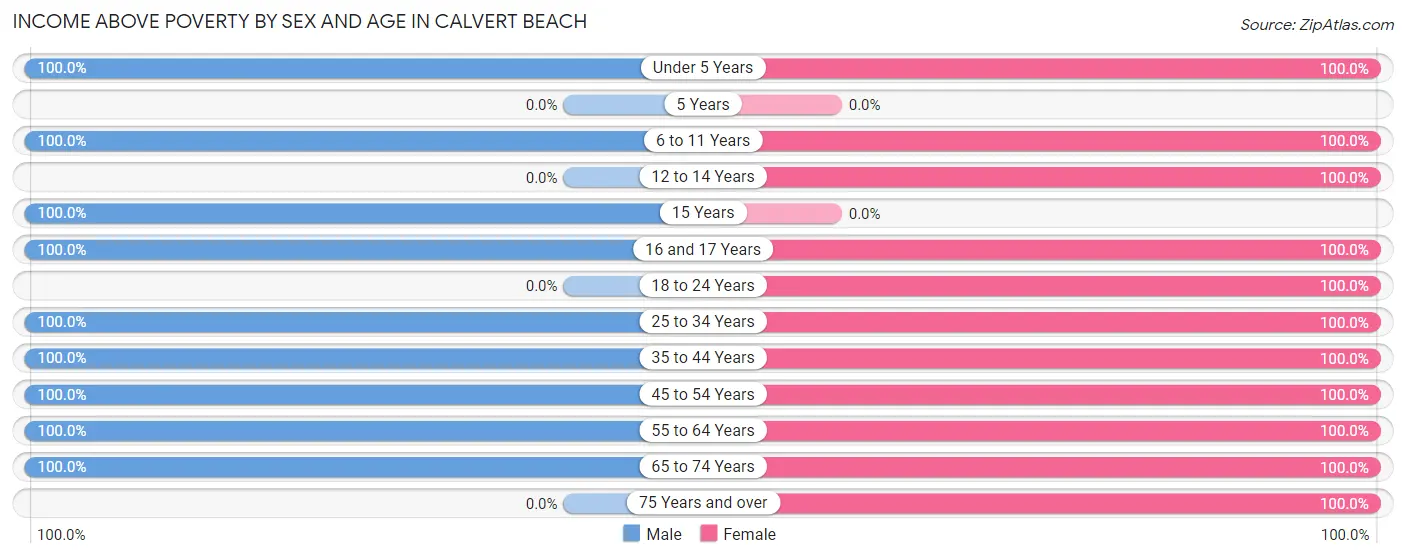
| Age Bracket | Male | Female |
| Under 5 Years | 36 (100.0%) | 7 (100.0%) |
| 5 Years | 0 (0.0%) | 0 (0.0%) |
| 6 to 11 Years | 63 (100.0%) | 144 (100.0%) |
| 12 to 14 Years | 0 (0.0%) | 13 (100.0%) |
| 15 Years | 9 (100.0%) | 0 (0.0%) |
| 16 and 17 Years | 33 (100.0%) | 19 (100.0%) |
| 18 to 24 Years | 0 (0.0%) | 21 (100.0%) |
| 25 to 34 Years | 69 (100.0%) | 59 (100.0%) |
| 35 to 44 Years | 111 (100.0%) | 117 (100.0%) |
| 45 to 54 Years | 89 (100.0%) | 56 (100.0%) |
| 55 to 64 Years | 54 (100.0%) | 28 (100.0%) |
| 65 to 74 Years | 53 (100.0%) | 34 (100.0%) |
| 75 Years and over | 0 (0.0%) | 11 (100.0%) |
| Total | 517 (100.0%) | 509 (100.0%) |
Income Below Poverty Among Married-Couple Families in Calvert Beach
| Children | Above Poverty | Below Poverty |
| No Children | 57 (100.0%) | 0 (0.0%) |
| 1 or 2 Children | 134 (100.0%) | 0 (0.0%) |
| 3 or 4 Children | 39 (100.0%) | 0 (0.0%) |
| 5 or more Children | 0 (0.0%) | 0 (0.0%) |
| Total | 230 (100.0%) | 0 (0.0%) |
Income Below Poverty Among Single-Parent Households in Calvert Beach
| Children | Single Father | Single Mother |
| No Children | 0 (0.0%) | 0 (0.0%) |
| 1 or 2 Children | 0 (0.0%) | 0 (0.0%) |
| 3 or 4 Children | 0 (0.0%) | 0 (0.0%) |
| 5 or more Children | 0 (0.0%) | 0 (0.0%) |
| Total | 0 (0.0%) | 0 (0.0%) |
Income Below Poverty Among Married-Couple vs Single-Parent Households in Calvert Beach
| Children | Married-Couple Families | Single-Parent Households |
| No Children | 0 (0.0%) | 0 (0.0%) |
| 1 or 2 Children | 0 (0.0%) | 0 (0.0%) |
| 3 or 4 Children | 0 (0.0%) | 0 (0.0%) |
| 5 or more Children | 0 (0.0%) | 0 (0.0%) |
| Total | 0 (0.0%) | 0 (0.0%) |
Employment Characteristics in Calvert Beach
Employment by Class of Employer in Calvert Beach
Among the 489 employed individuals in Calvert Beach, private company employees (337 | 68.9%), federal government employees (57 | 11.7%), and self-employed (not incorporated) (35 | 7.2%) make up the most common classes of employment.
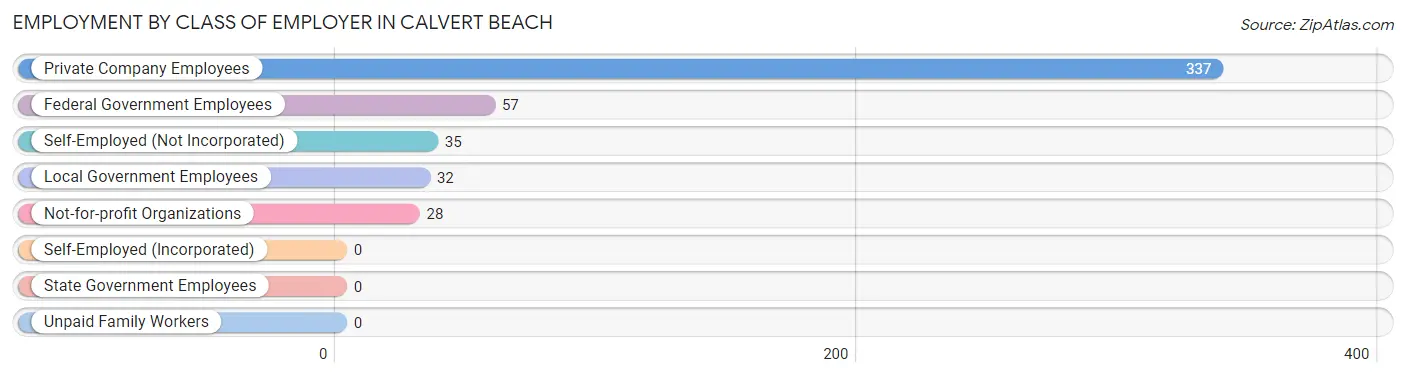
| Employer Class | # Employees | % Employees |
| Private Company Employees | 337 | 68.9% |
| Self-Employed (Incorporated) | 0 | 0.0% |
| Self-Employed (Not Incorporated) | 35 | 7.2% |
| Not-for-profit Organizations | 28 | 5.7% |
| Local Government Employees | 32 | 6.5% |
| State Government Employees | 0 | 0.0% |
| Federal Government Employees | 57 | 11.7% |
| Unpaid Family Workers | 0 | 0.0% |
| Total | 489 | 100.0% |
Employment Status by Age in Calvert Beach
According to the labor force statistics for Calvert Beach, out of the total population over 16 years of age (754), 67.9% or 512 individuals are in the labor force, with 4.6% or 24 of them unemployed. The age group with the highest labor force participation rate is 45 to 54 years, with 100.0% or 145 individuals in the labor force. Within the labor force, the 45 to 54 years age range has the highest percentage of unemployed individuals, with 15.9% or 23 of them being unemployed.
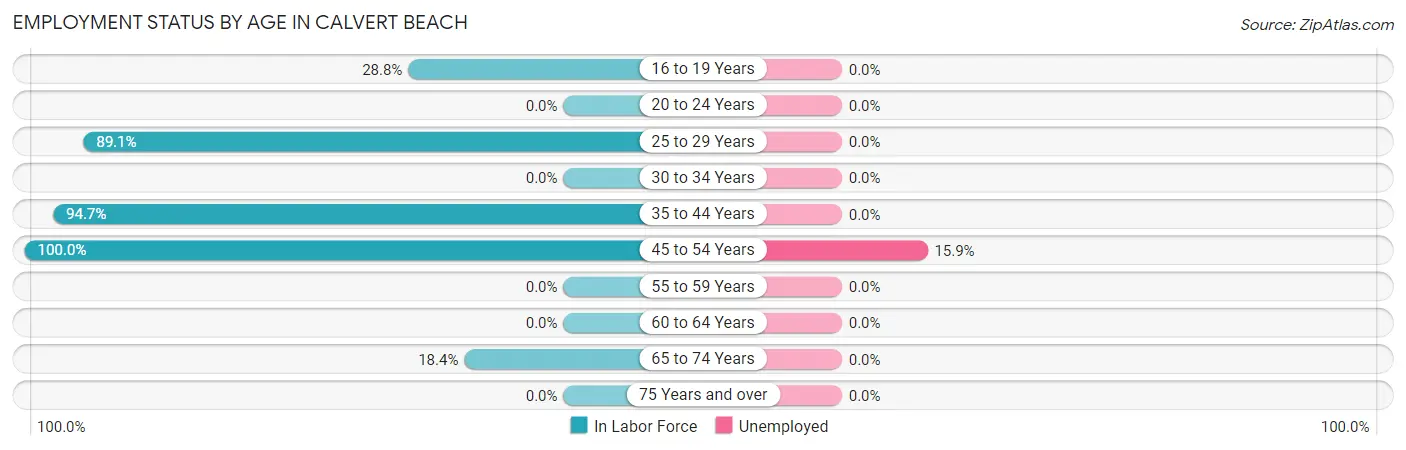
| Age Bracket | In Labor Force | Unemployed |
| 16 to 19 Years | 21 (28.8%) | 0 (0.0%) |
| 20 to 24 Years | 0 (0.0%) | 0 (0.0%) |
| 25 to 29 Years | 114 (89.1%) | 0 (0.0%) |
| 30 to 34 Years | 0 (0.0%) | 0 (0.0%) |
| 35 to 44 Years | 216 (94.7%) | 0 (0.0%) |
| 45 to 54 Years | 145 (100.0%) | 23 (15.9%) |
| 55 to 59 Years | 0 (0.0%) | 0 (0.0%) |
| 60 to 64 Years | 0 (0.0%) | 0 (0.0%) |
| 65 to 74 Years | 16 (18.4%) | 0 (0.0%) |
| 75 Years and over | 0 (0.0%) | 0 (0.0%) |
| Total | 512 (67.9%) | 24 (4.6%) |
Employment Status by Educational Attainment in Calvert Beach
According to labor force statistics for Calvert Beach, 81.5% of individuals (475) out of the total population between 25 and 64 years of age (583) are in the labor force, with 5.0% or 24 of them being unemployed. The group with the highest labor force participation rate are those with the educational attainment of less than high school, with 100.0% or 18 individuals in the labor force. Within the labor force, individuals with high school diploma education have the highest percentage of unemployment, with 10.1% or 23 of them being unemployed.
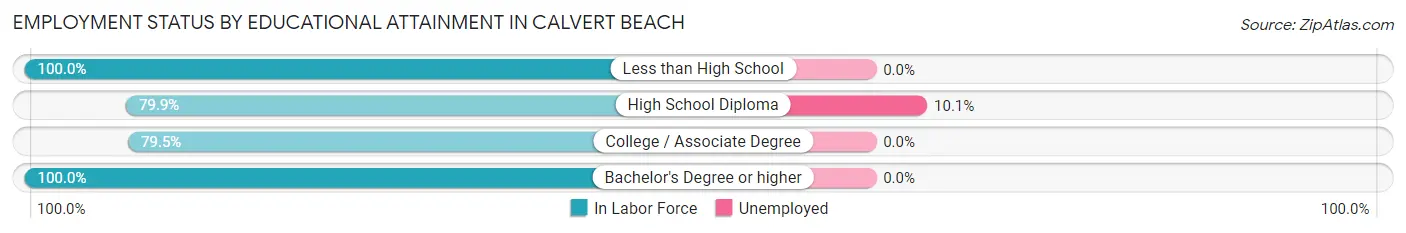
| Educational Attainment | In Labor Force | Unemployed |
| Less than High School | 18 (100.0%) | 0 (0.0%) |
| High School Diploma | 227 (79.9%) | 29 (10.1%) |
| College / Associate Degree | 198 (79.5%) | 0 (0.0%) |
| Bachelor's Degree or higher | 32 (100.0%) | 0 (0.0%) |
| Total | 475 (81.5%) | 29 (5.0%) |
Employment Occupations by Sex in Calvert Beach
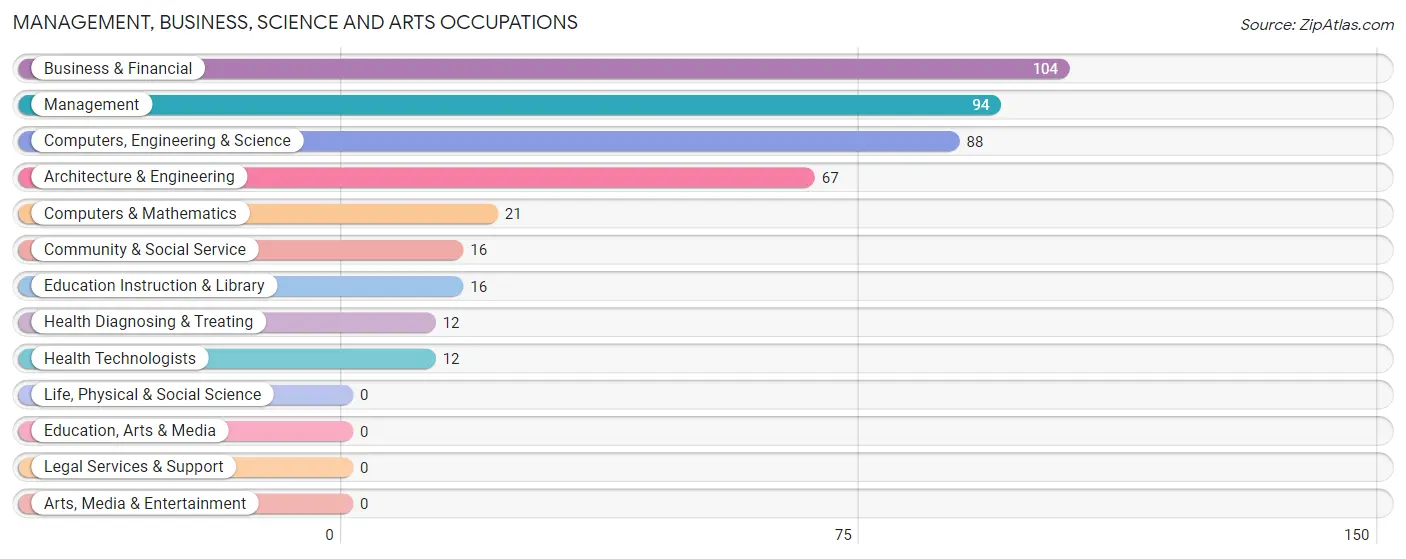
Management, Business, Science and Arts Occupations
The most common Management, Business, Science and Arts occupations in Calvert Beach are Business & Financial (104 | 21.8%), Management (94 | 19.7%), Computers, Engineering & Science (88 | 18.4%), Architecture & Engineering (67 | 14.1%), and Computers & Mathematics (21 | 4.4%).
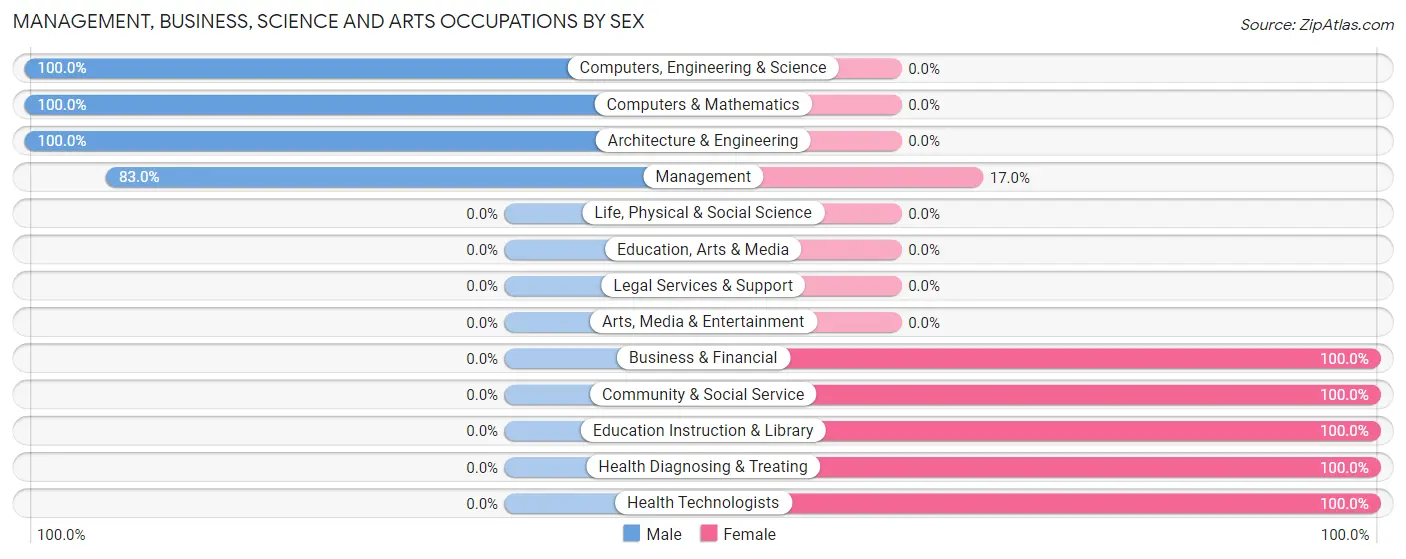
Management, Business, Science and Arts Occupations by Sex
Within the Management, Business, Science and Arts occupations in Calvert Beach, the most male-oriented occupations are Computers, Engineering & Science (100.0%), Computers & Mathematics (100.0%), and Architecture & Engineering (100.0%), while the most female-oriented occupations are Business & Financial (100.0%), Community & Social Service (100.0%), and Education Instruction & Library (100.0%).
| Occupation | Male | Female |
| Management | 78 (83.0%) | 16 (17.0%) |
| Business & Financial | 0 (0.0%) | 104 (100.0%) |
| Computers, Engineering & Science | 88 (100.0%) | 0 (0.0%) |
| Computers & Mathematics | 21 (100.0%) | 0 (0.0%) |
| Architecture & Engineering | 67 (100.0%) | 0 (0.0%) |
| Life, Physical & Social Science | 0 (0.0%) | 0 (0.0%) |
| Community & Social Service | 0 (0.0%) | 16 (100.0%) |
| Education, Arts & Media | 0 (0.0%) | 0 (0.0%) |
| Legal Services & Support | 0 (0.0%) | 0 (0.0%) |
| Education Instruction & Library | 0 (0.0%) | 16 (100.0%) |
| Arts, Media & Entertainment | 0 (0.0%) | 0 (0.0%) |
| Health Diagnosing & Treating | 0 (0.0%) | 12 (100.0%) |
| Health Technologists | 0 (0.0%) | 12 (100.0%) |
| Total (Category) | 166 (52.9%) | 148 (47.1%) |
| Total (Overall) | 250 (52.4%) | 227 (47.6%) |
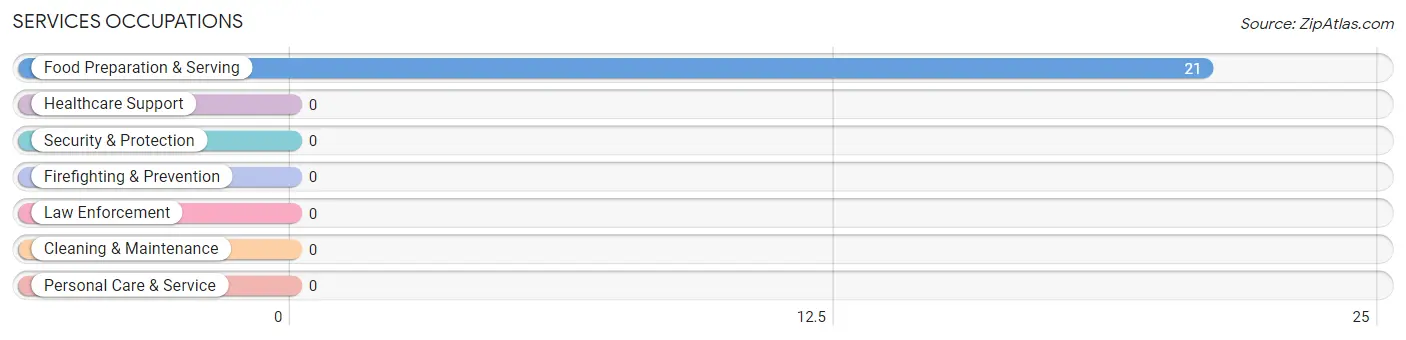
Services Occupations
The most common Services occupations in Calvert Beach are , and Food Preparation & Serving (21 | 4.4%).
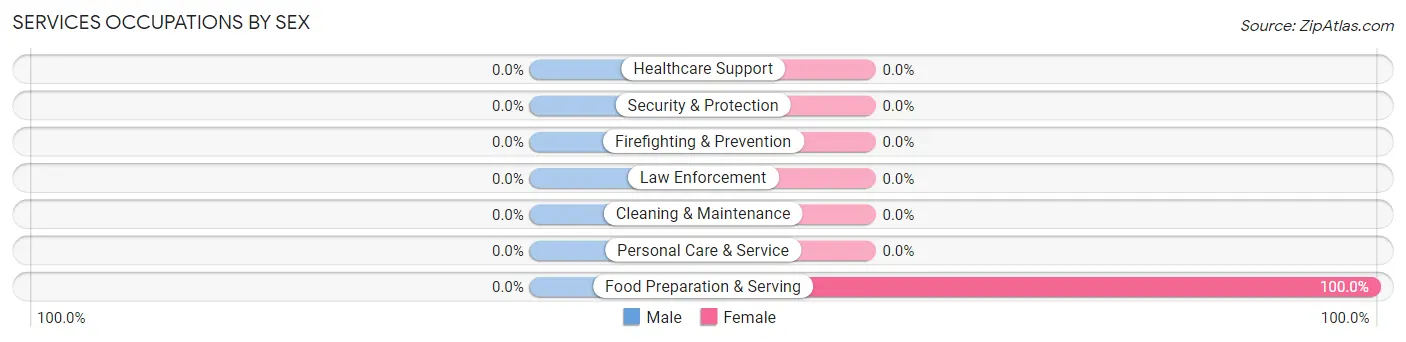
Services Occupations by Sex
| Occupation | Male | Female |
| Healthcare Support | 0 (0.0%) | 0 (0.0%) |
| Security & Protection | 0 (0.0%) | 0 (0.0%) |
| Firefighting & Prevention | 0 (0.0%) | 0 (0.0%) |
| Law Enforcement | 0 (0.0%) | 0 (0.0%) |
| Food Preparation & Serving | 0 (0.0%) | 21 (100.0%) |
| Cleaning & Maintenance | 0 (0.0%) | 0 (0.0%) |
| Personal Care & Service | 0 (0.0%) | 0 (0.0%) |
| Total (Category) | 0 (0.0%) | 21 (100.0%) |
| Total (Overall) | 250 (52.4%) | 227 (47.6%) |
Sales and Office Occupations
The most common Sales and Office occupations in Calvert Beach are Sales & Related (28 | 5.9%), and Office & Administration (13 | 2.7%).
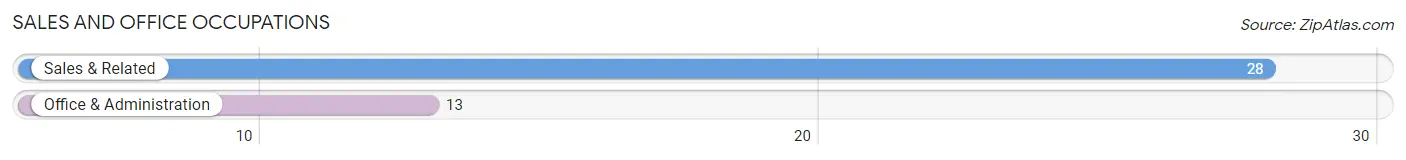
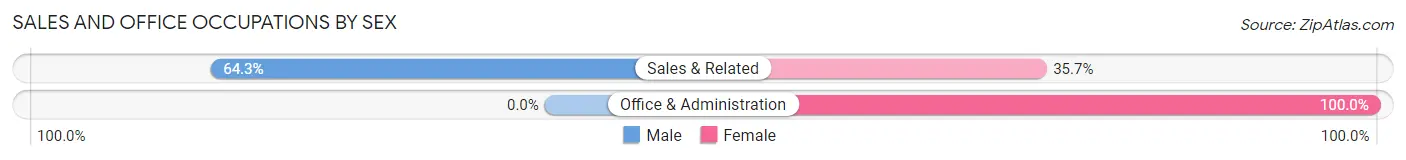
Sales and Office Occupations by Sex
| Occupation | Male | Female |
| Sales & Related | 18 (64.3%) | 10 (35.7%) |
| Office & Administration | 0 (0.0%) | 13 (100.0%) |
| Total (Category) | 18 (43.9%) | 23 (56.1%) |
| Total (Overall) | 250 (52.4%) | 227 (47.6%) |
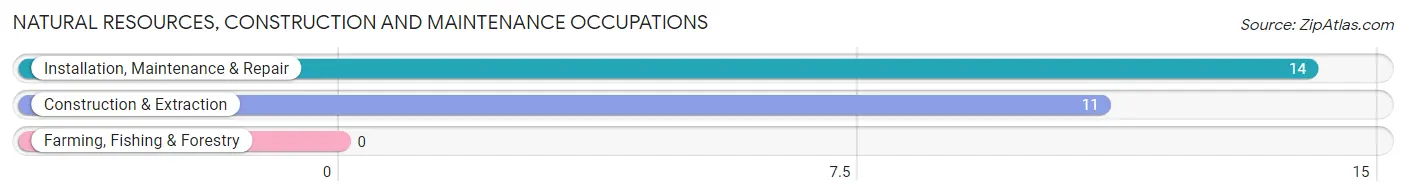
Natural Resources, Construction and Maintenance Occupations
The most common Natural Resources, Construction and Maintenance occupations in Calvert Beach are Installation, Maintenance & Repair (14 | 2.9%), and Construction & Extraction (11 | 2.3%).
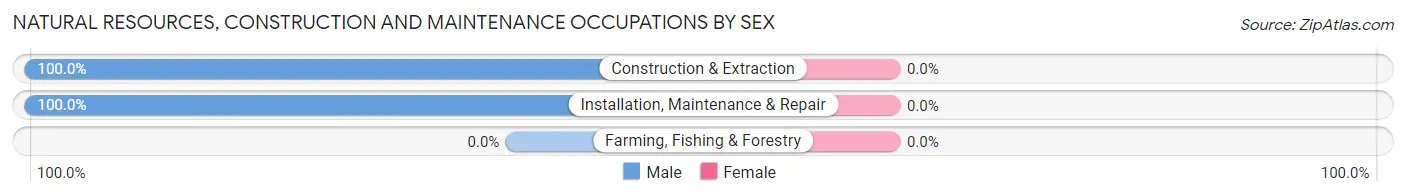
Natural Resources, Construction and Maintenance Occupations by Sex
| Occupation | Male | Female |
| Farming, Fishing & Forestry | 0 (0.0%) | 0 (0.0%) |
| Construction & Extraction | 11 (100.0%) | 0 (0.0%) |
| Installation, Maintenance & Repair | 14 (100.0%) | 0 (0.0%) |
| Total (Category) | 25 (100.0%) | 0 (0.0%) |
| Total (Overall) | 250 (52.4%) | 227 (47.6%) |
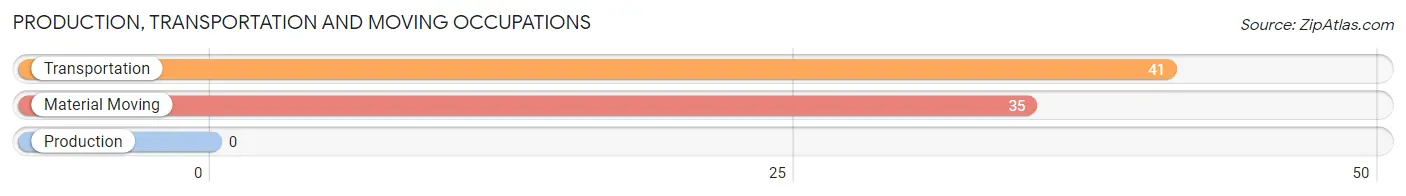
Production, Transportation and Moving Occupations
The most common Production, Transportation and Moving occupations in Calvert Beach are Transportation (41 | 8.6%), and Material Moving (35 | 7.3%).
Production, Transportation and Moving Occupations by Sex
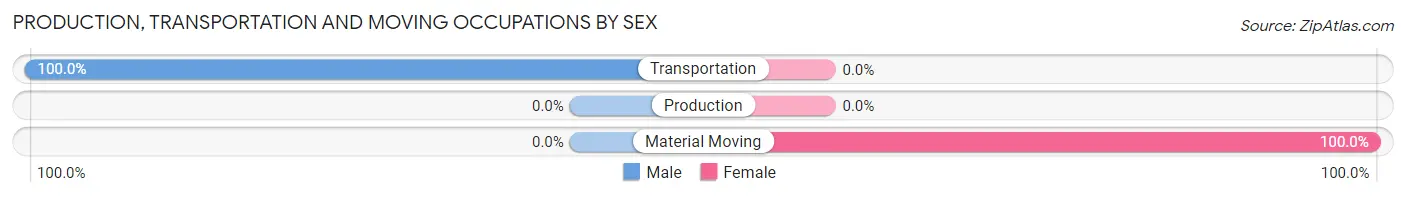
| Occupation | Male | Female |
| Production | 0 (0.0%) | 0 (0.0%) |
| Transportation | 41 (100.0%) | 0 (0.0%) |
| Material Moving | 0 (0.0%) | 35 (100.0%) |
| Total (Category) | 41 (53.9%) | 35 (46.1%) |
| Total (Overall) | 250 (52.4%) | 227 (47.6%) |
Employment Industries by Sex in Calvert Beach
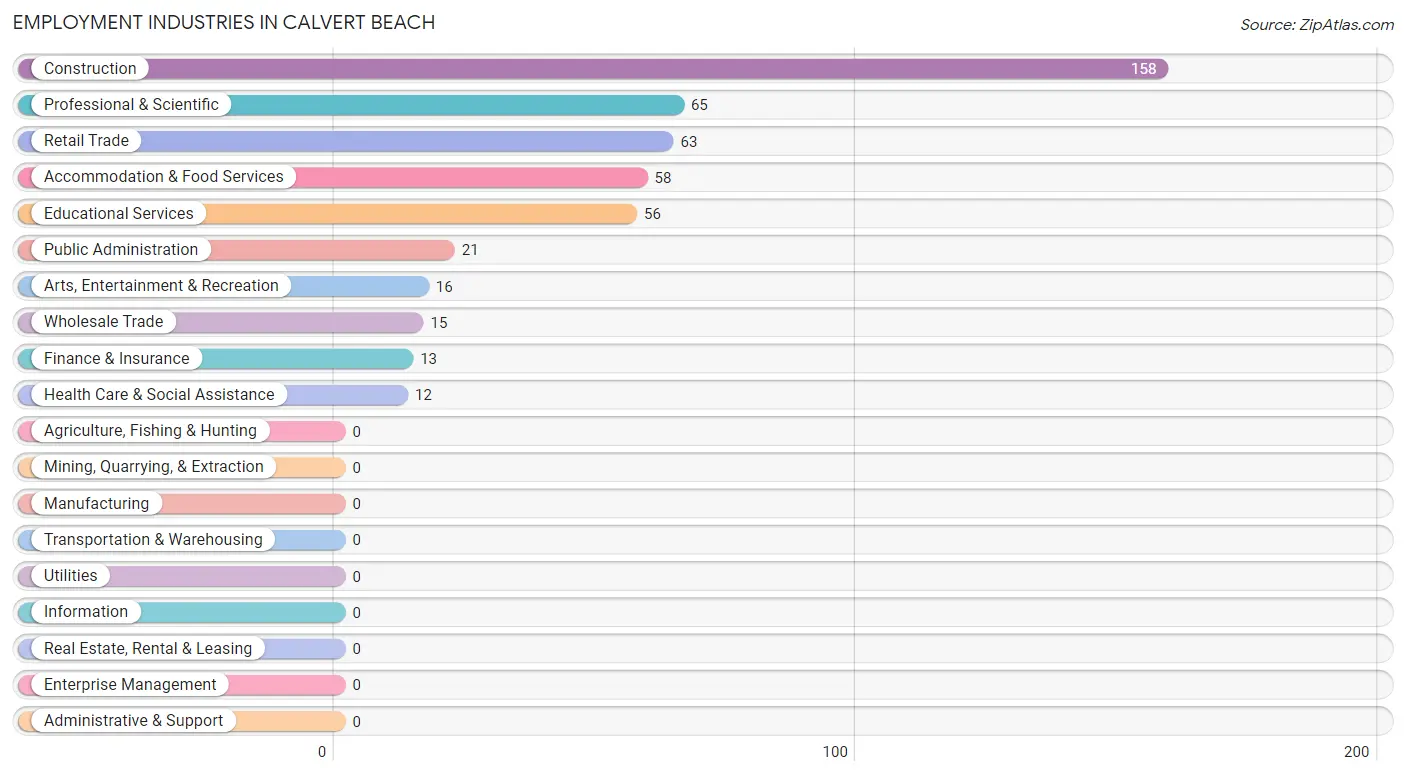
Employment Industries in Calvert Beach
The major employment industries in Calvert Beach include Construction (158 | 33.1%), Professional & Scientific (65 | 13.6%), Retail Trade (63 | 13.2%), Accommodation & Food Services (58 | 12.2%), and Educational Services (56 | 11.7%).
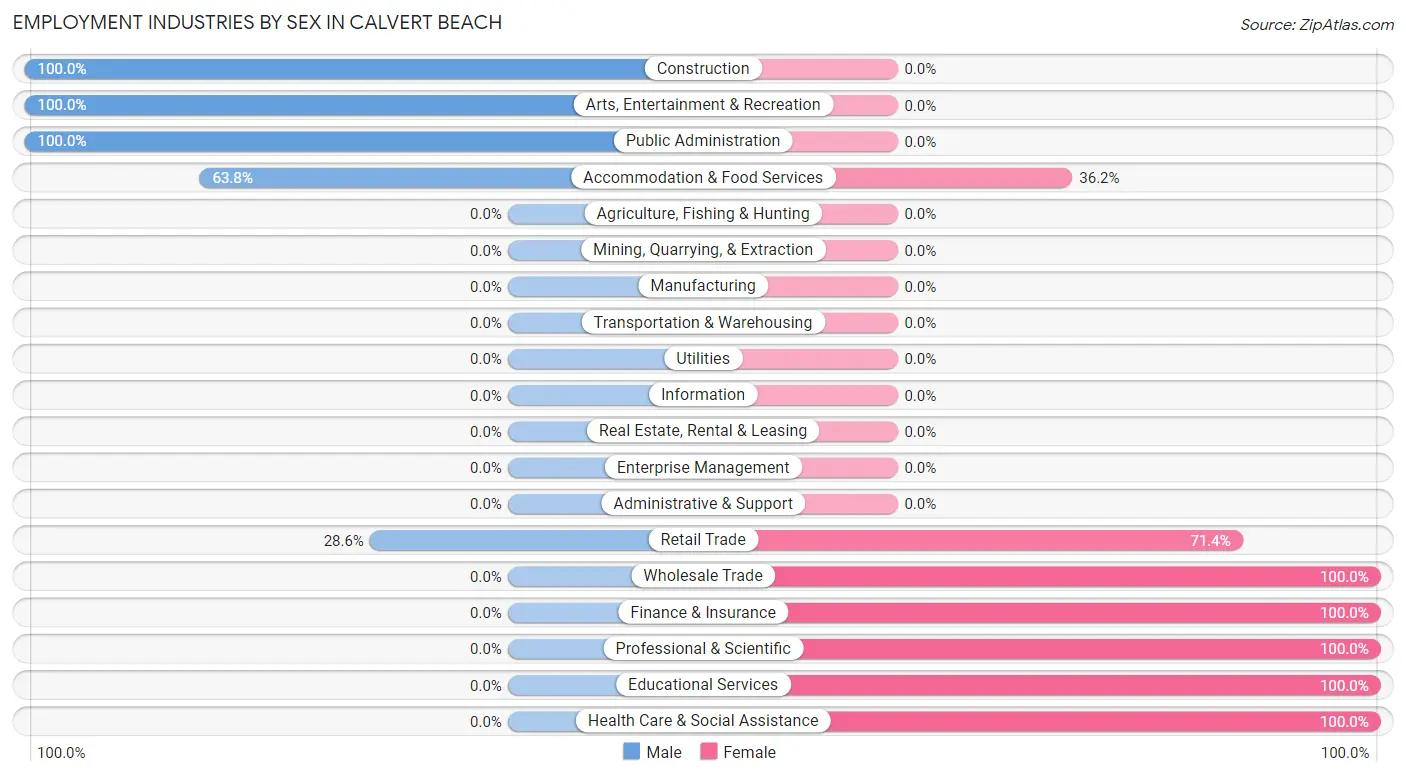
Employment Industries by Sex in Calvert Beach
The Calvert Beach industries that see more men than women are Construction (100.0%), Arts, Entertainment & Recreation (100.0%), and Public Administration (100.0%), whereas the industries that tend to have a higher number of women are Wholesale Trade (100.0%), Finance & Insurance (100.0%), and Professional & Scientific (100.0%).
| Industry | Male | Female |
| Agriculture, Fishing & Hunting | 0 (0.0%) | 0 (0.0%) |
| Mining, Quarrying, & Extraction | 0 (0.0%) | 0 (0.0%) |
| Construction | 158 (100.0%) | 0 (0.0%) |
| Manufacturing | 0 (0.0%) | 0 (0.0%) |
| Wholesale Trade | 0 (0.0%) | 15 (100.0%) |
| Retail Trade | 18 (28.6%) | 45 (71.4%) |
| Transportation & Warehousing | 0 (0.0%) | 0 (0.0%) |
| Utilities | 0 (0.0%) | 0 (0.0%) |
| Information | 0 (0.0%) | 0 (0.0%) |
| Finance & Insurance | 0 (0.0%) | 13 (100.0%) |
| Real Estate, Rental & Leasing | 0 (0.0%) | 0 (0.0%) |
| Professional & Scientific | 0 (0.0%) | 65 (100.0%) |
| Enterprise Management | 0 (0.0%) | 0 (0.0%) |
| Administrative & Support | 0 (0.0%) | 0 (0.0%) |
| Educational Services | 0 (0.0%) | 56 (100.0%) |
| Health Care & Social Assistance | 0 (0.0%) | 12 (100.0%) |
| Arts, Entertainment & Recreation | 16 (100.0%) | 0 (0.0%) |
| Accommodation & Food Services | 37 (63.8%) | 21 (36.2%) |
| Public Administration | 21 (100.0%) | 0 (0.0%) |
| Total | 250 (52.4%) | 227 (47.6%) |
Education in Calvert Beach
School Enrollment in Calvert Beach
The most common levels of schooling among the 326 students in Calvert Beach are elementary school (119 | 36.5%), kindergarten (72 | 22.1%), and high school (61 | 18.7%).
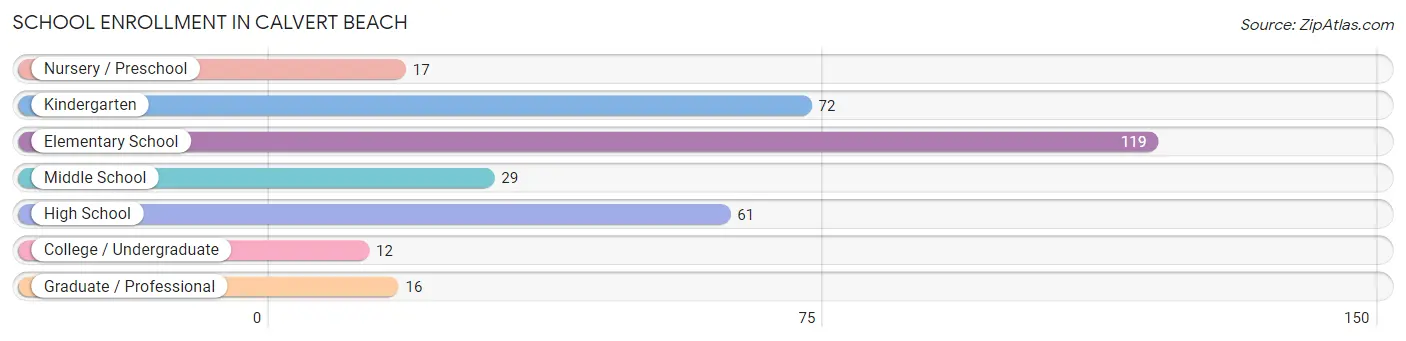
| School Level | # Students | % Students |
| Nursery / Preschool | 17 | 5.2% |
| Kindergarten | 72 | 22.1% |
| Elementary School | 119 | 36.5% |
| Middle School | 29 | 8.9% |
| High School | 61 | 18.7% |
| College / Undergraduate | 12 | 3.7% |
| Graduate / Professional | 16 | 4.9% |
| Total | 326 | 100.0% |
School Enrollment by Age by Funding Source in Calvert Beach
Out of a total of 326 students who are enrolled in schools in Calvert Beach, 37 (11.3%) attend a private institution, while the remaining 289 (88.7%) are enrolled in public schools. The age group of 35 years and over has the highest likelihood of being enrolled in private schools, with 28 (100.0% in the age bracket) enrolled. Conversely, the age group of 3 to 4 year olds has the lowest likelihood of being enrolled in a private school, with 17 (100.0% in the age bracket) attending a public institution.
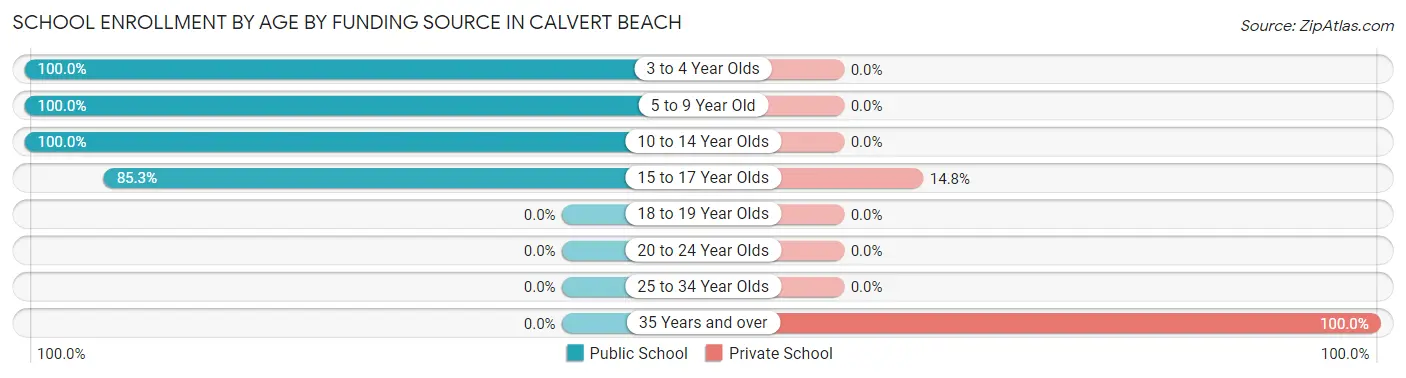
| Age Bracket | Public School | Private School |
| 3 to 4 Year Olds | 17 (100.0%) | 0 (0.0%) |
| 5 to 9 Year Old | 164 (100.0%) | 0 (0.0%) |
| 10 to 14 Year Olds | 56 (100.0%) | 0 (0.0%) |
| 15 to 17 Year Olds | 52 (85.3%) | 9 (14.7%) |
| 18 to 19 Year Olds | 0 (0.0%) | 0 (0.0%) |
| 20 to 24 Year Olds | 0 (0.0%) | 0 (0.0%) |
| 25 to 34 Year Olds | 0 (0.0%) | 0 (0.0%) |
| 35 Years and over | 0 (0.0%) | 28 (100.0%) |
| Total | 289 (88.7%) | 37 (11.3%) |
Educational Attainment by Field of Study in Calvert Beach
Bio, nature & agricultural (16 | 50.0%), and education (16 | 50.0%) are the most common fields of study among 32 individuals in Calvert Beach who have obtained a bachelor's degree or higher.
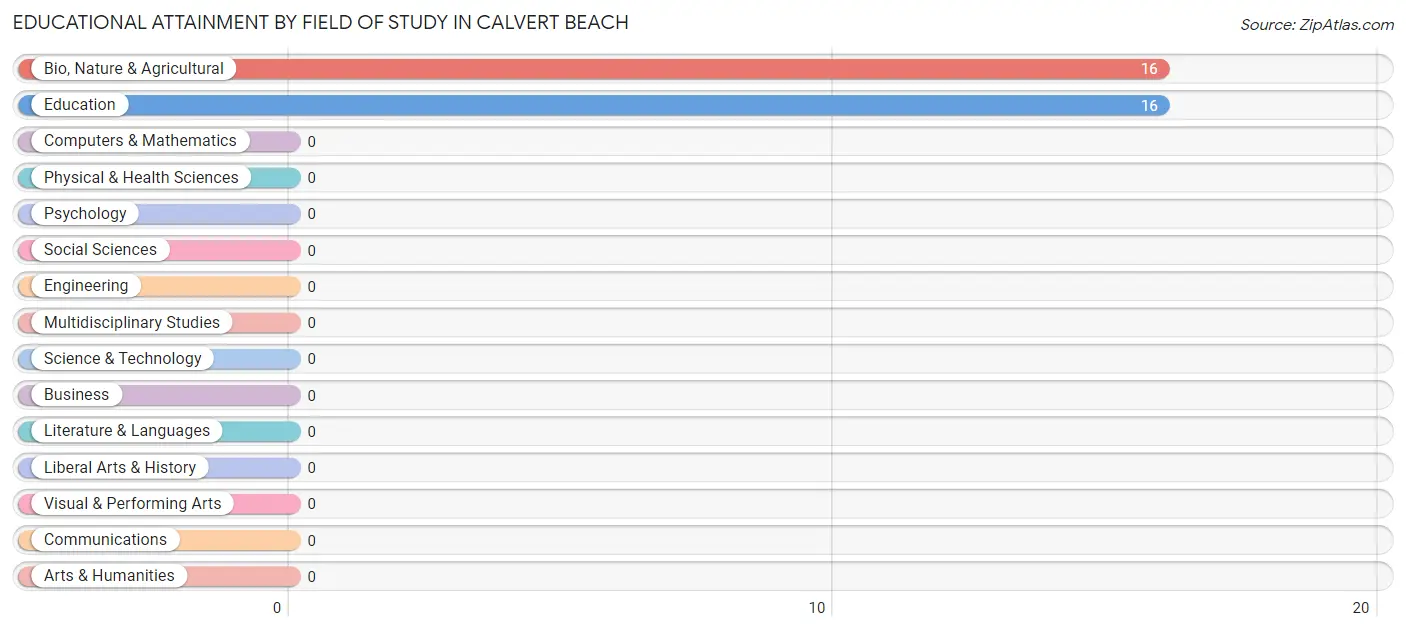
| Field of Study | # Graduates | % Graduates |
| Computers & Mathematics | 0 | 0.0% |
| Bio, Nature & Agricultural | 16 | 50.0% |
| Physical & Health Sciences | 0 | 0.0% |
| Psychology | 0 | 0.0% |
| Social Sciences | 0 | 0.0% |
| Engineering | 0 | 0.0% |
| Multidisciplinary Studies | 0 | 0.0% |
| Science & Technology | 0 | 0.0% |
| Business | 0 | 0.0% |
| Education | 16 | 50.0% |
| Literature & Languages | 0 | 0.0% |
| Liberal Arts & History | 0 | 0.0% |
| Visual & Performing Arts | 0 | 0.0% |
| Communications | 0 | 0.0% |
| Arts & Humanities | 0 | 0.0% |
| Total | 32 | 100.0% |
Transportation & Commute in Calvert Beach
Vehicle Availability by Sex in Calvert Beach
The most prevalent vehicle ownership categories in Calvert Beach are males with 3 vehicles (99, accounting for 37.8%) and females with 3 vehicles (81, making up 43.6%).
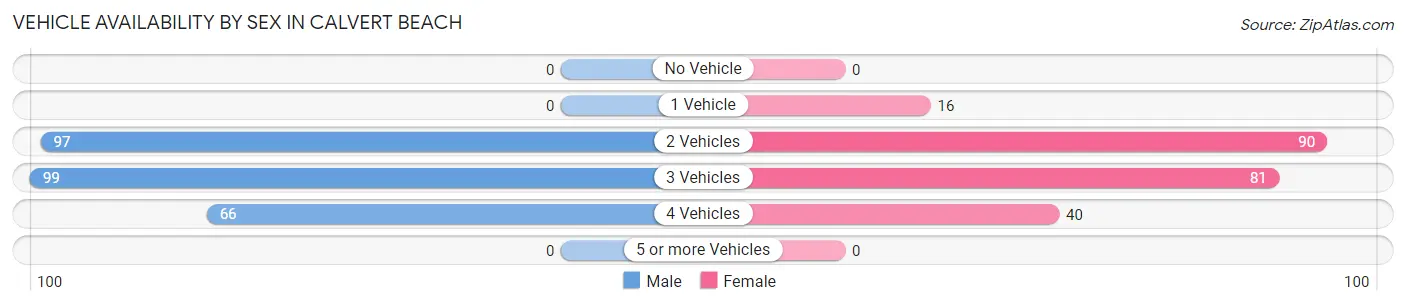
| Vehicles Available | Male | Female |
| No Vehicle | 0 (0.0%) | 0 (0.0%) |
| 1 Vehicle | 0 (0.0%) | 16 (7.0%) |
| 2 Vehicles | 97 (37.0%) | 90 (39.7%) |
| 3 Vehicles | 99 (37.8%) | 81 (35.7%) |
| 4 Vehicles | 66 (25.2%) | 40 (17.6%) |
| 5 or more Vehicles | 0 (0.0%) | 0 (0.0%) |
| Total | 262 (100.0%) | 227 (100.0%) |
Commute Time in Calvert Beach
The most frequently occuring commute durations in Calvert Beach are 60 to 89 minutes (180 commuters, 44.7%), 15 to 19 minutes (76 commuters, 18.9%), and 25 to 29 minutes (53 commuters, 13.2%).
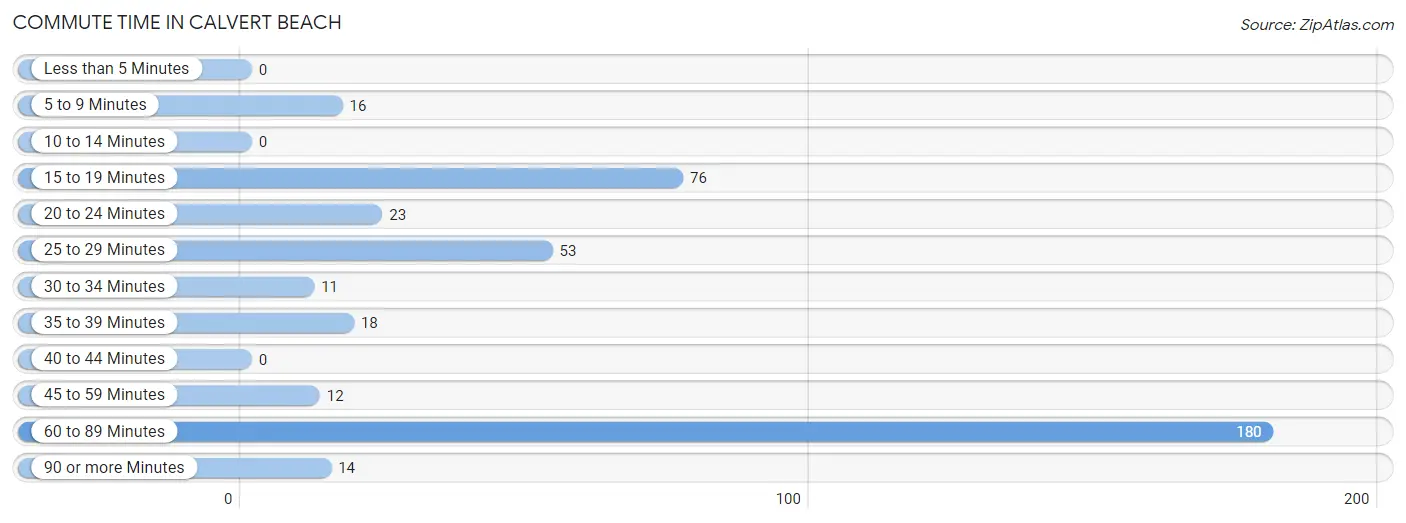
| Commute Time | # Commuters | % Commuters |
| Less than 5 Minutes | 0 | 0.0% |
| 5 to 9 Minutes | 16 | 4.0% |
| 10 to 14 Minutes | 0 | 0.0% |
| 15 to 19 Minutes | 76 | 18.9% |
| 20 to 24 Minutes | 23 | 5.7% |
| 25 to 29 Minutes | 53 | 13.2% |
| 30 to 34 Minutes | 11 | 2.7% |
| 35 to 39 Minutes | 18 | 4.5% |
| 40 to 44 Minutes | 0 | 0.0% |
| 45 to 59 Minutes | 12 | 3.0% |
| 60 to 89 Minutes | 180 | 44.7% |
| 90 or more Minutes | 14 | 3.5% |
Commute Time by Sex in Calvert Beach
The most common commute times in Calvert Beach are 60 to 89 minutes (120 commuters, 49.8%) for males and 60 to 89 minutes (60 commuters, 37.0%) for females.
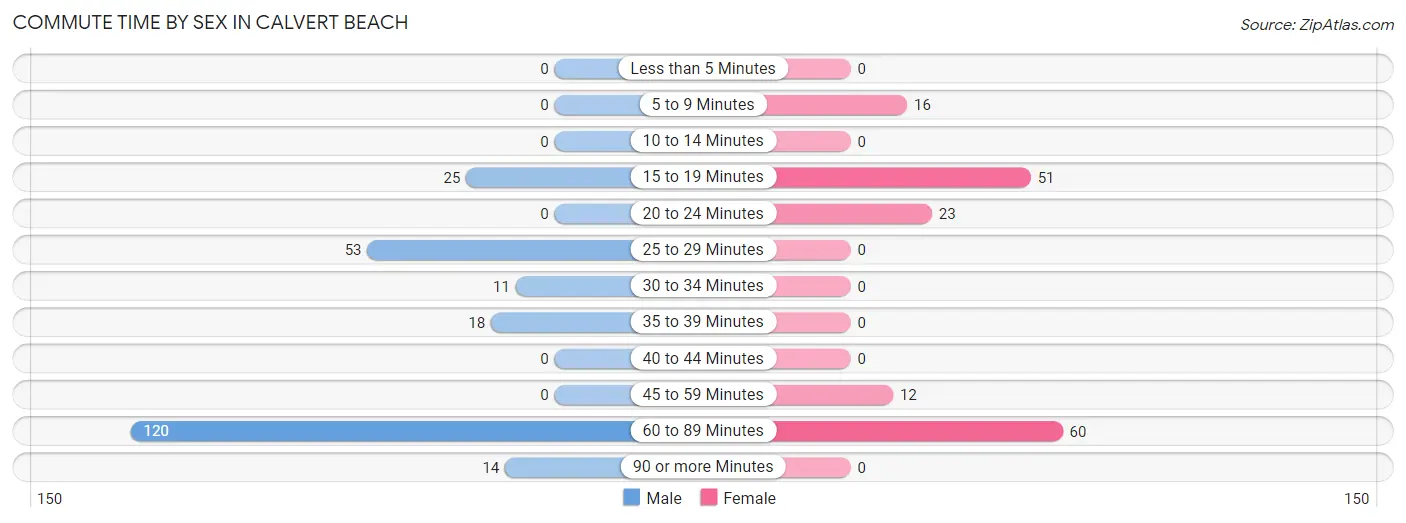
| Commute Time | Male | Female |
| Less than 5 Minutes | 0 (0.0%) | 0 (0.0%) |
| 5 to 9 Minutes | 0 (0.0%) | 16 (9.9%) |
| 10 to 14 Minutes | 0 (0.0%) | 0 (0.0%) |
| 15 to 19 Minutes | 25 (10.4%) | 51 (31.5%) |
| 20 to 24 Minutes | 0 (0.0%) | 23 (14.2%) |
| 25 to 29 Minutes | 53 (22.0%) | 0 (0.0%) |
| 30 to 34 Minutes | 11 (4.6%) | 0 (0.0%) |
| 35 to 39 Minutes | 18 (7.5%) | 0 (0.0%) |
| 40 to 44 Minutes | 0 (0.0%) | 0 (0.0%) |
| 45 to 59 Minutes | 0 (0.0%) | 12 (7.4%) |
| 60 to 89 Minutes | 120 (49.8%) | 60 (37.0%) |
| 90 or more Minutes | 14 (5.8%) | 0 (0.0%) |
Time of Departure to Work by Sex in Calvert Beach
The most frequent times of departure to work in Calvert Beach are 12:00 AM to 4:59 AM (79, 32.8%) for males and 7:00 AM to 7:29 AM (81, 50.0%) for females.
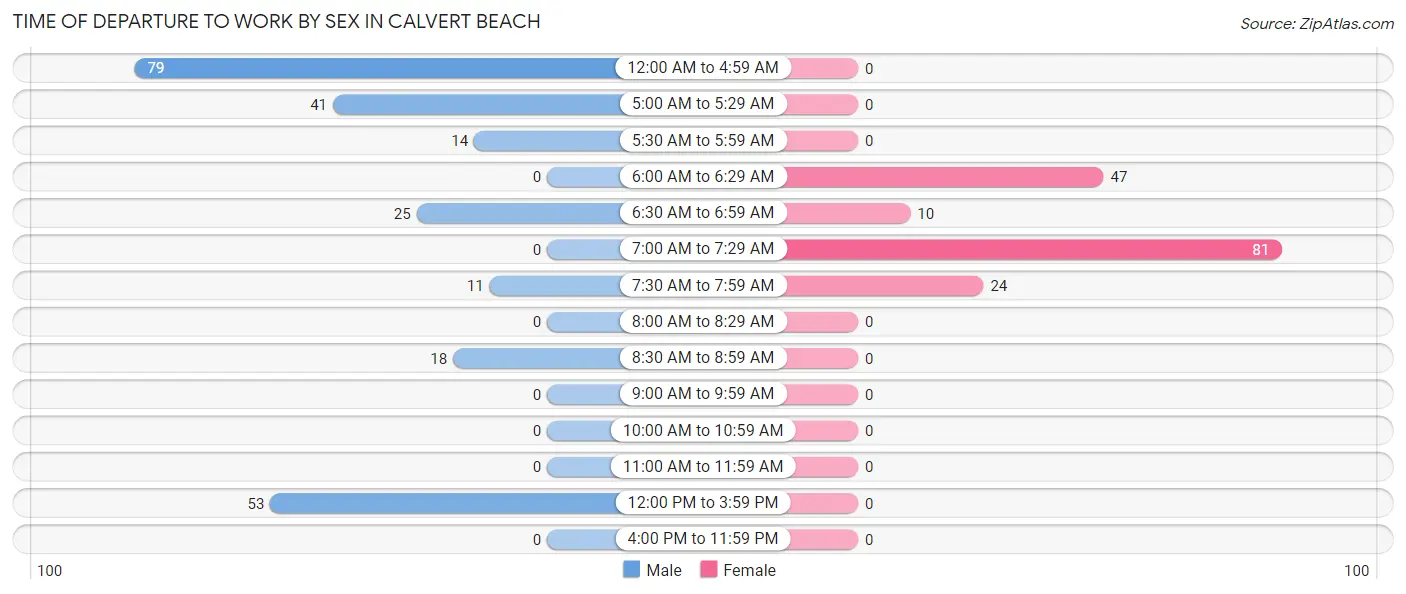
| Time of Departure | Male | Female |
| 12:00 AM to 4:59 AM | 79 (32.8%) | 0 (0.0%) |
| 5:00 AM to 5:29 AM | 41 (17.0%) | 0 (0.0%) |
| 5:30 AM to 5:59 AM | 14 (5.8%) | 0 (0.0%) |
| 6:00 AM to 6:29 AM | 0 (0.0%) | 47 (29.0%) |
| 6:30 AM to 6:59 AM | 25 (10.4%) | 10 (6.2%) |
| 7:00 AM to 7:29 AM | 0 (0.0%) | 81 (50.0%) |
| 7:30 AM to 7:59 AM | 11 (4.6%) | 24 (14.8%) |
| 8:00 AM to 8:29 AM | 0 (0.0%) | 0 (0.0%) |
| 8:30 AM to 8:59 AM | 18 (7.5%) | 0 (0.0%) |
| 9:00 AM to 9:59 AM | 0 (0.0%) | 0 (0.0%) |
| 10:00 AM to 10:59 AM | 0 (0.0%) | 0 (0.0%) |
| 11:00 AM to 11:59 AM | 0 (0.0%) | 0 (0.0%) |
| 12:00 PM to 3:59 PM | 53 (22.0%) | 0 (0.0%) |
| 4:00 PM to 11:59 PM | 0 (0.0%) | 0 (0.0%) |
| Total | 241 (100.0%) | 162 (100.0%) |
Housing Occupancy in Calvert Beach
Occupancy by Ownership in Calvert Beach
Of the total 322 dwellings in Calvert Beach, owner-occupied units account for 296 (91.9%), while renter-occupied units make up 26 (8.1%).
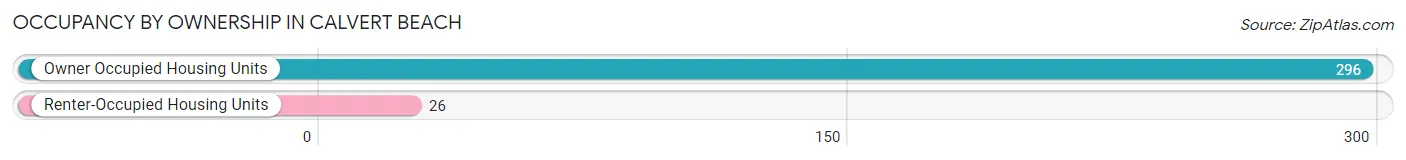
| Occupancy | # Housing Units | % Housing Units |
| Owner Occupied Housing Units | 296 | 91.9% |
| Renter-Occupied Housing Units | 26 | 8.1% |
| Total Occupied Housing Units | 322 | 100.0% |
Occupancy by Household Size in Calvert Beach
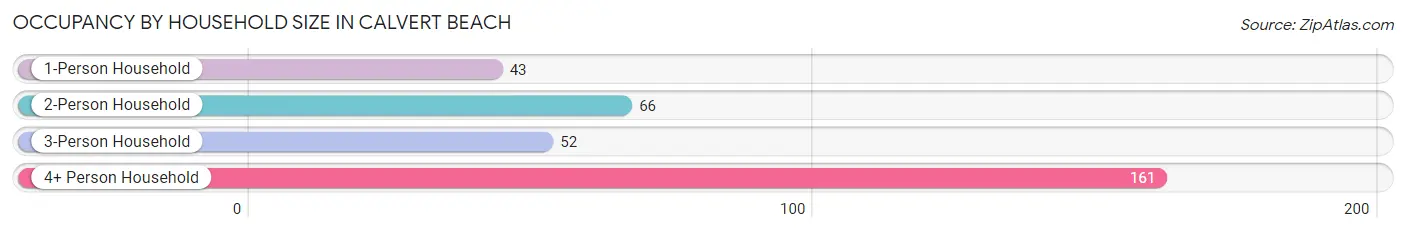
| Household Size | # Housing Units | % Housing Units |
| 1-Person Household | 43 | 13.4% |
| 2-Person Household | 66 | 20.5% |
| 3-Person Household | 52 | 16.2% |
| 4+ Person Household | 161 | 50.0% |
| Total Housing Units | 322 | 100.0% |
Occupancy by Ownership by Household Size in Calvert Beach
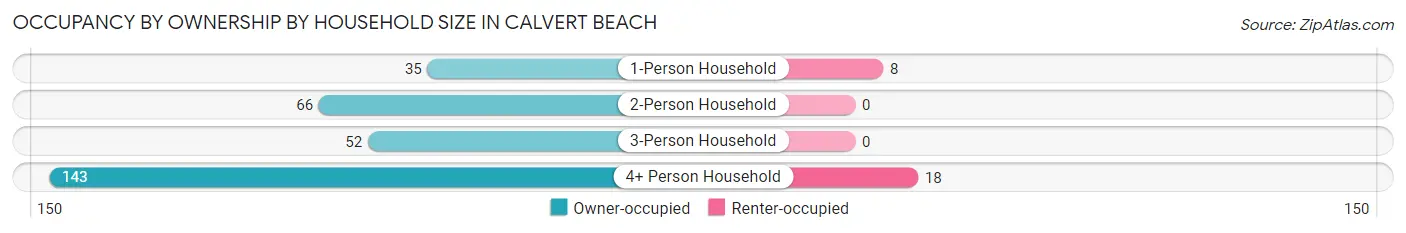
| Household Size | Owner-occupied | Renter-occupied |
| 1-Person Household | 35 (81.4%) | 8 (18.6%) |
| 2-Person Household | 66 (100.0%) | 0 (0.0%) |
| 3-Person Household | 52 (100.0%) | 0 (0.0%) |
| 4+ Person Household | 143 (88.8%) | 18 (11.2%) |
| Total Housing Units | 296 (91.9%) | 26 (8.1%) |
Occupancy by Educational Attainment in Calvert Beach
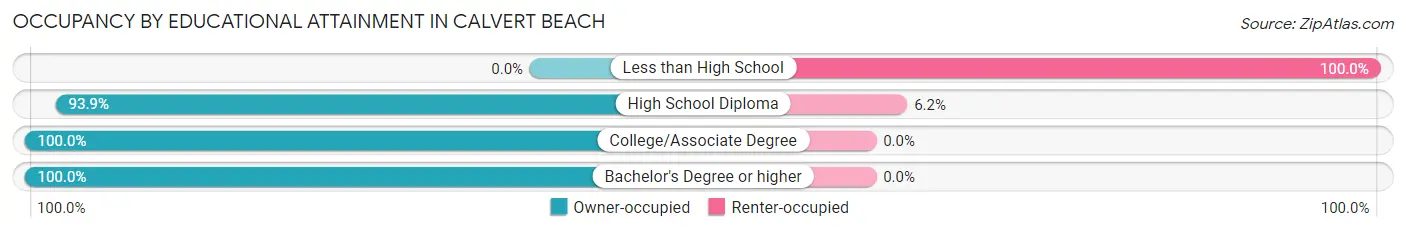
| Household Size | Owner-occupied | Renter-occupied |
| Less than High School | 0 (0.0%) | 18 (100.0%) |
| High School Diploma | 122 (93.9%) | 8 (6.1%) |
| College/Associate Degree | 142 (100.0%) | 0 (0.0%) |
| Bachelor's Degree or higher | 32 (100.0%) | 0 (0.0%) |
Occupancy by Age of Householder in Calvert Beach
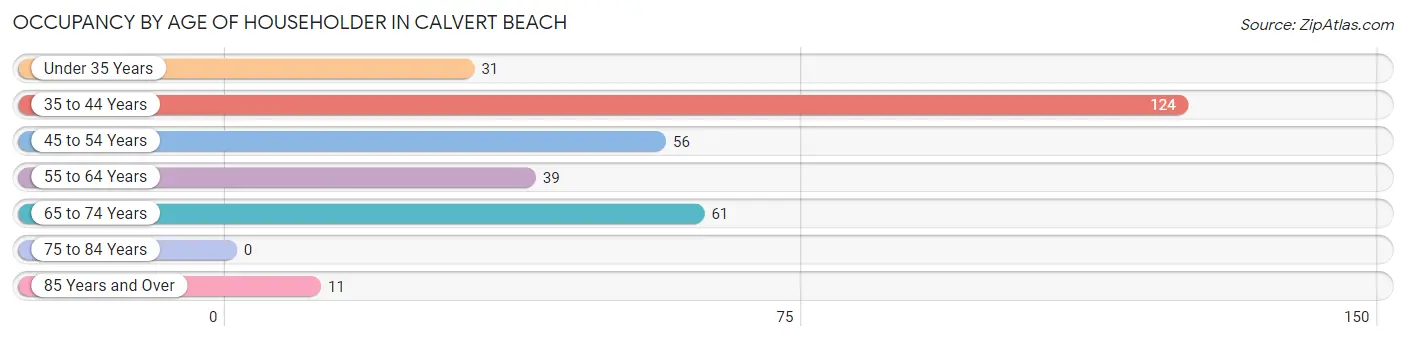
| Age Bracket | # Households | % Households |
| Under 35 Years | 31 | 9.6% |
| 35 to 44 Years | 124 | 38.5% |
| 45 to 54 Years | 56 | 17.4% |
| 55 to 64 Years | 39 | 12.1% |
| 65 to 74 Years | 61 | 18.9% |
| 75 to 84 Years | 0 | 0.0% |
| 85 Years and Over | 11 | 3.4% |
| Total | 322 | 100.0% |
Housing Finances in Calvert Beach
Median Income by Occupancy in Calvert Beach
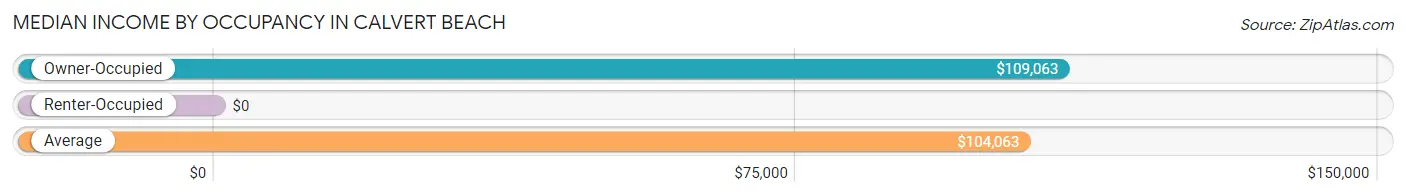
| Occupancy Type | # Households | Median Income |
| Owner-Occupied | 296 (91.9%) | $109,063 |
| Renter-Occupied | 26 (8.1%) | $0 |
| Average | 322 (100.0%) | $104,063 |
Occupancy by Householder Income Bracket in Calvert Beach
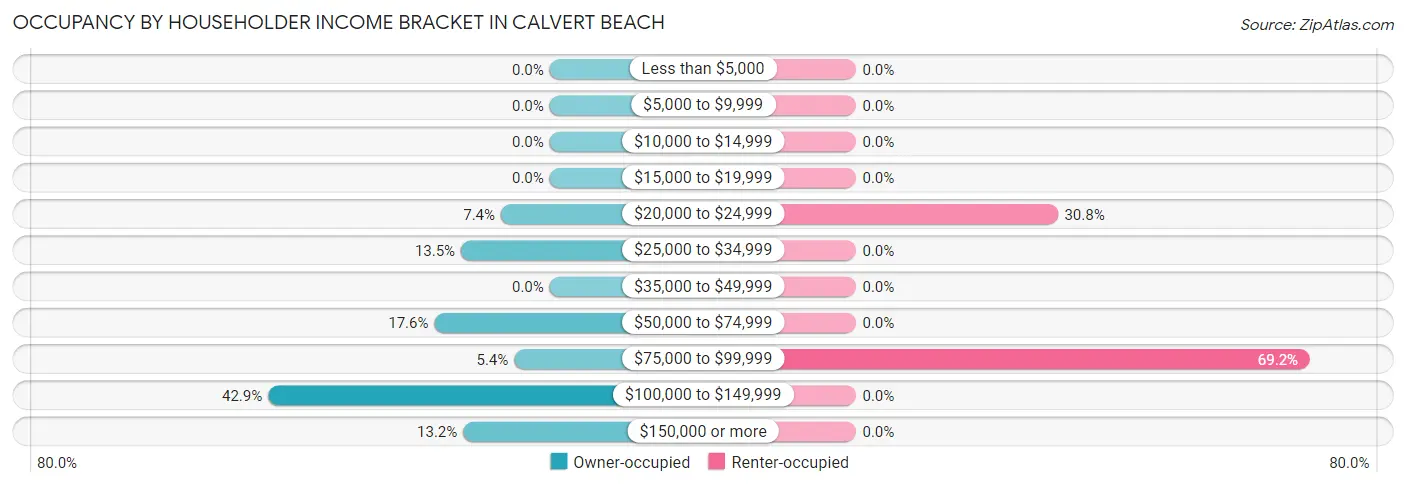
| Income Bracket | Owner-occupied | Renter-occupied |
| Less than $5,000 | 0 (0.0%) | 0 (0.0%) |
| $5,000 to $9,999 | 0 (0.0%) | 0 (0.0%) |
| $10,000 to $14,999 | 0 (0.0%) | 0 (0.0%) |
| $15,000 to $19,999 | 0 (0.0%) | 0 (0.0%) |
| $20,000 to $24,999 | 22 (7.4%) | 8 (30.8%) |
| $25,000 to $34,999 | 40 (13.5%) | 0 (0.0%) |
| $35,000 to $49,999 | 0 (0.0%) | 0 (0.0%) |
| $50,000 to $74,999 | 52 (17.6%) | 0 (0.0%) |
| $75,000 to $99,999 | 16 (5.4%) | 18 (69.2%) |
| $100,000 to $149,999 | 127 (42.9%) | 0 (0.0%) |
| $150,000 or more | 39 (13.2%) | 0 (0.0%) |
| Total | 296 (100.0%) | 26 (100.0%) |
Monthly Housing Cost Tiers in Calvert Beach
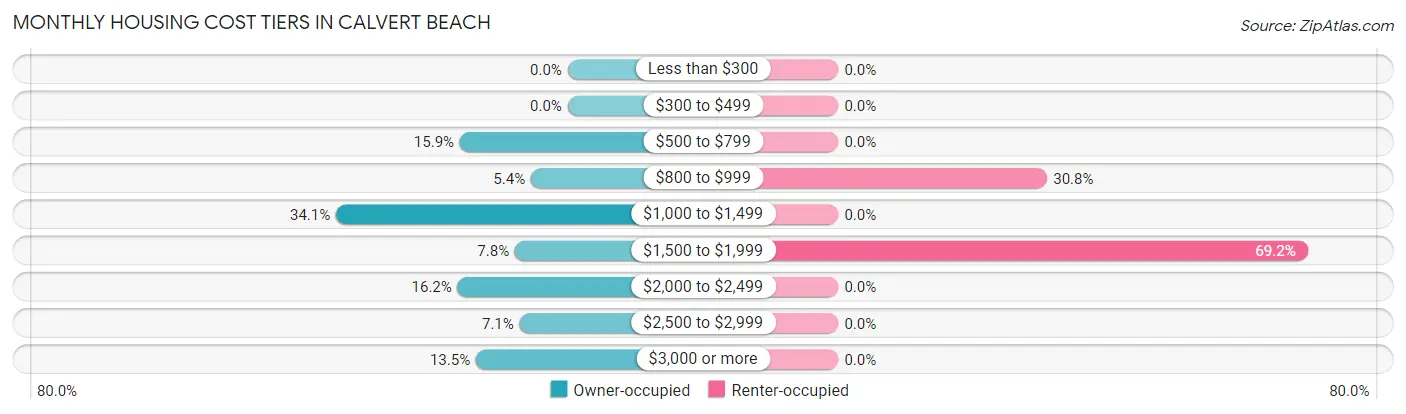
| Monthly Cost | Owner-occupied | Renter-occupied |
| Less than $300 | 0 (0.0%) | 0 (0.0%) |
| $300 to $499 | 0 (0.0%) | 0 (0.0%) |
| $500 to $799 | 47 (15.9%) | 0 (0.0%) |
| $800 to $999 | 16 (5.4%) | 8 (30.8%) |
| $1,000 to $1,499 | 101 (34.1%) | 0 (0.0%) |
| $1,500 to $1,999 | 23 (7.8%) | 18 (69.2%) |
| $2,000 to $2,499 | 48 (16.2%) | 0 (0.0%) |
| $2,500 to $2,999 | 21 (7.1%) | 0 (0.0%) |
| $3,000 or more | 40 (13.5%) | 0 (0.0%) |
| Total | 296 (100.0%) | 26 (100.0%) |
Physical Housing Characteristics in Calvert Beach
Housing Structures in Calvert Beach
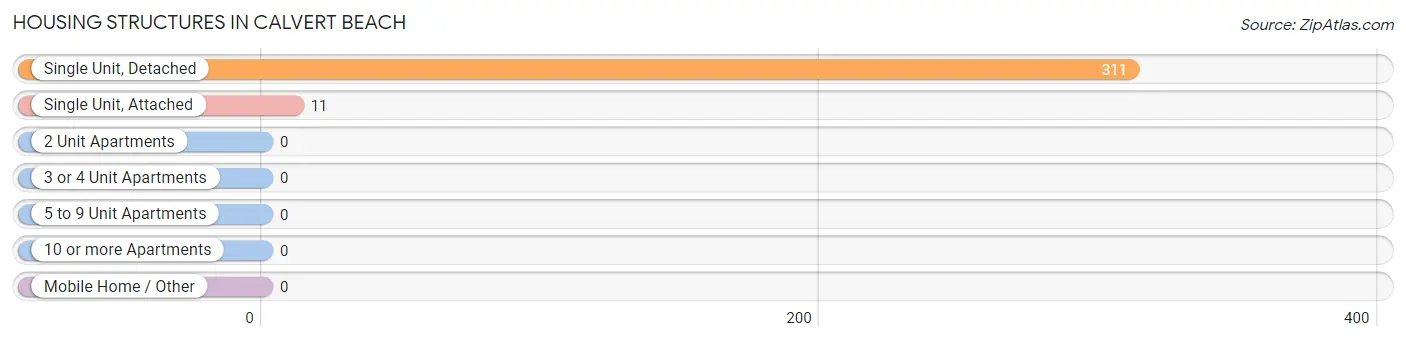
| Structure Type | # Housing Units | % Housing Units |
| Single Unit, Detached | 311 | 96.6% |
| Single Unit, Attached | 11 | 3.4% |
| 2 Unit Apartments | 0 | 0.0% |
| 3 or 4 Unit Apartments | 0 | 0.0% |
| 5 to 9 Unit Apartments | 0 | 0.0% |
| 10 or more Apartments | 0 | 0.0% |
| Mobile Home / Other | 0 | 0.0% |
| Total | 322 | 100.0% |
Housing Structures by Occupancy in Calvert Beach
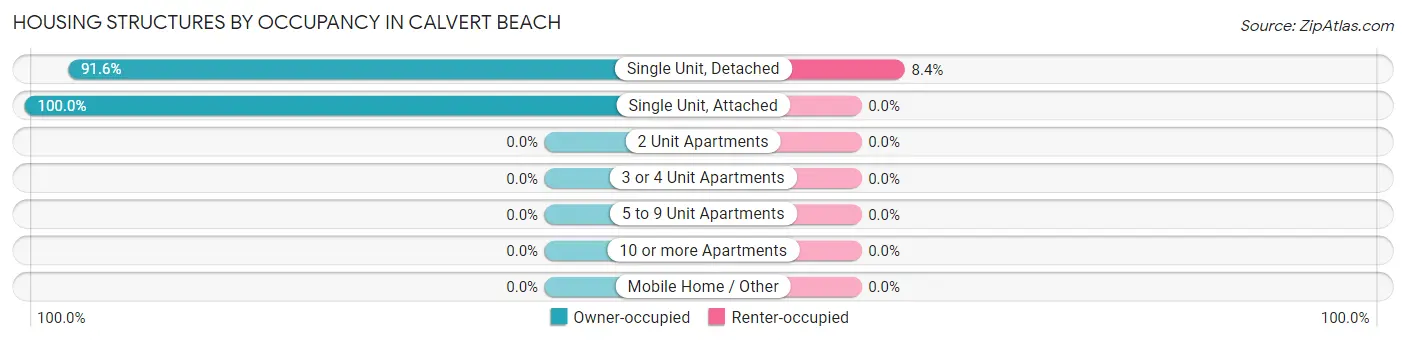
| Structure Type | Owner-occupied | Renter-occupied |
| Single Unit, Detached | 285 (91.6%) | 26 (8.4%) |
| Single Unit, Attached | 11 (100.0%) | 0 (0.0%) |
| 2 Unit Apartments | 0 (0.0%) | 0 (0.0%) |
| 3 or 4 Unit Apartments | 0 (0.0%) | 0 (0.0%) |
| 5 to 9 Unit Apartments | 0 (0.0%) | 0 (0.0%) |
| 10 or more Apartments | 0 (0.0%) | 0 (0.0%) |
| Mobile Home / Other | 0 (0.0%) | 0 (0.0%) |
| Total | 296 (91.9%) | 26 (8.1%) |
Housing Structures by Number of Rooms in Calvert Beach
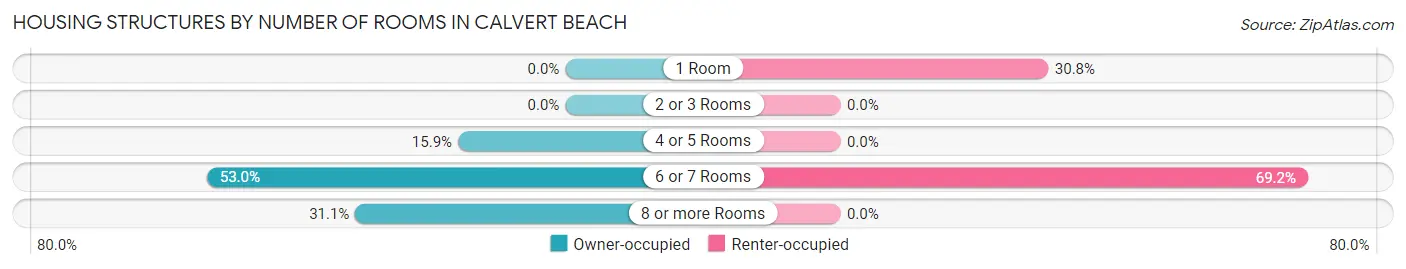
| Number of Rooms | Owner-occupied | Renter-occupied |
| 1 Room | 0 (0.0%) | 8 (30.8%) |
| 2 or 3 Rooms | 0 (0.0%) | 0 (0.0%) |
| 4 or 5 Rooms | 47 (15.9%) | 0 (0.0%) |
| 6 or 7 Rooms | 157 (53.0%) | 18 (69.2%) |
| 8 or more Rooms | 92 (31.1%) | 0 (0.0%) |
| Total | 296 (100.0%) | 26 (100.0%) |
Housing Structure by Heating Type in Calvert Beach
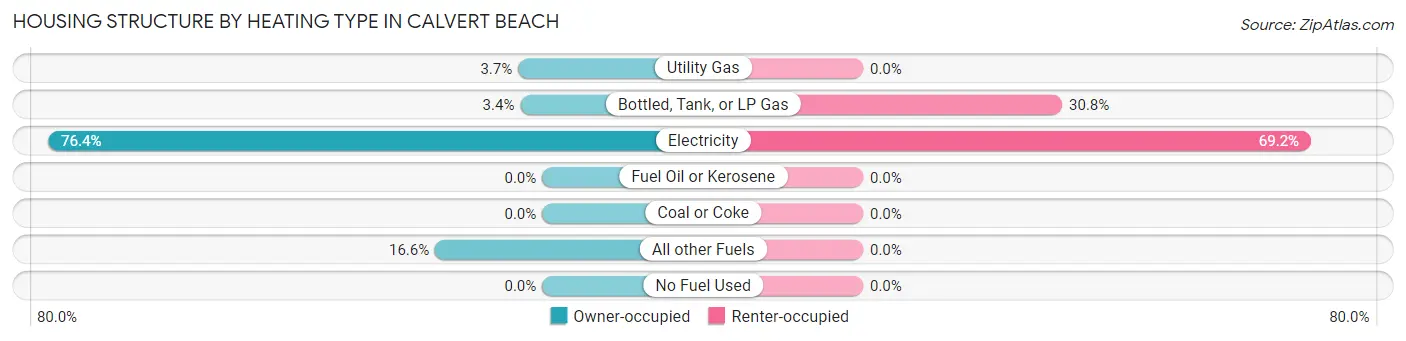
| Heating Type | Owner-occupied | Renter-occupied |
| Utility Gas | 11 (3.7%) | 0 (0.0%) |
| Bottled, Tank, or LP Gas | 10 (3.4%) | 8 (30.8%) |
| Electricity | 226 (76.3%) | 18 (69.2%) |
| Fuel Oil or Kerosene | 0 (0.0%) | 0 (0.0%) |
| Coal or Coke | 0 (0.0%) | 0 (0.0%) |
| All other Fuels | 49 (16.6%) | 0 (0.0%) |
| No Fuel Used | 0 (0.0%) | 0 (0.0%) |
| Total | 296 (100.0%) | 26 (100.0%) |
Household Vehicle Usage in Calvert Beach
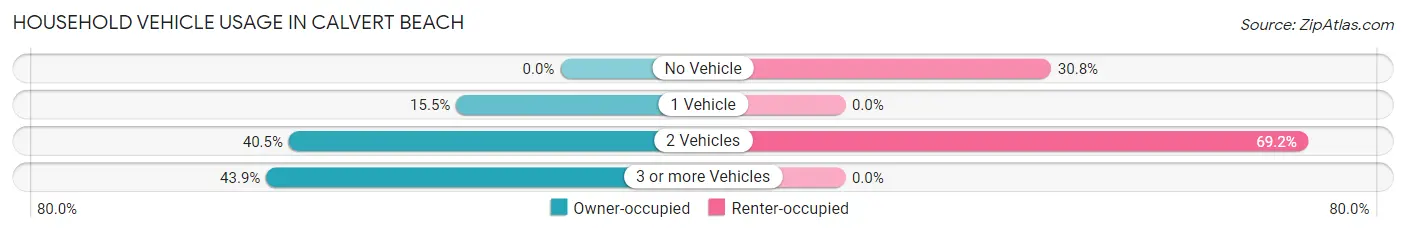
| Vehicles per Household | Owner-occupied | Renter-occupied |
| No Vehicle | 0 (0.0%) | 8 (30.8%) |
| 1 Vehicle | 46 (15.5%) | 0 (0.0%) |
| 2 Vehicles | 120 (40.5%) | 18 (69.2%) |
| 3 or more Vehicles | 130 (43.9%) | 0 (0.0%) |
| Total | 296 (100.0%) | 26 (100.0%) |
Real Estate & Mortgages in Calvert Beach
Real Estate and Mortgage Overview in Calvert Beach
| Characteristic | Without Mortgage | With Mortgage |
| Housing Units | 19 | 277 |
| Median Property Value | - | - |
| Median Household Income | - | - |
| Monthly Housing Costs | - | - |
| Real Estate Taxes | - | - |
Property Value by Mortgage Status in Calvert Beach
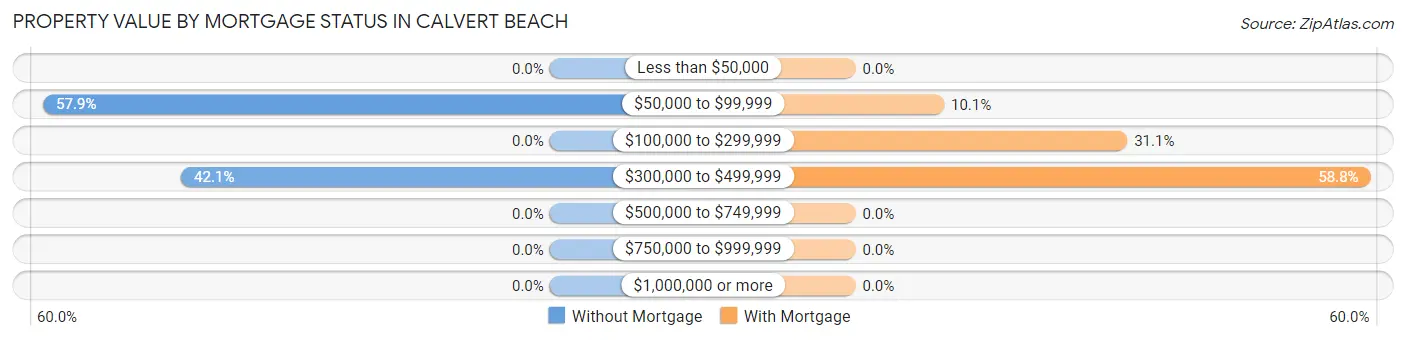
| Property Value | Without Mortgage | With Mortgage |
| Less than $50,000 | 0 (0.0%) | 0 (0.0%) |
| $50,000 to $99,999 | 11 (57.9%) | 28 (10.1%) |
| $100,000 to $299,999 | 0 (0.0%) | 86 (31.0%) |
| $300,000 to $499,999 | 8 (42.1%) | 163 (58.8%) |
| $500,000 to $749,999 | 0 (0.0%) | 0 (0.0%) |
| $750,000 to $999,999 | 0 (0.0%) | 0 (0.0%) |
| $1,000,000 or more | 0 (0.0%) | 0 (0.0%) |
| Total | 19 (100.0%) | 277 (100.0%) |
Household Income by Mortgage Status in Calvert Beach
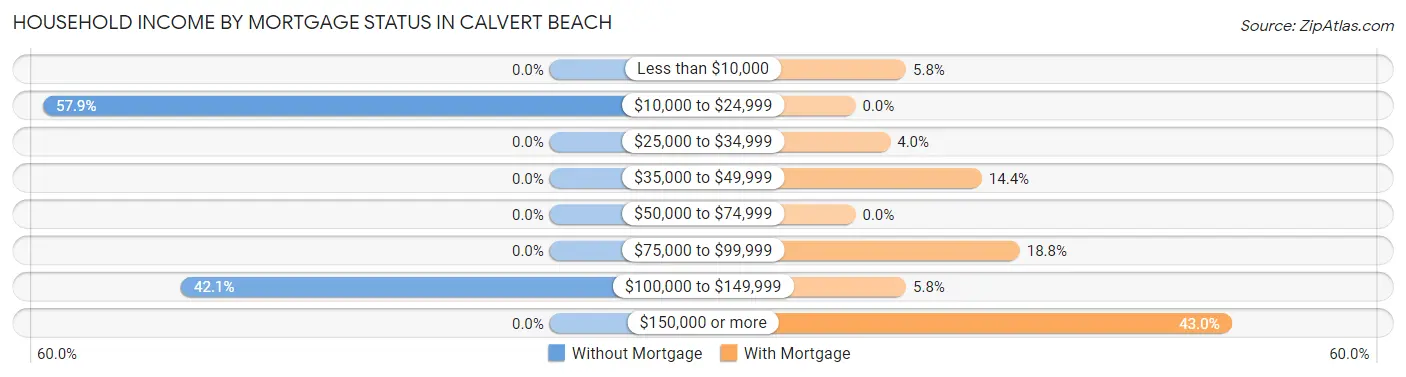
| Household Income | Without Mortgage | With Mortgage |
| Less than $10,000 | 0 (0.0%) | 16 (5.8%) |
| $10,000 to $24,999 | 11 (57.9%) | 0 (0.0%) |
| $25,000 to $34,999 | 0 (0.0%) | 11 (4.0%) |
| $35,000 to $49,999 | 0 (0.0%) | 40 (14.4%) |
| $50,000 to $74,999 | 0 (0.0%) | 0 (0.0%) |
| $75,000 to $99,999 | 0 (0.0%) | 52 (18.8%) |
| $100,000 to $149,999 | 8 (42.1%) | 16 (5.8%) |
| $150,000 or more | 0 (0.0%) | 119 (43.0%) |
| Total | 19 (100.0%) | 277 (100.0%) |
Property Value to Household Income Ratio in Calvert Beach
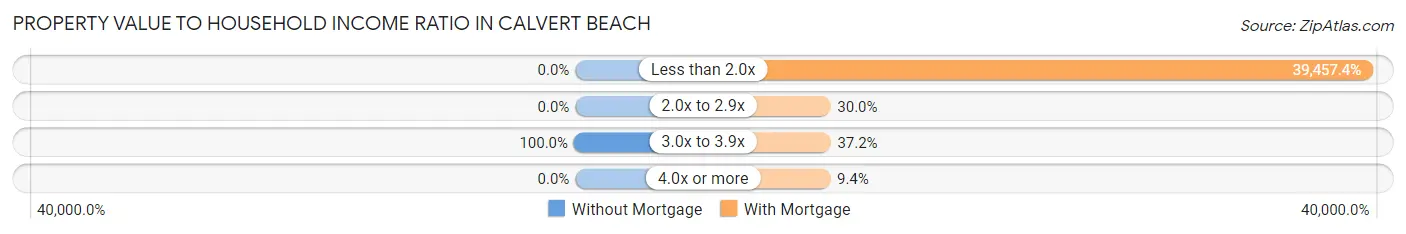
| Value-to-Income Ratio | Without Mortgage | With Mortgage |
| Less than 2.0x | 0 (0.0%) | 109,297 (39,457.4%) |
| 2.0x to 2.9x | 0 (0.0%) | 83 (30.0%) |
| 3.0x to 3.9x | 19 (100.0%) | 103 (37.2%) |
| 4.0x or more | 0 (0.0%) | 26 (9.4%) |
| Total | 19 (100.0%) | 277 (100.0%) |
Real Estate Taxes by Mortgage Status in Calvert Beach
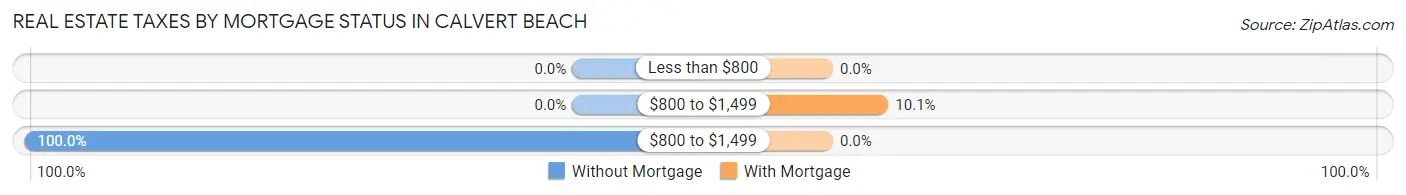
| Property Taxes | Without Mortgage | With Mortgage |
| Less than $800 | 0 (0.0%) | 0 (0.0%) |
| $800 to $1,499 | 0 (0.0%) | 28 (10.1%) |
| $800 to $1,499 | 19 (100.0%) | 0 (0.0%) |
| Total | 19 (100.0%) | 277 (100.0%) |
Health & Disability in Calvert Beach
Health Insurance Coverage by Age in Calvert Beach
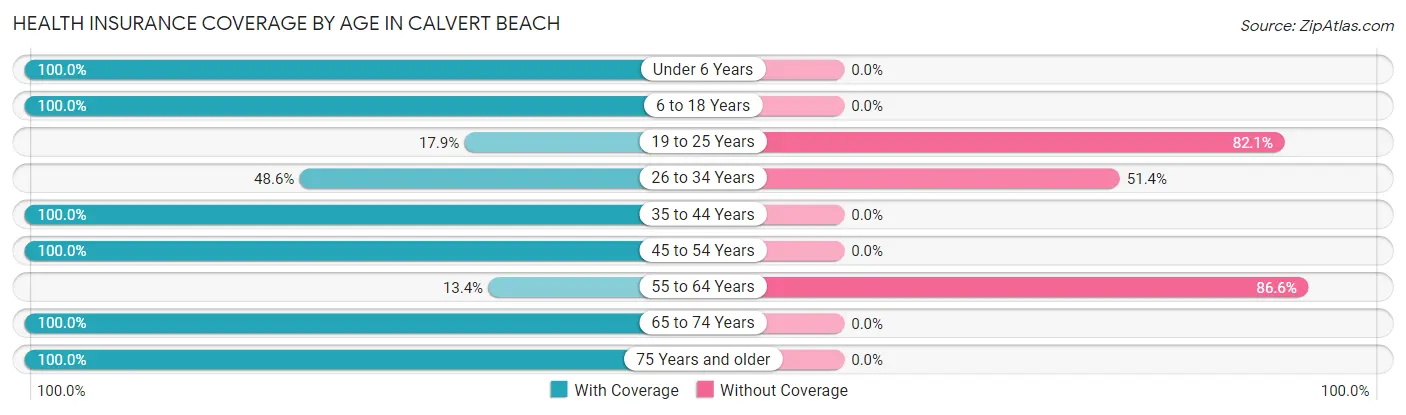
| Age Bracket | With Coverage | Without Coverage |
| Under 6 Years | 43 (100.0%) | 0 (0.0%) |
| 6 to 18 Years | 302 (100.0%) | 0 (0.0%) |
| 19 to 25 Years | 10 (17.9%) | 46 (82.1%) |
| 26 to 34 Years | 35 (48.6%) | 37 (51.4%) |
| 35 to 44 Years | 216 (100.0%) | 0 (0.0%) |
| 45 to 54 Years | 145 (100.0%) | 0 (0.0%) |
| 55 to 64 Years | 11 (13.4%) | 71 (86.6%) |
| 65 to 74 Years | 87 (100.0%) | 0 (0.0%) |
| 75 Years and older | 11 (100.0%) | 0 (0.0%) |
| Total | 860 (84.8%) | 154 (15.2%) |
Health Insurance Coverage by Citizenship Status in Calvert Beach
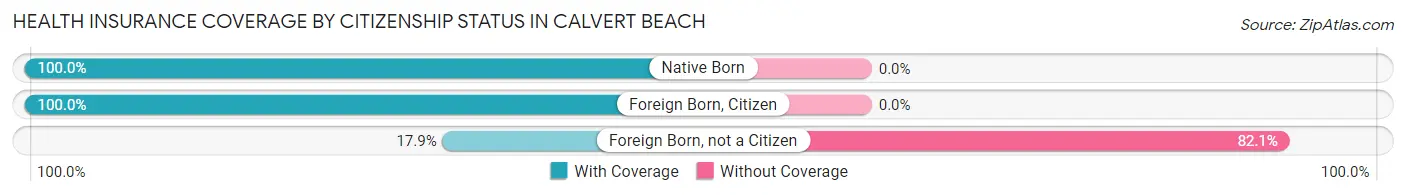
| Citizenship Status | With Coverage | Without Coverage |
| Native Born | 43 (100.0%) | 0 (0.0%) |
| Foreign Born, Citizen | 302 (100.0%) | 0 (0.0%) |
| Foreign Born, not a Citizen | 10 (17.9%) | 46 (82.1%) |
Health Insurance Coverage by Household Income in Calvert Beach
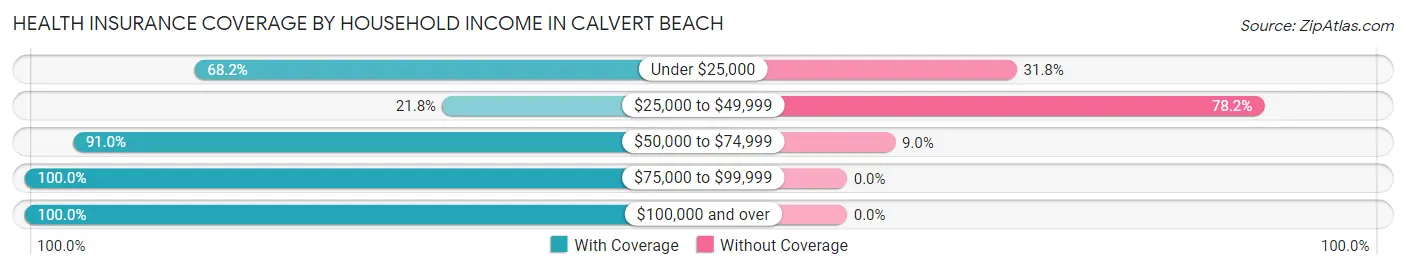
| Household Income | With Coverage | Without Coverage |
| Under $25,000 | 30 (68.2%) | 14 (31.8%) |
| $25,000 to $49,999 | 36 (21.8%) | 129 (78.2%) |
| $50,000 to $74,999 | 111 (91.0%) | 11 (9.0%) |
| $75,000 to $99,999 | 130 (100.0%) | 0 (0.0%) |
| $100,000 and over | 553 (100.0%) | 0 (0.0%) |
Public vs Private Health Insurance Coverage by Age in Calvert Beach
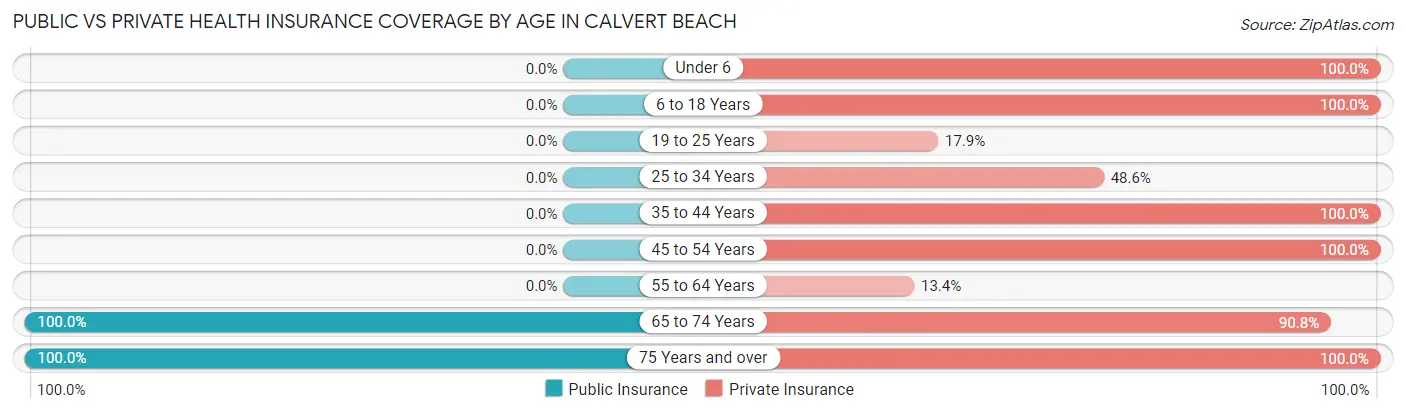
| Age Bracket | Public Insurance | Private Insurance |
| Under 6 | 0 (0.0%) | 43 (100.0%) |
| 6 to 18 Years | 0 (0.0%) | 302 (100.0%) |
| 19 to 25 Years | 0 (0.0%) | 10 (17.9%) |
| 25 to 34 Years | 0 (0.0%) | 35 (48.6%) |
| 35 to 44 Years | 0 (0.0%) | 216 (100.0%) |
| 45 to 54 Years | 0 (0.0%) | 145 (100.0%) |
| 55 to 64 Years | 0 (0.0%) | 11 (13.4%) |
| 65 to 74 Years | 87 (100.0%) | 79 (90.8%) |
| 75 Years and over | 11 (100.0%) | 11 (100.0%) |
| Total | 98 (9.7%) | 852 (84.0%) |
Disability Status by Sex by Age in Calvert Beach
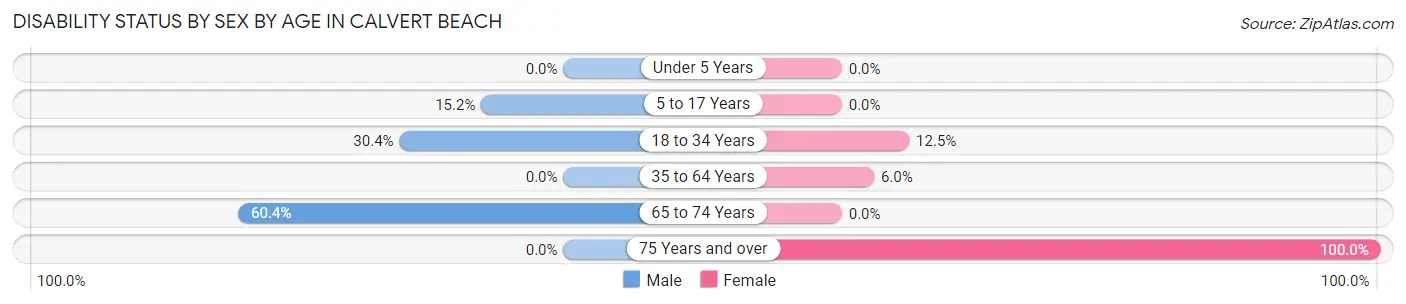
| Age Bracket | Male | Female |
| Under 5 Years | 0 (0.0%) | 0 (0.0%) |
| 5 to 17 Years | 16 (15.2%) | 0 (0.0%) |
| 18 to 34 Years | 21 (30.4%) | 10 (12.5%) |
| 35 to 64 Years | 0 (0.0%) | 12 (6.0%) |
| 65 to 74 Years | 32 (60.4%) | 0 (0.0%) |
| 75 Years and over | 0 (0.0%) | 11 (100.0%) |
Disability Class by Sex by Age in Calvert Beach
Disability Class: Hearing Difficulty
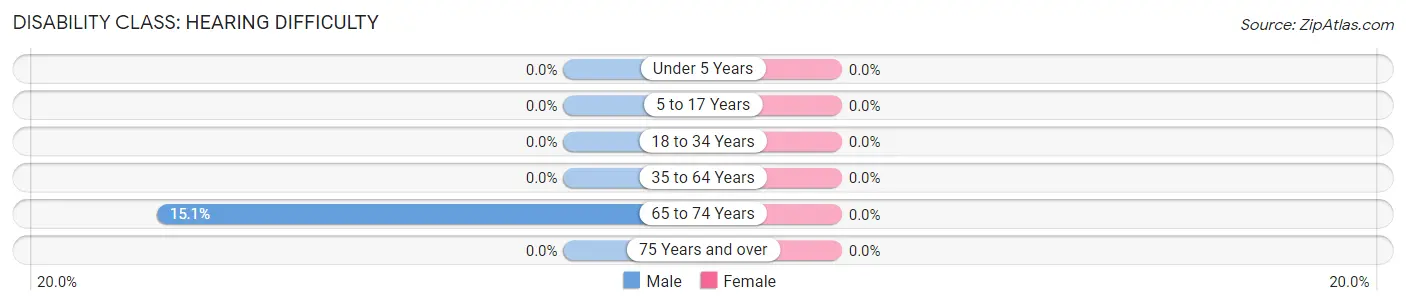
| Age Bracket | Male | Female |
| Under 5 Years | 0 (0.0%) | 0 (0.0%) |
| 5 to 17 Years | 0 (0.0%) | 0 (0.0%) |
| 18 to 34 Years | 0 (0.0%) | 0 (0.0%) |
| 35 to 64 Years | 0 (0.0%) | 0 (0.0%) |
| 65 to 74 Years | 8 (15.1%) | 0 (0.0%) |
| 75 Years and over | 0 (0.0%) | 0 (0.0%) |
Disability Class: Vision Difficulty
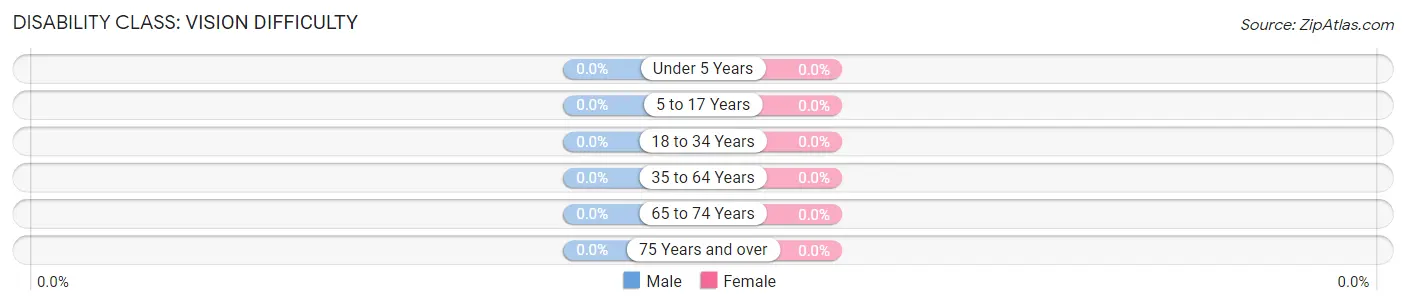
| Age Bracket | Male | Female |
| Under 5 Years | 0 (0.0%) | 0 (0.0%) |
| 5 to 17 Years | 0 (0.0%) | 0 (0.0%) |
| 18 to 34 Years | 0 (0.0%) | 0 (0.0%) |
| 35 to 64 Years | 0 (0.0%) | 0 (0.0%) |
| 65 to 74 Years | 0 (0.0%) | 0 (0.0%) |
| 75 Years and over | 0 (0.0%) | 0 (0.0%) |
Disability Class: Cognitive Difficulty
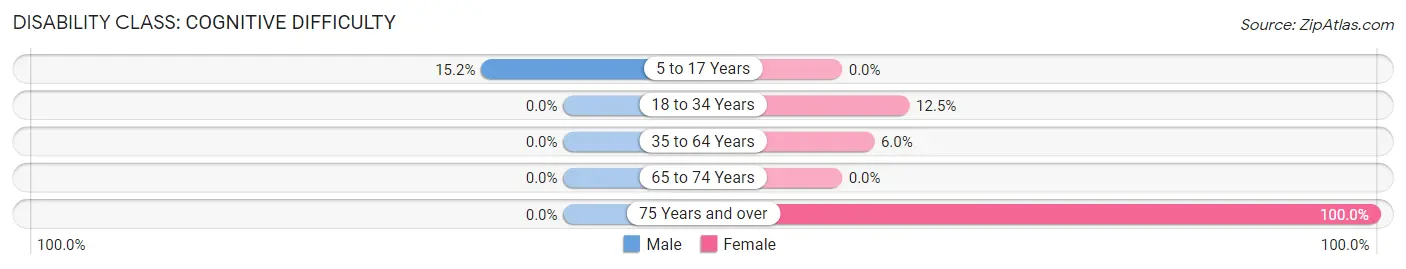
| Age Bracket | Male | Female |
| 5 to 17 Years | 16 (15.2%) | 0 (0.0%) |
| 18 to 34 Years | 0 (0.0%) | 10 (12.5%) |
| 35 to 64 Years | 0 (0.0%) | 12 (6.0%) |
| 65 to 74 Years | 0 (0.0%) | 0 (0.0%) |
| 75 Years and over | 0 (0.0%) | 11 (100.0%) |
Disability Class: Ambulatory Difficulty
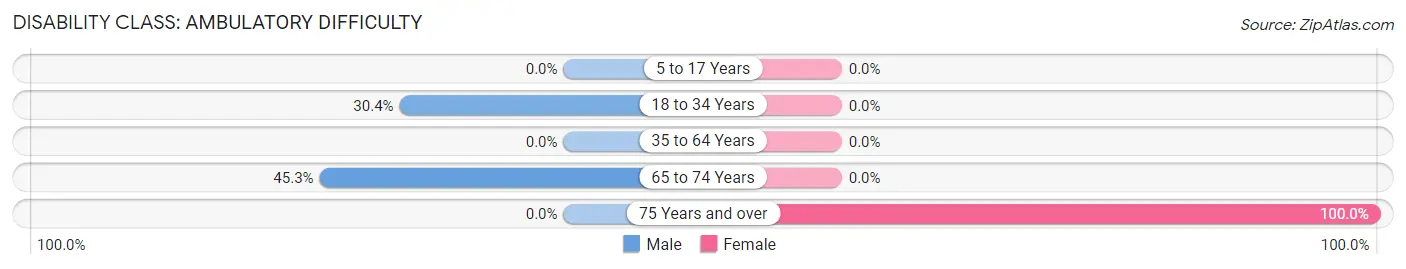
| Age Bracket | Male | Female |
| 5 to 17 Years | 0 (0.0%) | 0 (0.0%) |
| 18 to 34 Years | 21 (30.4%) | 0 (0.0%) |
| 35 to 64 Years | 0 (0.0%) | 0 (0.0%) |
| 65 to 74 Years | 24 (45.3%) | 0 (0.0%) |
| 75 Years and over | 0 (0.0%) | 11 (100.0%) |
Disability Class: Self-Care Difficulty
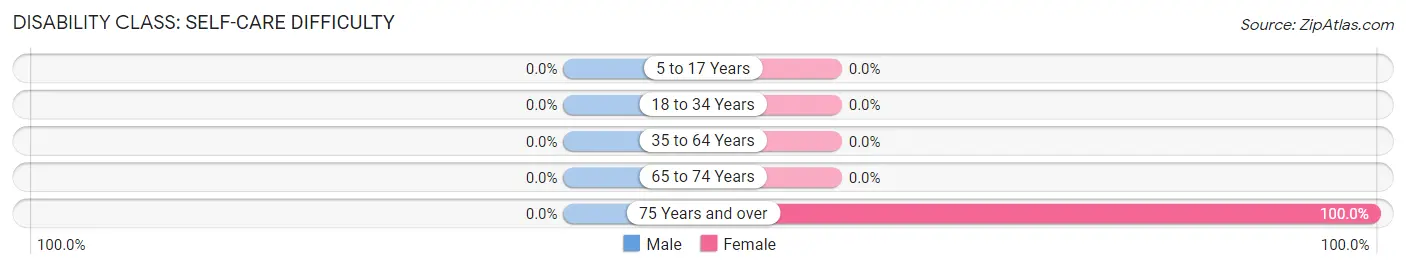
| Age Bracket | Male | Female |
| 5 to 17 Years | 0 (0.0%) | 0 (0.0%) |
| 18 to 34 Years | 0 (0.0%) | 0 (0.0%) |
| 35 to 64 Years | 0 (0.0%) | 0 (0.0%) |
| 65 to 74 Years | 0 (0.0%) | 0 (0.0%) |
| 75 Years and over | 0 (0.0%) | 11 (100.0%) |
Technology Access in Calvert Beach
Computing Device Access in Calvert Beach
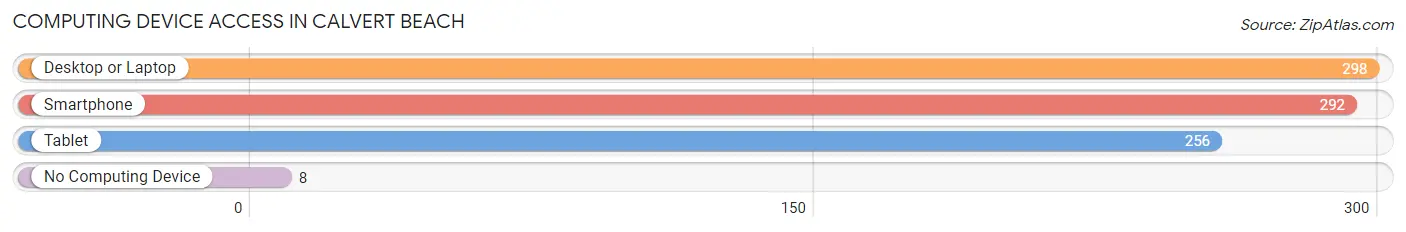
| Device Type | # Households | % Households |
| Desktop or Laptop | 298 | 92.5% |
| Smartphone | 292 | 90.7% |
| Tablet | 256 | 79.5% |
| No Computing Device | 8 | 2.5% |
| Total | 322 | 100.0% |
Internet Access in Calvert Beach
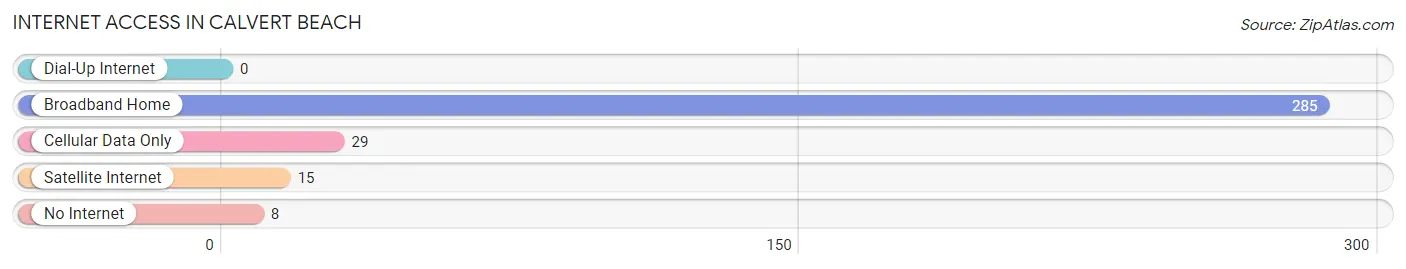
| Internet Type | # Households | % Households |
| Dial-Up Internet | 0 | 0.0% |
| Broadband Home | 285 | 88.5% |
| Cellular Data Only | 29 | 9.0% |
| Satellite Internet | 15 | 4.7% |
| No Internet | 8 | 2.5% |
| Total | 322 | 100.0% |
Calvert Beach Summary
Calvert Beach is a small unincorporated community located in Calvert County, Maryland. It is situated on the Chesapeake Bay, just south of the Patuxent River. The community is bordered by the towns of Chesapeake Beach and North Beach. The population of Calvert Beach was estimated to be 1,845 in 2019.
History
Calvert Beach was originally part of a larger tract of land known as “The Neck of Land” that was granted to Thomas Cornwallis in 1658. The land was later divided among his heirs and eventually sold to the Calvert family in 1720. The Calvert family owned the land until the early 1900s when it was sold to developers.
The area was developed as a resort community in the 1920s and 1930s. The community was named after the Calvert family and was originally known as “Calvert Beach”. The area was popular with vacationers and was home to several hotels, restaurants, and amusement parks.
In the 1950s, the area began to decline as the popularity of beach resorts began to wane. The area was eventually annexed by the town of Chesapeake Beach in the 1970s.
Geography
Calvert Beach is located in Calvert County, Maryland. It is situated on the Chesapeake Bay, just south of the Patuxent River. The community is bordered by the towns of Chesapeake Beach and North Beach.
The area is characterized by flat terrain and sandy beaches. The climate is humid subtropical, with hot, humid summers and mild winters.
Economy
The economy of Calvert Beach is largely based on tourism. The area is home to several hotels, restaurants, and amusement parks. The area is also popular with boaters and fishermen.
The area is also home to several small businesses, including a marina, a boat repair shop, and a bait and tackle shop.
Demographics
The population of Calvert Beach was estimated to be 1,845 in 2019. The population is largely white (90.2%) and the median age is 44. The median household income is $77,845 and the median home value is $346,000.
Conclusion
Calvert Beach is a small unincorporated community located in Calvert County, Maryland. It is situated on the Chesapeake Bay, just south of the Patuxent River. The community is bordered by the towns of Chesapeake Beach and North Beach. The population of Calvert Beach was estimated to be 1,845 in 2019. The economy of Calvert Beach is largely based on tourism, with several hotels, restaurants, and amusement parks. The population is largely white (90.2%) and the median age is 44. The median household income is $77,845 and the median home value is $346,000.
Common Questions
What is the Total Population of Calvert Beach?
Total Population of Calvert Beach is 1,026.
What is the Total Male Population of Calvert Beach?
Total Male Population of Calvert Beach is 517.
What is the Total Female Population of Calvert Beach?
Total Female Population of Calvert Beach is 509.
What is the Ratio of Males per 100 Females in Calvert Beach?
There are 101.57 Males per 100 Females in Calvert Beach.
What is the Ratio of Females per 100 Males in Calvert Beach?
There are 98.45 Females per 100 Males in Calvert Beach.
What is the Median Population Age in Calvert Beach?
Median Population Age in Calvert Beach is 39.3 Years.
What is the Average Family Size in Calvert Beach
Average Family Size in Calvert Beach is 3.6 People.
What is the Average Household Size in Calvert Beach
Average Household Size in Calvert Beach is 3.2 People.
What is Per Capita Income in Calvert Beach?
Per Capita income in Calvert Beach is $34,408.
What is the Median Family Income in Calvert Beach?
Median Family Income in Calvert Beach is $111,563.
What is the Median Household income in Calvert Beach?
Median Household Income in Calvert Beach is $104,063.
What is Inequality or Gini Index in Calvert Beach?
Inequality or Gini Index in Calvert Beach is 0.33.
How Large is the Labor Force in Calvert Beach?
There are 512 People in the Labor Forcein in Calvert Beach.
What is the Percentage of People in the Labor Force in Calvert Beach?
67.9% of People are in the Labor Force in Calvert Beach.
What is the Unemployment Rate in Calvert Beach?
Unemployment Rate in Calvert Beach is 4.6%.