Cities with the Highest Percentage of Immigrants from Eritrea in Maryland
RELATED REPORTS & OPTIONS
Eritrea
Maryland
Compare Cities
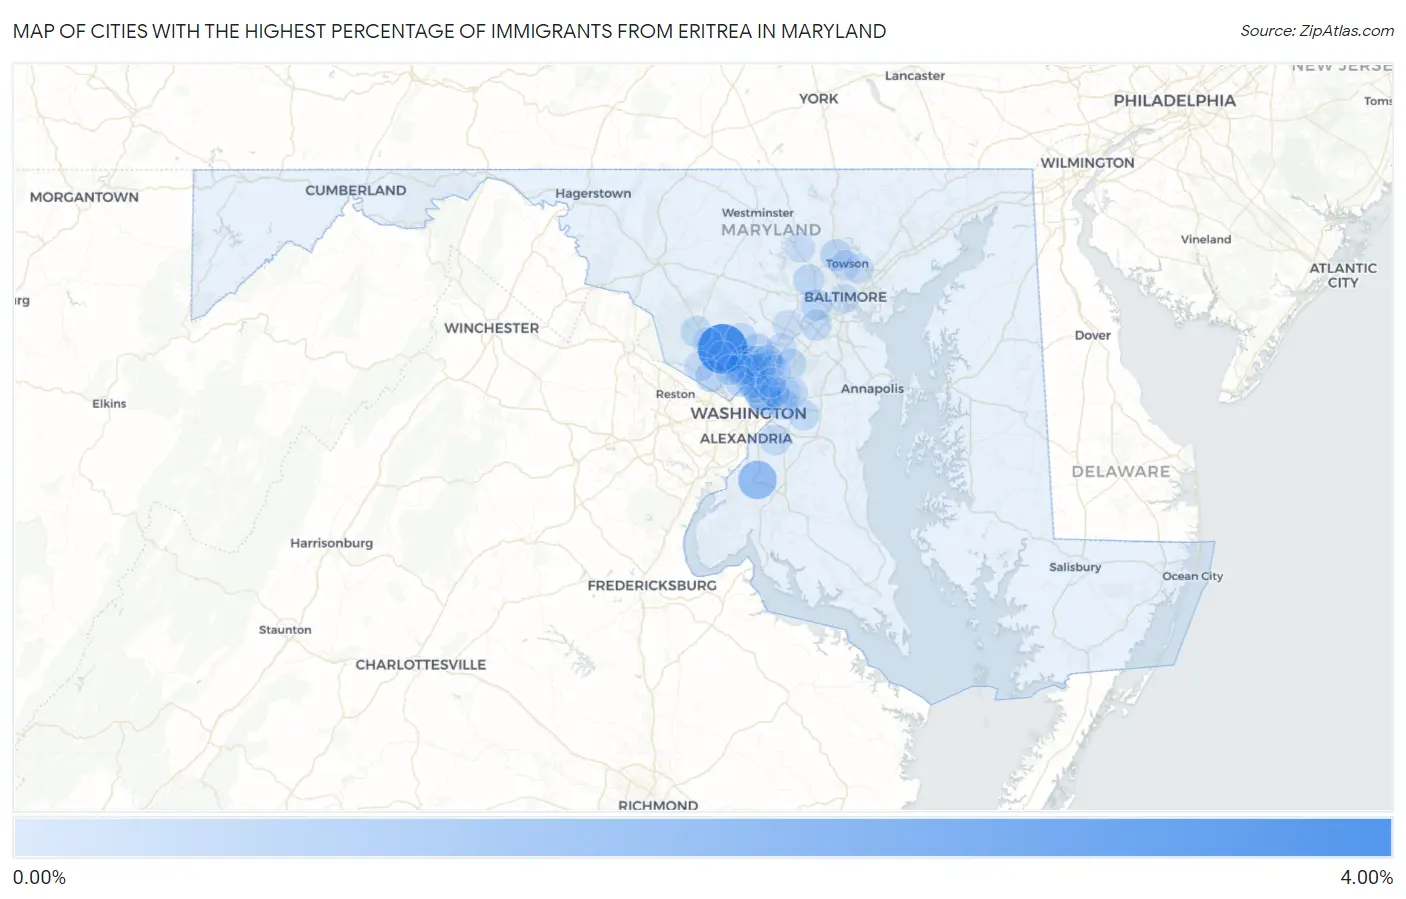
Map of Cities with the Highest Percentage of Immigrants from Eritrea in Maryland
0.00%
4.00%
Cities with the Highest Percentage of Immigrants from Eritrea in Maryland
| City | Eritrea | vs State | vs National | |
| 1. | Derwood | 3.41% | 0.047%(+3.36)#-1 | 0.015%(+3.39)#0 |
| 2. | Green Valley | 1.48% | 0.047%(+1.43)#0 | 0.015%(+1.46)#1 |
| 3. | Accokeek | 1.44% | 0.047%(+1.40)#1 | 0.015%(+1.43)#2 |
| 4. | Chillum | 1.05% | 0.047%(+1.00)#2 | 0.015%(+1.03)#3 |
| 5. | Burnt Mills | 0.66% | 0.047%(+0.608)#3 | 0.015%(+0.640)#59 |
| 6. | Mount Rainier | 0.61% | 0.047%(+0.558)#4 | 0.015%(+0.590)#60 |
| 7. | Glenmont | 0.47% | 0.047%(+0.422)#5 | 0.015%(+0.454)#61 |
| 8. | Cloverly | 0.40% | 0.047%(+0.348)#6 | 0.015%(+0.380)#62 |
| 9. | Wheaton | 0.37% | 0.047%(+0.324)#7 | 0.015%(+0.356)#63 |
| 10. | Silver Spring | 0.33% | 0.047%(+0.284)#8 | 0.015%(+0.316)#64 |
| 11. | Mays Chapel | 0.32% | 0.047%(+0.268)#9 | 0.015%(+0.300)#65 |
| 12. | Calverton | 0.31% | 0.047%(+0.258)#10 | 0.015%(+0.290)#66 |
| 13. | Potomac | 0.27% | 0.047%(+0.226)#11 | 0.015%(+0.258)#67 |
| 14. | Catonsville | 0.26% | 0.047%(+0.210)#12 | 0.015%(+0.242)#68 |
| 15. | Olney | 0.24% | 0.047%(+0.198)#13 | 0.015%(+0.230)#69 |
| 16. | Milford Mill | 0.23% | 0.047%(+0.188)#14 | 0.015%(+0.220)#70 |
| 17. | White Oak | 0.23% | 0.047%(+0.179)#15 | 0.015%(+0.211)#71 |
| 18. | Landover | 0.23% | 0.047%(+0.178)#16 | 0.015%(+0.210)#72 |
| 19. | Takoma Park | 0.22% | 0.047%(+0.169)#17 | 0.015%(+0.201)#73 |
| 20. | Kemp Mill | 0.19% | 0.047%(+0.144)#18 | 0.015%(+0.176)#74 |
| 21. | Germantown | 0.19% | 0.047%(+0.142)#19 | 0.015%(+0.174)#75 |
| 22. | Elkridge | 0.19% | 0.047%(+0.139)#20 | 0.015%(+0.171)#76 |
| 23. | North Kensington | 0.18% | 0.047%(+0.130)#21 | 0.015%(+0.162)#77 |
| 24. | Kettering | 0.17% | 0.047%(+0.126)#22 | 0.015%(+0.158)#78 |
| 25. | Colesville | 0.17% | 0.047%(+0.121)#23 | 0.015%(+0.153)#79 |
| 26. | New Carrollton | 0.16% | 0.047%(+0.115)#24 | 0.015%(+0.147)#162 |
| 27. | Camp Springs | 0.15% | 0.047%(+0.107)#25 | 0.015%(+0.139)#163 |
| 28. | North Chevy Chase | 0.15% | 0.047%(+0.100)#26 | 0.015%(+0.132)#164 |
| 29. | West Laurel | 0.14% | 0.047%(+0.091)#27 | 0.015%(+0.123)#165 |
| 30. | Beltsville | 0.14% | 0.047%(+0.090)#28 | 0.015%(+0.122)#166 |
| 31. | Fairland | 0.12% | 0.047%(+0.076)#29 | 0.015%(+0.108)#167 |
| 32. | Lanham | 0.11% | 0.047%(+0.064)#30 | 0.015%(+0.096)#168 |
| 33. | Travilah | 0.11% | 0.047%(+0.063)#31 | 0.015%(+0.095)#169 |
| 34. | Reisterstown | 0.072% | 0.047%(+0.025)#32 | 0.015%(+0.057)#170 |
| 35. | Riverdale Park | 0.055% | 0.047%(+0.008)#33 | 0.015%(+0.040)#171 |
| 36. | Rockville | 0.048% | 0.047%(+0.000)#34 | 0.015%(+0.032)#330 |
| 37. | North Bethesda | 0.046% | 0.047%(-0.001)#35 | 0.015%(+0.031)#331 |
| 38. | South Laurel | 0.035% | 0.047%(-0.012)#36 | 0.015%(+0.020)#332 |
| 39. | Towson | 0.033% | 0.047%(-0.014)#37 | 0.015%(+0.018)#333 |
| 40. | Parkville | 0.029% | 0.047%(-0.018)#38 | 0.015%(+0.014)#334 |
| 41. | Baltimore | 0.024% | 0.047%(-0.023)#39 | 0.015%(+0.009)#481 |
| 42. | Columbia | 0.011% | 0.047%(-0.036)#40 | 0.015%(-0.004)#482 |
| 43. | Gaithersburg | 0.010% | 0.047%(-0.037)#41 | 0.015%(-0.005)#483 |
| 44. | College Park | 0.0087% | 0.047%(-0.039)#42 | 0.015%(-0.007)#484 |
Common Questions
What are the Top 10 Cities with the Highest Percentage of Immigrants from Eritrea in Maryland?
Top 10 Cities with the Highest Percentage of Immigrants from Eritrea in Maryland are:
#1
3.41%
#2
1.44%
#3
1.05%
#4
0.61%
#5
0.47%
#6
0.40%
#7
0.37%
#8
0.33%
#9
0.32%
#10
0.31%
What city has the Highest Percentage of Immigrants from Eritrea in Maryland?
Derwood has the Highest Percentage of Immigrants from Eritrea in Maryland with 3.41%.
What is the Percentage of Immigrants from Eritrea in the State of Maryland?
Percentage of Immigrants from Eritrea in Maryland is 0.047%.
What is the Percentage of Immigrants from Eritrea in the United States?
Percentage of Immigrants from Eritrea in the United States is 0.015%.