Cities with the Highest Percentage of Immigrants from Guatemala in Maryland
RELATED REPORTS & OPTIONS
Guatemala
Maryland
Compare Cities
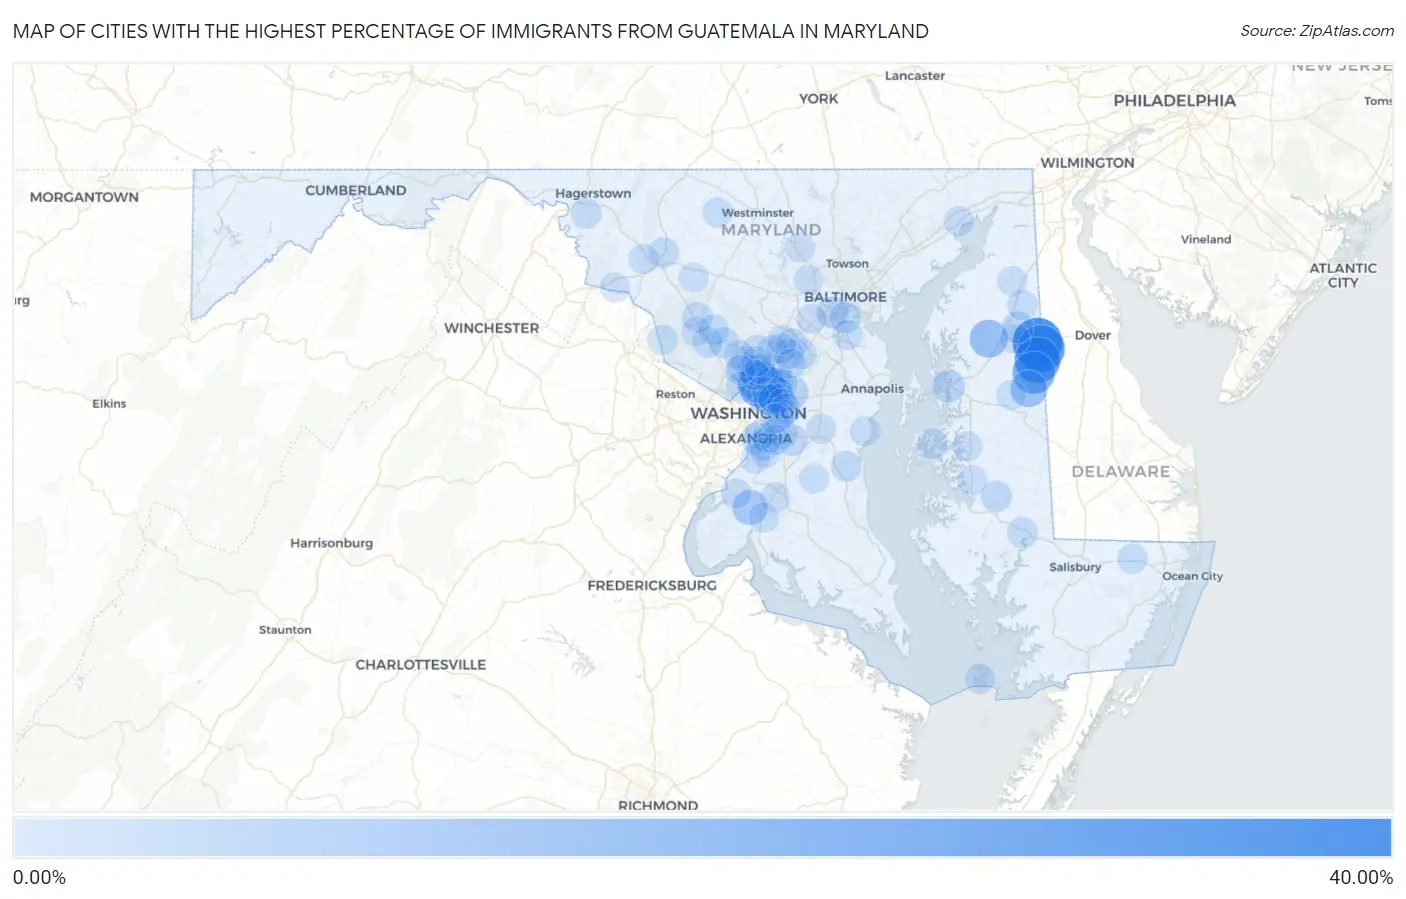
Map of Cities with the Highest Percentage of Immigrants from Guatemala in Maryland
0.00%
40.00%
Cities with the Highest Percentage of Immigrants from Guatemala in Maryland
| City | Guatemala | vs State | vs National | |
| 1. | Templeville | 37.36% | 0.69%(+36.7)#-1 | 0.32%(+37.0)#0 |
| 2. | Marydel | 32.56% | 0.69%(+31.9)#0 | 0.32%(+32.2)#1 |
| 3. | Henderson | 30.20% | 0.69%(+29.5)#1 | 0.32%(+29.9)#2 |
| 4. | Langley Park | 29.81% | 0.69%(+29.1)#28 | 0.32%(+29.5)#358 |
| 5. | Goldsboro | 23.70% | 0.69%(+23.0)#29 | 0.32%(+23.4)#359 |
| 6. | Church Hill | 14.85% | 0.69%(+14.2)#30 | 0.32%(+14.5)#360 |
| 7. | Burnt Mills | 14.80% | 0.69%(+14.1)#31 | 0.32%(+14.5)#361 |
| 8. | Greensboro | 13.13% | 0.69%(+12.4)#32 | 0.32%(+12.8)#362 |
| 9. | Pomfret | 9.97% | 0.69%(+9.29)#33 | 0.32%(+9.66)#363 |
| 10. | Adelphi | 7.06% | 0.69%(+6.37)#68 | 0.32%(+6.74)#636 |
| 11. | Riverdale Park | 6.23% | 0.69%(+5.55)#69 | 0.32%(+5.92)#637 |
| 12. | Queenstown | 4.91% | 0.69%(+4.22)#70 | 0.32%(+4.59)#638 |
| 13. | Lanham | 4.69% | 0.69%(+4.00)#71 | 0.32%(+4.37)#639 |
| 14. | Lansdowne | 4.13% | 0.69%(+3.44)#72 | 0.32%(+3.81)#640 |
| 15. | Beltsville | 4.03% | 0.69%(+3.35)#73 | 0.32%(+3.72)#641 |
| 16. | East Riverdale | 3.97% | 0.69%(+3.28)#74 | 0.32%(+3.65)#646 |
| 17. | Berwyn Heights | 3.86% | 0.69%(+3.18)#75 | 0.32%(+3.55)#647 |
| 18. | Silver Spring | 3.80% | 0.69%(+3.12)#92 | 0.32%(+3.49)#957 |
| 19. | Mount Rainier | 3.78% | 0.69%(+3.09)#98 | 0.32%(+3.46)#977 |
| 20. | Sudlersville | 3.69% | 0.69%(+3.01)#99 | 0.32%(+3.38)#978 |
| 21. | Brentwood | 3.54% | 0.69%(+2.86)#100 | 0.32%(+3.23)#979 |
| 22. | Chillum | 3.39% | 0.69%(+2.70)#101 | 0.32%(+3.07)#980 |
| 23. | Melwood | 3.14% | 0.69%(+2.45)#102 | 0.32%(+2.82)#981 |
| 24. | Brooklyn Park | 3.08% | 0.69%(+2.39)#166 | 0.32%(+2.76)#2,249 |
| 25. | Oxon Hill | 2.97% | 0.69%(+2.28)#167 | 0.32%(+2.65)#2,250 |
| 26. | Secretary | 2.96% | 0.69%(+2.27)#168 | 0.32%(+2.64)#2,251 |
| 27. | Vienna | 2.71% | 0.69%(+2.02)#169 | 0.32%(+2.39)#2,252 |
| 28. | Owings | 2.36% | 0.69%(+1.67)#170 | 0.32%(+2.04)#2,253 |
| 29. | Martin S Additions | 2.32% | 0.69%(+1.63)#171 | 0.32%(+2.00)#2,254 |
| 30. | Edmonston | 2.28% | 0.69%(+1.60)#172 | 0.32%(+1.97)#2,255 |
| 31. | Redland | 2.22% | 0.69%(+1.53)#173 | 0.32%(+1.90)#2,256 |
| 32. | Maryland City | 2.18% | 0.69%(+1.49)#174 | 0.32%(+1.86)#2,257 |
| 33. | Gaithersburg | 2.14% | 0.69%(+1.46)#175 | 0.32%(+1.83)#2,258 |
| 34. | Takoma Park | 2.14% | 0.69%(+1.45)#176 | 0.32%(+1.82)#2,259 |
| 35. | Clarksburg | 2.00% | 0.69%(+1.31)#177 | 0.32%(+1.68)#2,260 |
| 36. | St James | 1.95% | 0.69%(+1.26)#178 | 0.32%(+1.63)#2,261 |
| 37. | Morningside | 1.93% | 0.69%(+1.25)#179 | 0.32%(+1.61)#2,262 |
| 38. | Wheaton | 1.92% | 0.69%(+1.23)#180 | 0.32%(+1.60)#2,263 |
| 39. | Cloverly | 1.90% | 0.69%(+1.21)#181 | 0.32%(+1.58)#2,264 |
| 40. | Forest Heights | 1.89% | 0.69%(+1.21)#182 | 0.32%(+1.58)#2,265 |
| 41. | Frederick | 1.84% | 0.69%(+1.16)#183 | 0.32%(+1.53)#2,266 |
| 42. | Montgomery Village | 1.83% | 0.69%(+1.15)#184 | 0.32%(+1.52)#2,267 |
| 43. | Landover Hills | 1.75% | 0.69%(+1.06)#185 | 0.32%(+1.43)#2,268 |
| 44. | Kemp Mill | 1.70% | 0.69%(+1.01)#186 | 0.32%(+1.38)#2,269 |
| 45. | Peppermill Village | 1.65% | 0.69%(+0.964)#187 | 0.32%(+1.33)#2,270 |
| 46. | Flower Hill | 1.65% | 0.69%(+0.960)#188 | 0.32%(+1.33)#2,271 |
| 47. | Millington | 1.61% | 0.69%(+0.918)#189 | 0.32%(+1.29)#2,272 |
| 48. | Hillandale | 1.60% | 0.69%(+0.912)#190 | 0.32%(+1.28)#2,273 |
| 49. | Glassmanor | 1.54% | 0.69%(+0.851)#191 | 0.32%(+1.22)#2,274 |
| 50. | College Park | 1.53% | 0.69%(+0.847)#192 | 0.32%(+1.22)#2,275 |
| 51. | Temple Hills | 1.53% | 0.69%(+0.841)#193 | 0.32%(+1.21)#2,276 |
| 52. | Glenmont | 1.53% | 0.69%(+0.840)#194 | 0.32%(+1.21)#2,277 |
| 53. | Hyattsville | 1.49% | 0.69%(+0.799)#195 | 0.32%(+1.17)#2,278 |
| 54. | Poolesville | 1.48% | 0.69%(+0.790)#196 | 0.32%(+1.16)#2,279 |
| 55. | Cottage City | 1.43% | 0.69%(+0.748)#197 | 0.32%(+1.12)#2,280 |
| 56. | St Michaels | 1.38% | 0.69%(+0.692)#198 | 0.32%(+1.06)#2,281 |
| 57. | Willards | 1.38% | 0.69%(+0.691)#199 | 0.32%(+1.06)#2,282 |
| 58. | Greenbelt | 1.34% | 0.69%(+0.652)#200 | 0.32%(+1.02)#2,283 |
| 59. | Aspen Hill | 1.32% | 0.69%(+0.634)#201 | 0.32%(+1.00)#2,284 |
| 60. | Woodlawn Cdp Prince George S County | 1.24% | 0.69%(+0.550)#202 | 0.32%(+0.920)#2,285 |
| 61. | Bladensburg | 1.22% | 0.69%(+0.535)#203 | 0.32%(+0.904)#2,286 |
| 62. | Summerfield | 1.21% | 0.69%(+0.523)#204 | 0.32%(+0.893)#2,287 |
| 63. | North Laurel | 1.19% | 0.69%(+0.501)#205 | 0.32%(+0.870)#2,288 |
| 64. | Laurel | 1.18% | 0.69%(+0.496)#206 | 0.32%(+0.865)#2,289 |
| 65. | Union Bridge | 1.17% | 0.69%(+0.484)#207 | 0.32%(+0.854)#2,290 |
| 66. | Glen Burnie | 1.07% | 0.69%(+0.387)#208 | 0.32%(+0.756)#2,291 |
| 67. | Friendly | 1.06% | 0.69%(+0.375)#209 | 0.32%(+0.744)#2,292 |
| 68. | Bryans Road | 1.04% | 0.69%(+0.349)#210 | 0.32%(+0.718)#2,293 |
| 69. | Four Corners | 1.03% | 0.69%(+0.343)#211 | 0.32%(+0.712)#2,294 |
| 70. | Shady Side | 1.03% | 0.69%(+0.341)#212 | 0.32%(+0.711)#2,295 |
| 71. | White Oak | 0.99% | 0.69%(+0.307)#213 | 0.32%(+0.677)#2,296 |
| 72. | Marlboro Meadows | 0.98% | 0.69%(+0.298)#214 | 0.32%(+0.667)#2,297 |
| 73. | Braddock Heights | 0.98% | 0.69%(+0.293)#215 | 0.32%(+0.662)#2,298 |
| 74. | Burtonsville | 0.95% | 0.69%(+0.263)#216 | 0.32%(+0.632)#2,299 |
| 75. | Fort Washington | 0.92% | 0.69%(+0.230)#217 | 0.32%(+0.600)#2,300 |
| 76. | Capitol Heights | 0.89% | 0.69%(+0.205)#218 | 0.32%(+0.575)#2,301 |
| 77. | Landover | 0.88% | 0.69%(+0.193)#219 | 0.32%(+0.562)#2,302 |
| 78. | Waldorf | 0.88% | 0.69%(+0.191)#220 | 0.32%(+0.560)#2,303 |
| 79. | Galena | 0.86% | 0.69%(+0.174)#221 | 0.32%(+0.543)#2,304 |
| 80. | Smith Island | 0.84% | 0.69%(+0.153)#222 | 0.32%(+0.523)#2,305 |
| 81. | Havre De Grace | 0.83% | 0.69%(+0.140)#223 | 0.32%(+0.510)#2,588 |
| 82. | Ilchester | 0.80% | 0.69%(+0.115)#224 | 0.32%(+0.484)#2,589 |
| 83. | Reisterstown | 0.80% | 0.69%(+0.109)#225 | 0.32%(+0.479)#2,590 |
| 84. | Trappe | 0.79% | 0.69%(+0.098)#226 | 0.32%(+0.467)#2,591 |
| 85. | Easton | 0.77% | 0.69%(+0.084)#227 | 0.32%(+0.453)#2,592 |
| 86. | Germantown | 0.74% | 0.69%(+0.058)#228 | 0.32%(+0.427)#2,593 |
| 87. | Colesville | 0.74% | 0.69%(+0.057)#229 | 0.32%(+0.427)#2,594 |
| 88. | Baden | 0.74% | 0.69%(+0.049)#230 | 0.32%(+0.418)#2,595 |
| 89. | Ridgely | 0.69% | 0.69%(+0.008)#231 | 0.32%(+0.377)#2,596 |
| 90. | La Plata | 0.69% | 0.69%(+0.003)#232 | 0.32%(+0.373)#2,597 |
| 91. | North Kensington | 0.66% | 0.69%(-0.026)#233 | 0.32%(+0.343)#2,598 |
| 92. | Camp Springs | 0.65% | 0.69%(-0.038)#234 | 0.32%(+0.331)#2,599 |
| 93. | West Laurel | 0.65% | 0.69%(-0.041)#235 | 0.32%(+0.329)#2,600 |
| 94. | Brunswick | 0.62% | 0.69%(-0.070)#236 | 0.32%(+0.299)#2,601 |
| 95. | Scaggsville | 0.61% | 0.69%(-0.076)#237 | 0.32%(+0.294)#2,602 |
| 96. | Milford Mill | 0.61% | 0.69%(-0.081)#238 | 0.32%(+0.288)#2,603 |
| 97. | Monrovia | 0.60% | 0.69%(-0.083)#239 | 0.32%(+0.286)#2,604 |
| 98. | Coral Hills | 0.57% | 0.69%(-0.114)#240 | 0.32%(+0.256)#2,605 |
| 99. | Barclay | 0.57% | 0.69%(-0.116)#241 | 0.32%(+0.254)#2,606 |
| 100. | South Laurel | 0.55% | 0.69%(-0.139)#242 | 0.32%(+0.231)#2,607 |
Common Questions
What are the Top 10 Cities with the Highest Percentage of Immigrants from Guatemala in Maryland?
Top 10 Cities with the Highest Percentage of Immigrants from Guatemala in Maryland are:
#1
37.36%
#2
32.56%
#3
30.20%
#4
29.81%
#5
23.70%
#6
14.85%
#7
13.13%
#8
9.97%
#9
7.06%
#10
6.23%
What city has the Highest Percentage of Immigrants from Guatemala in Maryland?
Templeville has the Highest Percentage of Immigrants from Guatemala in Maryland with 37.36%.
What is the Percentage of Immigrants from Guatemala in the State of Maryland?
Percentage of Immigrants from Guatemala in Maryland is 0.69%.
What is the Percentage of Immigrants from Guatemala in the United States?
Percentage of Immigrants from Guatemala in the United States is 0.32%.