Cities with the Highest Owner-Occupied Median Costs of Housing in Maryland
RELATED REPORTS & OPTIONS
Highest Owner Housing Costs
Maryland
Compare Cities
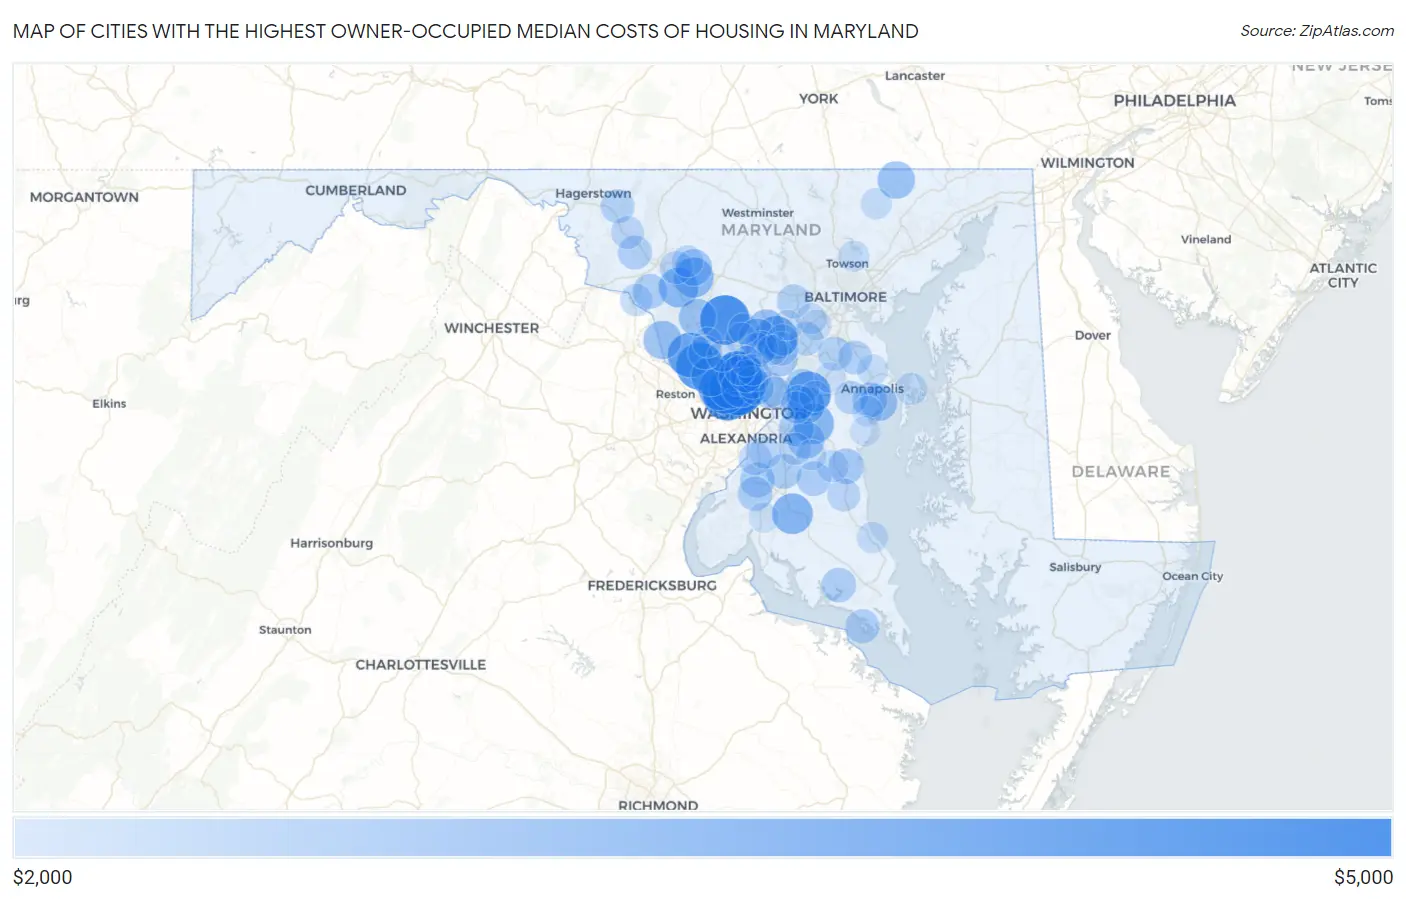
Map of Cities with the Highest Owner-Occupied Median Costs of Housing in Maryland
$0
$5,000
Cities with the Highest Owner-Occupied Median Costs of Housing in Maryland
| City | Housing Costs | vs State | vs National | |
| 1. | Chevy Chase View | $4,001 | $1,815(+2.19k)#1 | $1,282(+2.72k)#127 |
| 2. | Chevy Chase Section Three | $4,001 | $1,815(+2.19k)#2 | $1,282(+2.72k)#132 |
| 3. | Chevy Chase Section Five | $4,001 | $1,815(+2.19k)#3 | $1,282(+2.72k)#144 |
| 4. | Laytonsville | $4,001 | $1,815(+2.19k)#4 | $1,282(+2.72k)#147 |
| 5. | Somerset | $3,906 | $1,815(+2.09k)#5 | $1,282(+2.62k)#204 |
| 6. | Brookmont | $3,887 | $1,815(+2.07k)#6 | $1,282(+2.60k)#210 |
| 7. | Chevy Chase Village | $3,875 | $1,815(+2.06k)#7 | $1,282(+2.59k)#211 |
| 8. | North Chevy Chase | $3,788 | $1,815(+1.97k)#8 | $1,282(+2.51k)#235 |
| 9. | Travilah | $3,781 | $1,815(+1.97k)#9 | $1,282(+2.50k)#237 |
| 10. | Chevy Chase | $3,637 | $1,815(+1.82k)#10 | $1,282(+2.35k)#276 |
| 11. | Glen Echo | $3,591 | $1,815(+1.78k)#11 | $1,282(+2.31k)#287 |
| 12. | Darnestown | $3,537 | $1,815(+1.72k)#12 | $1,282(+2.25k)#308 |
| 13. | Fairwood | $3,532 | $1,815(+1.72k)#13 | $1,282(+2.25k)#314 |
| 14. | Cabin John | $3,407 | $1,815(+1.59k)#14 | $1,282(+2.12k)#364 |
| 15. | Kensington | $3,384 | $1,815(+1.57k)#15 | $1,282(+2.10k)#377 |
| 16. | Fulton | $3,359 | $1,815(+1.54k)#16 | $1,282(+2.08k)#388 |
| 17. | Bethesda | $3,340 | $1,815(+1.52k)#17 | $1,282(+2.06k)#397 |
| 18. | Bryantown | $3,163 | $1,815(+1.35k)#18 | $1,282(+1.88k)#490 |
| 19. | Brock Hall | $3,147 | $1,815(+1.33k)#19 | $1,282(+1.86k)#505 |
| 20. | Garrett Park | $3,138 | $1,815(+1.32k)#20 | $1,282(+1.86k)#515 |
| 21. | Potomac | $3,118 | $1,815(+1.30k)#21 | $1,282(+1.84k)#532 |
| 22. | South Kensington | $3,116 | $1,815(+1.30k)#22 | $1,282(+1.83k)#534 |
| 23. | Martin S Additions | $3,109 | $1,815(+1.29k)#23 | $1,282(+1.83k)#537 |
| 24. | Monrovia | $3,093 | $1,815(+1.28k)#24 | $1,282(+1.81k)#549 |
| 25. | Urbana | $3,092 | $1,815(+1.28k)#25 | $1,282(+1.81k)#550 |
| 26. | Poolesville | $2,928 | $1,815(+1.11k)#26 | $1,282(+1.65k)#691 |
| 27. | Highland | $2,925 | $1,815(+1.11k)#27 | $1,282(+1.64k)#694 |
| 28. | Ashton Sandy Spring | $2,913 | $1,815(+1.10k)#28 | $1,282(+1.63k)#710 |
| 29. | Pylesville | $2,870 | $1,815(+1.05k)#29 | $1,282(+1.59k)#751 |
| 30. | Woodmore | $2,856 | $1,815(+1.04k)#30 | $1,282(+1.57k)#762 |
| 31. | Clarksburg | $2,853 | $1,815(+1.04k)#31 | $1,282(+1.57k)#765 |
| 32. | Highland Beach | $2,833 | $1,815(+1.02k)#32 | $1,282(+1.55k)#786 |
| 33. | Queensland | $2,798 | $1,815(+983)#33 | $1,282(+1.52k)#811 |
| 34. | New Market | $2,790 | $1,815(+975)#34 | $1,282(+1.51k)#828 |
| 35. | Burnt Mills | $2,732 | $1,815(+917)#35 | $1,282(+1.45k)#904 |
| 36. | University Park | $2,703 | $1,815(+888)#36 | $1,282(+1.42k)#944 |
| 37. | Owings | $2,680 | $1,815(+865)#37 | $1,282(+1.40k)#967 |
| 38. | Westphalia | $2,667 | $1,815(+852)#38 | $1,282(+1.39k)#979 |
| 39. | Konterra | $2,665 | $1,815(+850)#39 | $1,282(+1.38k)#982 |
| 40. | Annapolis Neck | $2,644 | $1,815(+829)#40 | $1,282(+1.36k)#1,022 |
| 41. | Brandywine | $2,638 | $1,815(+823)#41 | $1,282(+1.36k)#1,034 |
| 42. | Accokeek | $2,634 | $1,815(+819)#42 | $1,282(+1.35k)#1,040 |
| 43. | Takoma Park | $2,628 | $1,815(+813)#43 | $1,282(+1.35k)#1,053 |
| 44. | Glenn Dale | $2,627 | $1,815(+812)#44 | $1,282(+1.34k)#1,056 |
| 45. | Adamstown | $2,617 | $1,815(+802)#45 | $1,282(+1.33k)#1,074 |
| 46. | Baden | $2,612 | $1,815(+797)#46 | $1,282(+1.33k)#1,079 |
| 47. | Bensville | $2,608 | $1,815(+793)#47 | $1,282(+1.33k)#1,086 |
| 48. | Leonardtown | $2,608 | $1,815(+793)#48 | $1,282(+1.33k)#1,089 |
| 49. | Cloverly | $2,592 | $1,815(+777)#49 | $1,282(+1.31k)#1,120 |
| 50. | Mitchellville | $2,592 | $1,815(+777)#50 | $1,282(+1.31k)#1,121 |
| 51. | Tall Timbers | $2,565 | $1,815(+750)#51 | $1,282(+1.28k)#1,173 |
| 52. | Middletown | $2,549 | $1,815(+734)#52 | $1,282(+1.27k)#1,203 |
| 53. | Gambrills | $2,544 | $1,815(+729)#53 | $1,282(+1.26k)#1,211 |
| 54. | Mount Aetna | $2,538 | $1,815(+723)#54 | $1,282(+1.26k)#1,221 |
| 55. | West Laurel | $2,536 | $1,815(+721)#55 | $1,282(+1.25k)#1,227 |
| 56. | Severna Park | $2,535 | $1,815(+720)#56 | $1,282(+1.25k)#1,229 |
| 57. | Ellicott City | $2,534 | $1,815(+719)#57 | $1,282(+1.25k)#1,230 |
| 58. | Jessup | $2,533 | $1,815(+718)#58 | $1,282(+1.25k)#1,233 |
| 59. | North Potomac | $2,523 | $1,815(+708)#59 | $1,282(+1.24k)#1,251 |
| 60. | Riva | $2,491 | $1,815(+676)#60 | $1,282(+1.21k)#1,310 |
| 61. | Fort Washington | $2,479 | $1,815(+664)#61 | $1,282(+1.20k)#1,330 |
| 62. | Green Valley | $2,477 | $1,815(+662)#62 | $1,282(+1.20k)#1,333 |
| 63. | Bartonsville | $2,475 | $1,815(+660)#63 | $1,282(+1.19k)#1,336 |
| 64. | Four Corners | $2,471 | $1,815(+656)#64 | $1,282(+1.19k)#1,344 |
| 65. | Spencerville | $2,462 | $1,815(+647)#65 | $1,282(+1.18k)#1,357 |
| 66. | Huntingtown | $2,452 | $1,815(+637)#66 | $1,282(+1.17k)#1,376 |
| 67. | Myersville | $2,451 | $1,815(+636)#67 | $1,282(+1.17k)#1,379 |
| 68. | Point Of Rocks | $2,410 | $1,815(+595)#68 | $1,282(+1.13k)#1,453 |
| 69. | Silver Spring | $2,408 | $1,815(+593)#69 | $1,282(+1.13k)#1,456 |
| 70. | Forest Glen | $2,403 | $1,815(+588)#70 | $1,282(+1.12k)#1,465 |
| 71. | Friendly | $2,393 | $1,815(+578)#71 | $1,282(+1.11k)#1,485 |
| 72. | Lake Arbor | $2,381 | $1,815(+566)#72 | $1,282(+1.10k)#1,512 |
| 73. | Olney | $2,379 | $1,815(+564)#73 | $1,282(+1.10k)#1,517 |
| 74. | Rosaryville | $2,373 | $1,815(+558)#74 | $1,282(+1.09k)#1,528 |
| 75. | Dunkirk | $2,372 | $1,815(+557)#75 | $1,282(+1.09k)#1,532 |
| 76. | Stevensville | $2,363 | $1,815(+548)#76 | $1,282(+1.08k)#1,547 |
| 77. | Linganore | $2,357 | $1,815(+542)#77 | $1,282(+1.07k)#1,564 |
| 78. | Riverdale Park | $2,326 | $1,815(+511)#78 | $1,282(+1.04k)#1,644 |
| 79. | St Leonard | $2,313 | $1,815(+498)#79 | $1,282(+1.03k)#1,671 |
| 80. | Scaggsville | $2,309 | $1,815(+494)#80 | $1,282(+1.03k)#1,685 |
| 81. | Arnold | $2,300 | $1,815(+485)#81 | $1,282(+1.02k)#1,717 |
| 82. | Jarrettsville | $2,300 | $1,815(+485)#82 | $1,282(+1.02k)#1,719 |
| 83. | Kemp Mill | $2,296 | $1,815(+481)#83 | $1,282(+1.01k)#1,730 |
| 84. | Hampton | $2,287 | $1,815(+472)#84 | $1,282(+1.00k)#1,756 |
| 85. | Bowie | $2,286 | $1,815(+471)#85 | $1,282(+1.00k)#1,760 |
| 86. | Rockville | $2,276 | $1,815(+461)#86 | $1,282(+994)#1,789 |
| 87. | Ilchester | $2,269 | $1,815(+454)#87 | $1,282(+987)#1,806 |
| 88. | Brookeville | $2,269 | $1,815(+454)#88 | $1,282(+987)#1,811 |
| 89. | Brown Station | $2,265 | $1,815(+450)#89 | $1,282(+983)#1,820 |
| 90. | Mayo | $2,252 | $1,815(+437)#90 | $1,282(+970)#1,841 |
| 91. | Croom | $2,250 | $1,815(+435)#91 | $1,282(+968)#1,844 |
| 92. | Glenmont | $2,249 | $1,815(+434)#92 | $1,282(+967)#1,852 |
| 93. | Elkridge | $2,240 | $1,815(+425)#93 | $1,282(+958)#1,871 |
| 94. | Burtonsville | $2,239 | $1,815(+424)#94 | $1,282(+957)#1,874 |
| 95. | Crofton | $2,237 | $1,815(+422)#95 | $1,282(+955)#1,876 |
| 96. | North Kensington | $2,236 | $1,815(+421)#96 | $1,282(+954)#1,880 |
| 97. | Columbia | $2,230 | $1,815(+415)#97 | $1,282(+948)#1,890 |
| 98. | Shady Side | $2,215 | $1,815(+400)#98 | $1,282(+933)#1,926 |
| 99. | La Plata | $2,209 | $1,815(+394)#99 | $1,282(+927)#1,943 |
| 100. | Gaithersburg | $2,204 | $1,815(+389)#100 | $1,282(+922)#1,955 |
Common Questions
What are the Top 10 Cities with the Highest Owner-Occupied Median Costs of Housing in Maryland?
Top 10 Cities with the Highest Owner-Occupied Median Costs of Housing in Maryland are:
#1
$4,001
#2
$4,001
#3
$4,001
#4
$4,001
#5
$3,906
#6
$3,887
#7
$3,875
#8
$3,788
#9
$3,781
#10
$3,637
What city has the Highest Owner-Occupied Median Costs of Housing in Maryland?
Chevy Chase View has the Highest Owner-Occupied Median Costs of Housing in Maryland with $4,001.
What is the Median Renter-Occupied Housing Costs in the State of Maryland?
Median Renter-Occupied Housing Costs in Maryland is $1,815.
What is the Median Renter-Occupied Housing Costs in the United States?
Median Renter-Occupied Housing Costs in the United States is $1,282.