Cities with the Highest Percentage of Immigrants from Northern Europe in Illinois
RELATED REPORTS & OPTIONS
Northern Europe
Illinois
Compare Cities
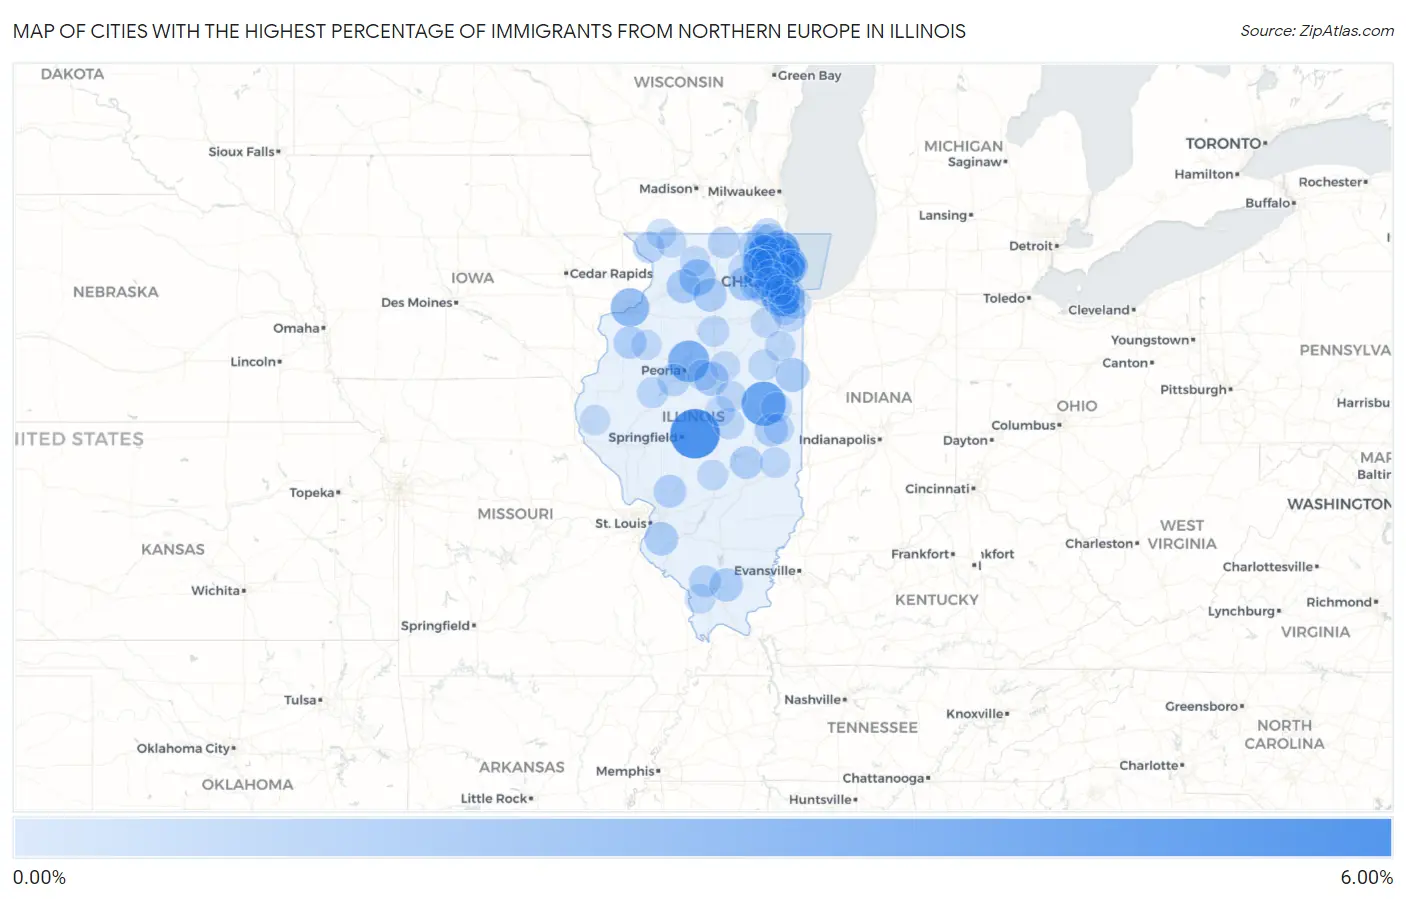
Map of Cities with the Highest Percentage of Immigrants from Northern Europe in Illinois
0.00%
6.00%
Cities with the Highest Percentage of Immigrants from Northern Europe in Illinois
| City | Northern Europe | vs State | vs National | |
| 1. | Buffalo | 5.79% | 0.23%(+5.56)#1 | 0.29%(+5.51)#72 |
| 2. | Thomasboro | 4.30% | 0.23%(+4.07)#2 | 0.29%(+4.02)#135 |
| 3. | Solon Mills | 3.71% | 0.23%(+3.48)#3 | 0.29%(+3.43)#188 |
| 4. | Bay View Gardens | 3.51% | 0.23%(+3.28)#4 | 0.29%(+3.22)#215 |
| 5. | Palos Park | 3.18% | 0.23%(+2.96)#5 | 0.29%(+2.90)#246 |
| 6. | Forest Lake | 2.75% | 0.23%(+2.52)#6 | 0.29%(+2.47)#327 |
| 7. | Rock Island Arsenal | 2.67% | 0.23%(+2.44)#7 | 0.29%(+2.38)#348 |
| 8. | Long Grove | 2.58% | 0.23%(+2.36)#8 | 0.29%(+2.30)#373 |
| 9. | Green Oaks | 2.22% | 0.23%(+1.99)#9 | 0.29%(+1.94)#452 |
| 10. | Tower Lakes | 2.11% | 0.23%(+1.88)#10 | 0.29%(+1.82)#488 |
| 11. | Lost Nation | 2.06% | 0.23%(+1.83)#11 | 0.29%(+1.78)#510 |
| 12. | Lake Barrington | 1.69% | 0.23%(+1.46)#12 | 0.29%(+1.41)#688 |
| 13. | Carlock | 1.54% | 0.23%(+1.31)#13 | 0.29%(+1.25)#796 |
| 14. | Bannockburn | 1.50% | 0.23%(+1.27)#14 | 0.29%(+1.22)#826 |
| 15. | Nelson | 1.47% | 0.23%(+1.24)#15 | 0.29%(+1.19)#855 |
| 16. | Barrington | 1.47% | 0.23%(+1.24)#16 | 0.29%(+1.18)#857 |
| 17. | Milford | 1.44% | 0.23%(+1.22)#17 | 0.29%(+1.16)#871 |
| 18. | Kaneville | 1.40% | 0.23%(+1.17)#18 | 0.29%(+1.12)#907 |
| 19. | Winnetka | 1.36% | 0.23%(+1.14)#19 | 0.29%(+1.08)#940 |
| 20. | Smithton | 1.36% | 0.23%(+1.13)#20 | 0.29%(+1.07)#951 |
| 21. | West Brooklyn | 1.31% | 0.23%(+1.08)#21 | 0.29%(+1.02)#1,006 |
| 22. | Glencoe | 1.26% | 0.23%(+1.03)#22 | 0.29%(+0.978)#1,051 |
| 23. | Pittsburg | 1.26% | 0.23%(+1.03)#23 | 0.29%(+0.976)#1,057 |
| 24. | Lake Forest | 1.26% | 0.23%(+1.03)#24 | 0.29%(+0.975)#1,060 |
| 25. | Inverness | 1.24% | 0.23%(+1.01)#25 | 0.29%(+0.958)#1,074 |
| 26. | Longview | 1.22% | 0.23%(+0.991)#26 | 0.29%(+0.934)#1,111 |
| 27. | Trout Valley | 1.18% | 0.23%(+0.952)#27 | 0.29%(+0.895)#1,165 |
| 28. | East Dundee | 1.17% | 0.23%(+0.943)#28 | 0.29%(+0.887)#1,177 |
| 29. | Gays | 1.17% | 0.23%(+0.941)#29 | 0.29%(+0.884)#1,180 |
| 30. | Wilsonville | 1.16% | 0.23%(+0.928)#30 | 0.29%(+0.871)#1,199 |
| 31. | Alexis | 1.12% | 0.23%(+0.890)#31 | 0.29%(+0.833)#1,259 |
| 32. | Kildeer | 1.09% | 0.23%(+0.860)#32 | 0.29%(+0.803)#1,300 |
| 33. | Prairie Grove | 1.07% | 0.23%(+0.839)#33 | 0.29%(+0.782)#1,345 |
| 34. | Kingston Mines | 1.03% | 0.23%(+0.802)#34 | 0.29%(+0.746)#1,408 |
| 35. | Kenilworth | 1.02% | 0.23%(+0.796)#35 | 0.29%(+0.739)#1,429 |
| 36. | Lake Bluff | 1.01% | 0.23%(+0.785)#36 | 0.29%(+0.728)#1,447 |
| 37. | Hinsdale | 1.00% | 0.23%(+0.767)#37 | 0.29%(+0.711)#1,482 |
| 38. | Harwood Heights | 0.98% | 0.23%(+0.756)#38 | 0.29%(+0.699)#1,507 |
| 39. | Western Springs | 0.96% | 0.23%(+0.730)#39 | 0.29%(+0.674)#1,557 |
| 40. | De Soto | 0.89% | 0.23%(+0.662)#40 | 0.29%(+0.605)#1,704 |
| 41. | Naperville | 0.85% | 0.23%(+0.624)#41 | 0.29%(+0.567)#1,813 |
| 42. | Caledonia | 0.83% | 0.23%(+0.601)#42 | 0.29%(+0.544)#1,877 |
| 43. | Pistakee Highlands | 0.82% | 0.23%(+0.592)#43 | 0.29%(+0.535)#1,905 |
| 44. | Bull Valley | 0.80% | 0.23%(+0.573)#44 | 0.29%(+0.516)#1,955 |
| 45. | Orland Hills | 0.79% | 0.23%(+0.561)#45 | 0.29%(+0.504)#1,995 |
| 46. | Westlake | 0.76% | 0.23%(+0.532)#46 | 0.29%(+0.475)#2,075 |
| 47. | Evanston | 0.76% | 0.23%(+0.528)#47 | 0.29%(+0.471)#2,087 |
| 48. | Oak Lawn | 0.74% | 0.23%(+0.512)#48 | 0.29%(+0.455)#2,138 |
| 49. | Elizabeth | 0.74% | 0.23%(+0.507)#49 | 0.29%(+0.450)#2,149 |
| 50. | Lewistown | 0.72% | 0.23%(+0.494)#50 | 0.29%(+0.437)#2,183 |
| 51. | Tonica | 0.72% | 0.23%(+0.488)#51 | 0.29%(+0.431)#2,206 |
| 52. | Skokie | 0.71% | 0.23%(+0.478)#52 | 0.29%(+0.421)#2,234 |
| 53. | Batavia | 0.70% | 0.23%(+0.473)#53 | 0.29%(+0.417)#2,248 |
| 54. | Lisle | 0.70% | 0.23%(+0.469)#54 | 0.29%(+0.413)#2,262 |
| 55. | Lake Catherine | 0.69% | 0.23%(+0.458)#55 | 0.29%(+0.401)#2,305 |
| 56. | Piper City | 0.67% | 0.23%(+0.443)#56 | 0.29%(+0.387)#2,358 |
| 57. | Argenta | 0.67% | 0.23%(+0.438)#57 | 0.29%(+0.381)#2,378 |
| 58. | Mettawa | 0.67% | 0.23%(+0.437)#58 | 0.29%(+0.380)#2,383 |
| 59. | Monee | 0.66% | 0.23%(+0.436)#59 | 0.29%(+0.379)#2,391 |
| 60. | Goodfield | 0.66% | 0.23%(+0.434)#60 | 0.29%(+0.377)#2,399 |
| 61. | Park Ridge | 0.66% | 0.23%(+0.427)#61 | 0.29%(+0.370)#2,425 |
| 62. | Deer Park | 0.65% | 0.23%(+0.421)#62 | 0.29%(+0.364)#2,442 |
| 63. | Oak Brook | 0.63% | 0.23%(+0.404)#63 | 0.29%(+0.347)#2,501 |
| 64. | Wayne | 0.63% | 0.23%(+0.401)#64 | 0.29%(+0.344)#2,513 |
| 65. | Le Roy | 0.62% | 0.23%(+0.392)#65 | 0.29%(+0.335)#2,555 |
| 66. | Wilmington | 0.62% | 0.23%(+0.387)#66 | 0.29%(+0.330)#2,578 |
| 67. | Lemont | 0.61% | 0.23%(+0.381)#67 | 0.29%(+0.324)#2,603 |
| 68. | Thornton | 0.60% | 0.23%(+0.371)#68 | 0.29%(+0.314)#2,644 |
| 69. | Westfield | 0.60% | 0.23%(+0.368)#69 | 0.29%(+0.311)#2,660 |
| 70. | Royal | 0.59% | 0.23%(+0.361)#70 | 0.29%(+0.305)#2,697 |
| 71. | South Elgin | 0.59% | 0.23%(+0.359)#71 | 0.29%(+0.302)#2,705 |
| 72. | Lake Villa | 0.57% | 0.23%(+0.346)#72 | 0.29%(+0.289)#2,773 |
| 73. | Chebanse | 0.57% | 0.23%(+0.345)#73 | 0.29%(+0.288)#2,779 |
| 74. | Oconee | 0.56% | 0.23%(+0.330)#74 | 0.29%(+0.273)#2,854 |
| 75. | Allerton | 0.55% | 0.23%(+0.318)#75 | 0.29%(+0.261)#2,922 |
| 76. | Westmont | 0.54% | 0.23%(+0.307)#76 | 0.29%(+0.250)#2,964 |
| 77. | Orland Park | 0.53% | 0.23%(+0.301)#77 | 0.29%(+0.244)#2,994 |
| 78. | Wilmette | 0.53% | 0.23%(+0.297)#78 | 0.29%(+0.240)#3,020 |
| 79. | Alto Pass | 0.52% | 0.23%(+0.296)#79 | 0.29%(+0.240)#3,022 |
| 80. | Wataga | 0.52% | 0.23%(+0.294)#80 | 0.29%(+0.237)#3,030 |
| 81. | Palos Hills | 0.52% | 0.23%(+0.291)#81 | 0.29%(+0.234)#3,048 |
| 82. | Coatsburg | 0.51% | 0.23%(+0.276)#82 | 0.29%(+0.220)#3,116 |
| 83. | Frankfort | 0.50% | 0.23%(+0.275)#83 | 0.29%(+0.218)#3,121 |
| 84. | Island Lake | 0.50% | 0.23%(+0.269)#84 | 0.29%(+0.212)#3,153 |
| 85. | West Dundee | 0.50% | 0.23%(+0.269)#85 | 0.29%(+0.212)#3,157 |
| 86. | Gridley | 0.49% | 0.23%(+0.264)#86 | 0.29%(+0.208)#3,180 |
| 87. | Barrington Hills | 0.49% | 0.23%(+0.260)#87 | 0.29%(+0.203)#3,208 |
| 88. | Crestwood | 0.47% | 0.23%(+0.246)#88 | 0.29%(+0.190)#3,280 |
| 89. | Elmhurst | 0.47% | 0.23%(+0.245)#89 | 0.29%(+0.188)#3,292 |
| 90. | Sleepy Hollow | 0.47% | 0.23%(+0.239)#90 | 0.29%(+0.183)#3,325 |
| 91. | North Aurora | 0.47% | 0.23%(+0.239)#91 | 0.29%(+0.182)#3,327 |
| 92. | Burlington | 0.47% | 0.23%(+0.238)#92 | 0.29%(+0.181)#3,340 |
| 93. | Clinton | 0.46% | 0.23%(+0.236)#93 | 0.29%(+0.179)#3,349 |
| 94. | Lena | 0.46% | 0.23%(+0.234)#94 | 0.29%(+0.177)#3,356 |
| 95. | South Barrington | 0.46% | 0.23%(+0.231)#95 | 0.29%(+0.175)#3,370 |
| 96. | Leaf River | 0.46% | 0.23%(+0.229)#96 | 0.29%(+0.172)#3,382 |
| 97. | Bloomingdale | 0.45% | 0.23%(+0.226)#97 | 0.29%(+0.169)#3,401 |
| 98. | Wheaton | 0.45% | 0.23%(+0.226)#98 | 0.29%(+0.169)#3,403 |
| 99. | Warren | 0.45% | 0.23%(+0.224)#99 | 0.29%(+0.167)#3,429 |
| 100. | Burr Ridge | 0.45% | 0.23%(+0.221)#100 | 0.29%(+0.164)#3,447 |
Common Questions
What are the Top 10 Cities with the Highest Percentage of Immigrants from Northern Europe in Illinois?
Top 10 Cities with the Highest Percentage of Immigrants from Northern Europe in Illinois are:
#1
5.79%
#2
4.30%
#3
3.51%
#4
3.18%
#5
2.75%
#6
2.67%
#7
2.58%
#8
2.22%
#9
2.11%
#10
2.06%
What city has the Highest Percentage of Immigrants from Northern Europe in Illinois?
Buffalo has the Highest Percentage of Immigrants from Northern Europe in Illinois with 5.79%.
What is the Percentage of Immigrants from Northern Europe in the State of Illinois?
Percentage of Immigrants from Northern Europe in Illinois is 0.23%.
What is the Percentage of Immigrants from Northern Europe in the United States?
Percentage of Immigrants from Northern Europe in the United States is 0.29%.