Cities with the Highest Percentage of Immigrants from Russia in Maryland
RELATED REPORTS & OPTIONS
Russia
Maryland
Compare Cities
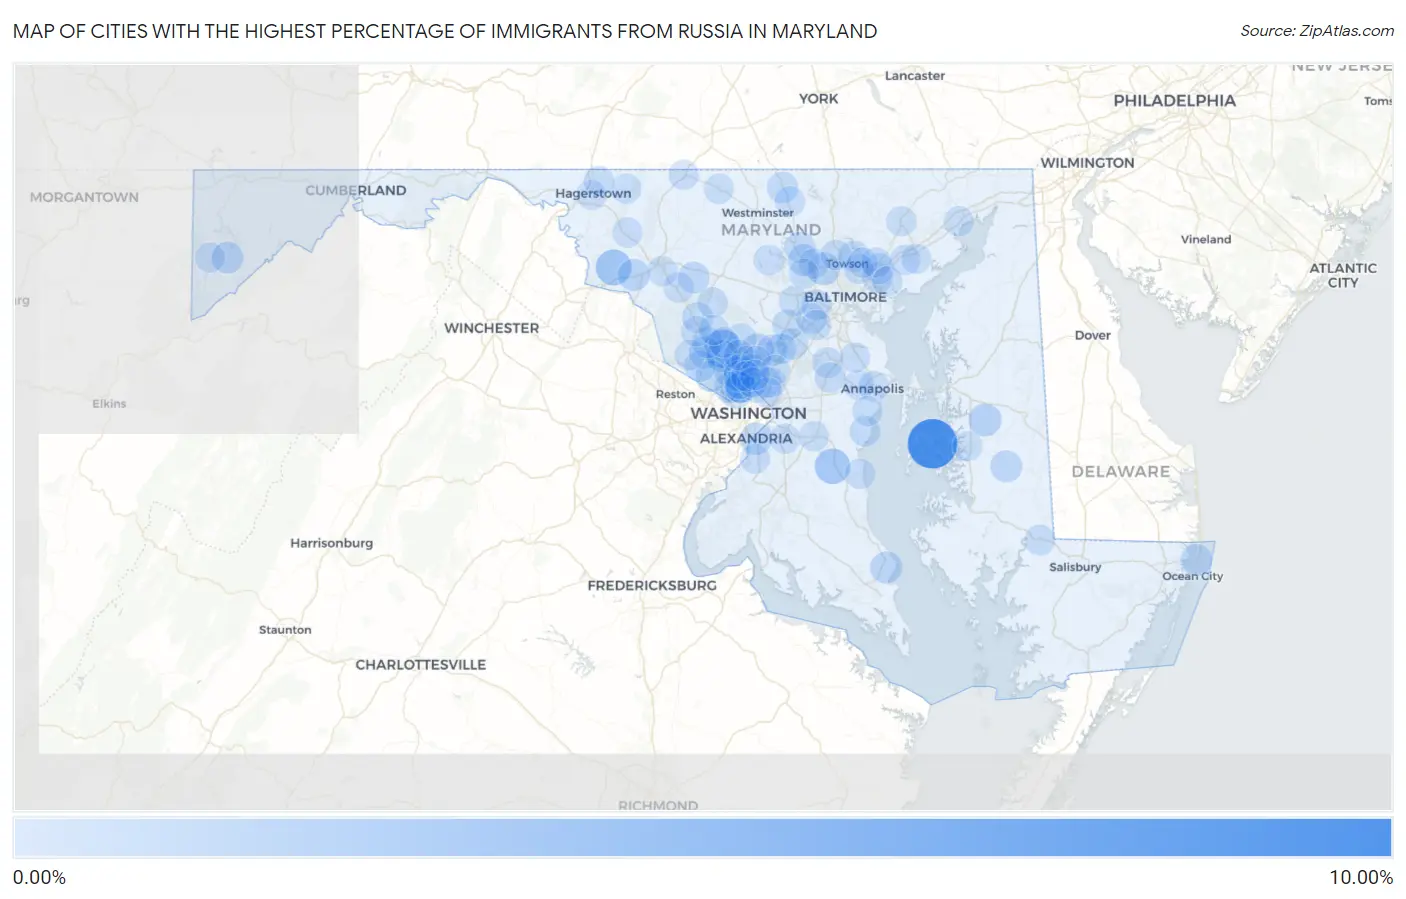
Map of Cities with the Highest Percentage of Immigrants from Russia in Maryland
0.00%
10.00%
Cities with the Highest Percentage of Immigrants from Russia in Maryland
| City | Russia | vs State | vs National | |
| 1. | St Michaels | 9.59% | 0.15%(+9.43)#1 | 0.12%(+9.46)#11 |
| 2. | Derwood | 3.89% | 0.15%(+3.74)#2 | 0.12%(+3.77)#37 |
| 3. | Burkittsville | 2.80% | 0.15%(+2.64)#3 | 0.12%(+2.67)#62 |
| 4. | Dunkirk | 2.59% | 0.15%(+2.44)#4 | 0.12%(+2.47)#71 |
| 5. | Kensington | 1.43% | 0.15%(+1.27)#5 | 0.12%(+1.31)#209 |
| 6. | Cordova | 1.38% | 0.15%(+1.22)#6 | 0.12%(+1.25)#226 |
| 7. | Pikesville | 1.32% | 0.15%(+1.16)#7 | 0.12%(+1.19)#250 |
| 8. | Cloverly | 1.20% | 0.15%(+1.05)#8 | 0.12%(+1.08)#288 |
| 9. | Forest Heights | 1.10% | 0.15%(+0.944)#9 | 0.12%(+0.975)#323 |
| 10. | North Bethesda | 1.10% | 0.15%(+0.941)#10 | 0.12%(+0.972)#324 |
| 11. | Rockville | 1.01% | 0.15%(+0.854)#11 | 0.12%(+0.885)#362 |
| 12. | Chevy Chase Section Five | 1.01% | 0.15%(+0.851)#12 | 0.12%(+0.882)#363 |
| 13. | Lusby | 0.98% | 0.15%(+0.825)#13 | 0.12%(+0.856)#374 |
| 14. | Jefferson | 0.91% | 0.15%(+0.758)#14 | 0.12%(+0.789)#413 |
| 15. | Deer Park | 0.89% | 0.15%(+0.736)#15 | 0.12%(+0.767)#425 |
| 16. | North Potomac | 0.87% | 0.15%(+0.713)#16 | 0.12%(+0.744)#440 |
| 17. | Preston | 0.86% | 0.15%(+0.704)#17 | 0.12%(+0.735)#445 |
| 18. | North Kensington | 0.81% | 0.15%(+0.660)#18 | 0.12%(+0.692)#474 |
| 19. | Friendship Heights Village | 0.81% | 0.15%(+0.657)#19 | 0.12%(+0.688)#476 |
| 20. | Ocean City | 0.78% | 0.15%(+0.631)#20 | 0.12%(+0.662)#501 |
| 21. | Monrovia | 0.74% | 0.15%(+0.584)#21 | 0.12%(+0.615)#535 |
| 22. | Owings Mills | 0.72% | 0.15%(+0.569)#22 | 0.12%(+0.600)#549 |
| 23. | Kemp Mill | 0.72% | 0.15%(+0.563)#23 | 0.12%(+0.594)#557 |
| 24. | Bethesda | 0.69% | 0.15%(+0.540)#24 | 0.12%(+0.571)#586 |
| 25. | Potomac | 0.69% | 0.15%(+0.539)#25 | 0.12%(+0.570)#589 |
| 26. | North Laurel | 0.66% | 0.15%(+0.501)#26 | 0.12%(+0.533)#628 |
| 27. | Travilah | 0.65% | 0.15%(+0.501)#27 | 0.12%(+0.532)#629 |
| 28. | Manchester | 0.65% | 0.15%(+0.494)#28 | 0.12%(+0.525)#634 |
| 29. | Gaithersburg | 0.62% | 0.15%(+0.469)#29 | 0.12%(+0.500)#673 |
| 30. | Ten Mile Creek | 0.61% | 0.15%(+0.452)#30 | 0.12%(+0.483)#695 |
| 31. | Reisterstown | 0.59% | 0.15%(+0.436)#31 | 0.12%(+0.467)#716 |
| 32. | Hampton | 0.57% | 0.15%(+0.417)#32 | 0.12%(+0.448)#747 |
| 33. | Burtonsville | 0.56% | 0.15%(+0.408)#33 | 0.12%(+0.439)#756 |
| 34. | Martin S Additions | 0.50% | 0.15%(+0.350)#34 | 0.12%(+0.381)#845 |
| 35. | Chevy Chase Section Three | 0.49% | 0.15%(+0.333)#35 | 0.12%(+0.364)#879 |
| 36. | Olney | 0.46% | 0.15%(+0.311)#36 | 0.12%(+0.342)#924 |
| 37. | Clarksburg | 0.43% | 0.15%(+0.280)#37 | 0.12%(+0.311)#972 |
| 38. | South Kensington | 0.43% | 0.15%(+0.276)#38 | 0.12%(+0.307)#984 |
| 39. | Shady Side | 0.42% | 0.15%(+0.270)#39 | 0.12%(+0.301)#995 |
| 40. | Columbia | 0.41% | 0.15%(+0.254)#40 | 0.12%(+0.285)#1,038 |
| 41. | Ilchester | 0.41% | 0.15%(+0.253)#41 | 0.12%(+0.284)#1,043 |
| 42. | Mardela Springs | 0.38% | 0.15%(+0.224)#42 | 0.12%(+0.255)#1,122 |
| 43. | Rossville | 0.34% | 0.15%(+0.188)#43 | 0.12%(+0.219)#1,216 |
| 44. | Mays Chapel | 0.34% | 0.15%(+0.186)#44 | 0.12%(+0.217)#1,221 |
| 45. | White Marsh | 0.33% | 0.15%(+0.175)#45 | 0.12%(+0.206)#1,261 |
| 46. | Chevy Chase | 0.33% | 0.15%(+0.173)#46 | 0.12%(+0.204)#1,266 |
| 47. | Odenton | 0.30% | 0.15%(+0.142)#47 | 0.12%(+0.173)#1,376 |
| 48. | Catonsville | 0.29% | 0.15%(+0.138)#48 | 0.12%(+0.169)#1,391 |
| 49. | Urbana | 0.29% | 0.15%(+0.138)#49 | 0.12%(+0.169)#1,394 |
| 50. | West Laurel | 0.28% | 0.15%(+0.123)#50 | 0.12%(+0.154)#1,445 |
| 51. | Crofton | 0.28% | 0.15%(+0.122)#51 | 0.12%(+0.153)#1,449 |
| 52. | Damascus | 0.26% | 0.15%(+0.101)#52 | 0.12%(+0.132)#1,530 |
| 53. | Paramount Long Meadow | 0.25% | 0.15%(+0.097)#53 | 0.12%(+0.128)#1,550 |
| 54. | Naval Academy | 0.25% | 0.15%(+0.094)#54 | 0.12%(+0.125)#1,562 |
| 55. | Eldersburg | 0.23% | 0.15%(+0.080)#55 | 0.12%(+0.111)#1,640 |
| 56. | Darnestown | 0.22% | 0.15%(+0.071)#56 | 0.12%(+0.102)#1,684 |
| 57. | Germantown | 0.22% | 0.15%(+0.070)#57 | 0.12%(+0.101)#1,691 |
| 58. | Emmitsburg | 0.21% | 0.15%(+0.059)#58 | 0.12%(+0.090)#1,768 |
| 59. | Redland | 0.21% | 0.15%(+0.059)#59 | 0.12%(+0.090)#1,769 |
| 60. | Glenmont | 0.20% | 0.15%(+0.045)#60 | 0.12%(+0.076)#1,841 |
| 61. | Andrews Afb | 0.19% | 0.15%(+0.040)#61 | 0.12%(+0.071)#1,868 |
| 62. | College Park | 0.19% | 0.15%(+0.038)#62 | 0.12%(+0.069)#1,878 |
| 63. | Parole | 0.18% | 0.15%(+0.030)#63 | 0.12%(+0.061)#1,915 |
| 64. | Takoma Park | 0.18% | 0.15%(+0.029)#64 | 0.12%(+0.060)#1,922 |
| 65. | Colesville | 0.18% | 0.15%(+0.021)#65 | 0.12%(+0.052)#1,983 |
| 66. | Ellicott City | 0.17% | 0.15%(+0.013)#66 | 0.12%(+0.044)#2,043 |
| 67. | Smithsburg | 0.17% | 0.15%(+0.011)#67 | 0.12%(+0.042)#2,050 |
| 68. | Joppatowne | 0.16% | 0.15%(+0.010)#68 | 0.12%(+0.041)#2,056 |
| 69. | Myersville | 0.16% | 0.15%(+0.007)#69 | 0.12%(+0.038)#2,078 |
| 70. | Adelphi | 0.16% | 0.15%(+0.005)#70 | 0.12%(+0.037)#2,085 |
| 71. | Edgewood | 0.16% | 0.15%(+0.005)#71 | 0.12%(+0.036)#2,087 |
| 72. | Burnt Mills | 0.16% | 0.15%(+0.004)#72 | 0.12%(+0.035)#2,093 |
| 73. | Garrison | 0.15% | 0.15%(-0.000)#73 | 0.12%(+0.031)#2,130 |
| 74. | Ballenger Creek | 0.15% | 0.15%(-0.006)#74 | 0.12%(+0.025)#2,171 |
| 75. | Silver Spring | 0.15% | 0.15%(-0.007)#75 | 0.12%(+0.024)#2,181 |
| 76. | Mayo | 0.15% | 0.15%(-0.009)#76 | 0.12%(+0.023)#2,199 |
| 77. | Perry Hall | 0.14% | 0.15%(-0.010)#77 | 0.12%(+0.021)#2,211 |
| 78. | Hampstead | 0.14% | 0.15%(-0.011)#78 | 0.12%(+0.021)#2,214 |
| 79. | Chesapeake Beach | 0.14% | 0.15%(-0.012)#79 | 0.12%(+0.019)#2,224 |
| 80. | Bel Air North | 0.14% | 0.15%(-0.017)#80 | 0.12%(+0.015)#2,256 |
| 81. | Upper Marlboro | 0.13% | 0.15%(-0.022)#81 | 0.12%(+0.009)#2,307 |
| 82. | Parkville | 0.13% | 0.15%(-0.026)#82 | 0.12%(+0.005)#2,347 |
| 83. | Aspen Hill | 0.12% | 0.15%(-0.030)#83 | 0.12%(+0.001)#2,386 |
| 84. | Beltsville | 0.12% | 0.15%(-0.032)#84 | 0.12%(-0.001)#2,402 |
| 85. | Easton | 0.12% | 0.15%(-0.037)#85 | 0.12%(-0.006)#2,449 |
| 86. | Fort Washington | 0.12% | 0.15%(-0.038)#86 | 0.12%(-0.007)#2,460 |
| 87. | Montgomery Village | 0.11% | 0.15%(-0.042)#87 | 0.12%(-0.011)#2,498 |
| 88. | Taneytown | 0.11% | 0.15%(-0.043)#88 | 0.12%(-0.012)#2,512 |
| 89. | Middle River | 0.11% | 0.15%(-0.045)#89 | 0.12%(-0.014)#2,531 |
| 90. | Carney | 0.10% | 0.15%(-0.052)#90 | 0.12%(-0.021)#2,603 |
| 91. | Forest Glen | 0.10% | 0.15%(-0.052)#91 | 0.12%(-0.021)#2,606 |
| 92. | Oakland | 0.10% | 0.15%(-0.054)#92 | 0.12%(-0.023)#2,626 |
| 93. | Severna Park | 0.099% | 0.15%(-0.055)#93 | 0.12%(-0.024)#2,640 |
| 94. | Randallstown | 0.094% | 0.15%(-0.060)#94 | 0.12%(-0.029)#2,703 |
| 95. | Hyattsville | 0.091% | 0.15%(-0.063)#95 | 0.12%(-0.032)#2,732 |
| 96. | Four Corners | 0.090% | 0.15%(-0.064)#96 | 0.12%(-0.033)#2,741 |
| 97. | Havre De Grace | 0.088% | 0.15%(-0.066)#97 | 0.12%(-0.035)#2,768 |
| 98. | Elkridge | 0.087% | 0.15%(-0.067)#98 | 0.12%(-0.036)#2,780 |
| 99. | Woodlawn Cdp Baltimore County | 0.085% | 0.15%(-0.069)#99 | 0.12%(-0.038)#2,802 |
| 100. | Hagerstown | 0.078% | 0.15%(-0.075)#100 | 0.12%(-0.044)#2,869 |
Common Questions
What are the Top 10 Cities with the Highest Percentage of Immigrants from Russia in Maryland?
Top 10 Cities with the Highest Percentage of Immigrants from Russia in Maryland are:
#1
9.59%
#2
3.89%
#3
2.80%
#4
2.59%
#5
1.43%
#6
1.38%
#7
1.32%
#8
1.20%
#9
1.10%
#10
1.10%
What city has the Highest Percentage of Immigrants from Russia in Maryland?
St Michaels has the Highest Percentage of Immigrants from Russia in Maryland with 9.59%.
What is the Percentage of Immigrants from Russia in the State of Maryland?
Percentage of Immigrants from Russia in Maryland is 0.15%.
What is the Percentage of Immigrants from Russia in the United States?
Percentage of Immigrants from Russia in the United States is 0.12%.