Cities with the Highest Percentage of Immigrants from Northern Europe in Oklahoma
RELATED REPORTS & OPTIONS
Northern Europe
Oklahoma
Compare Cities
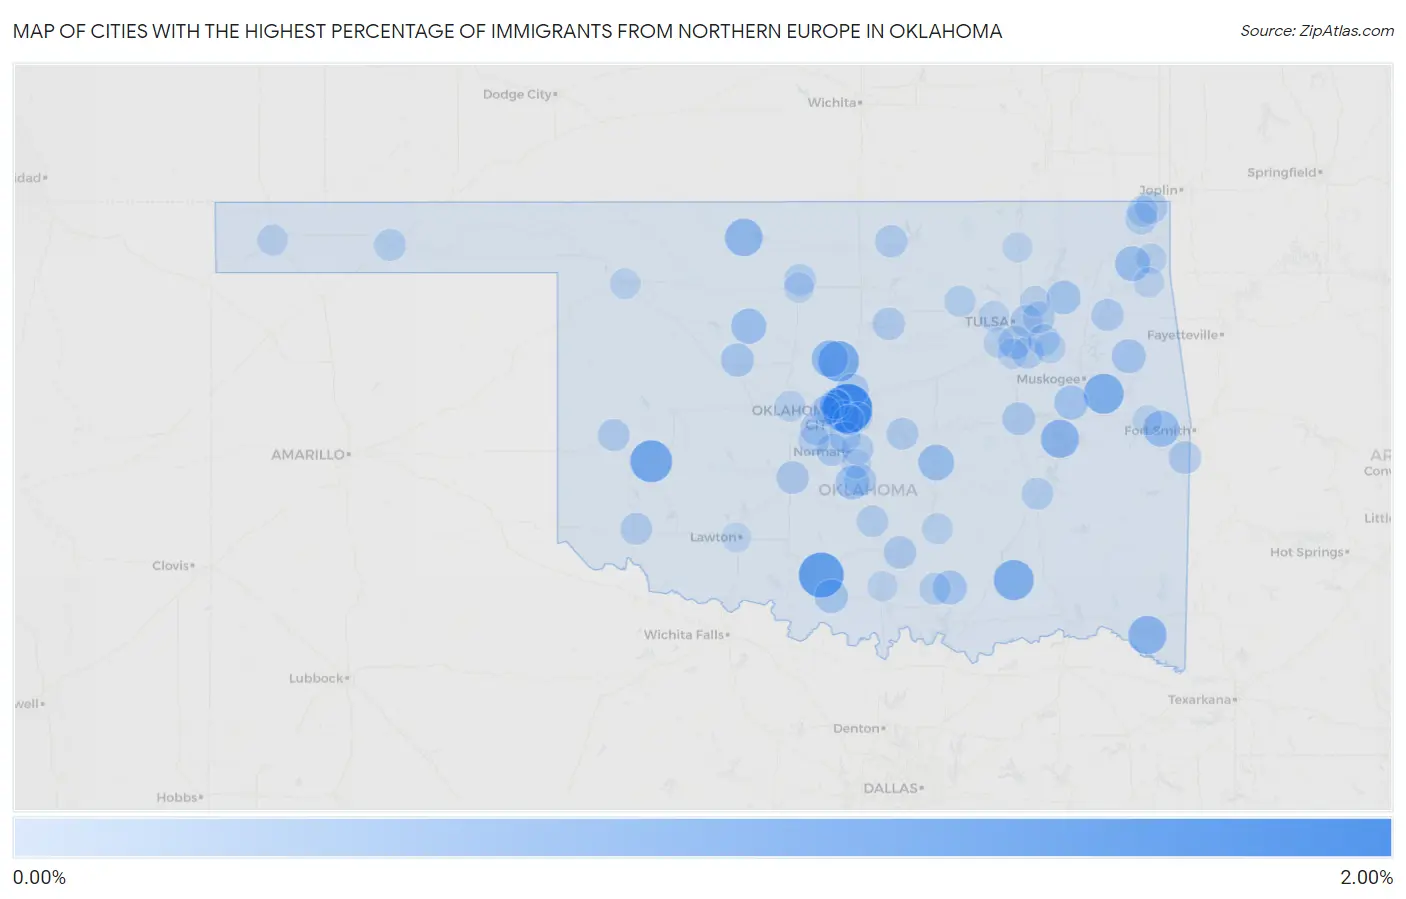
Map of Cities with the Highest Percentage of Immigrants from Northern Europe in Oklahoma
0.00%
2.00%
Cities with the Highest Percentage of Immigrants from Northern Europe in Oklahoma
| City | Northern Europe | vs State | vs National | |
| 1. | Lake Aluma | 1.89% | 0.10%(+1.78)#1 | 0.29%(+1.60)#587 |
| 2. | Loco | 1.43% | 0.10%(+1.33)#2 | 0.29%(+1.14)#886 |
| 3. | Taylor Ferry | 1.23% | 0.10%(+1.13)#3 | 0.29%(+0.948)#1,093 |
| 4. | Sentinel | 1.13% | 0.10%(+1.03)#4 | 0.29%(+0.845)#1,236 |
| 5. | Rocky Point | 1.03% | 0.10%(+0.933)#5 | 0.29%(+0.750)#1,401 |
| 6. | Cedar Valley | 1.00% | 0.10%(+0.898)#6 | 0.29%(+0.715)#1,473 |
| 7. | Lane | 0.96% | 0.10%(+0.853)#7 | 0.29%(+0.670)#1,571 |
| 8. | Sand Hill | 0.93% | 0.10%(+0.833)#8 | 0.29%(+0.649)#1,613 |
| 9. | Idabel | 0.77% | 0.10%(+0.670)#9 | 0.29%(+0.487)#2,043 |
| 10. | Eufaula | 0.76% | 0.10%(+0.655)#10 | 0.29%(+0.471)#2,088 |
| 11. | Cherokee | 0.71% | 0.10%(+0.605)#11 | 0.29%(+0.422)#2,233 |
| 12. | Cimarron City | 0.62% | 0.10%(+0.519)#12 | 0.29%(+0.336)#2,552 |
| 13. | Gans | 0.57% | 0.10%(+0.466)#13 | 0.29%(+0.283)#2,807 |
| 14. | Bowlegs | 0.54% | 0.10%(+0.436)#14 | 0.29%(+0.252)#2,957 |
| 15. | Okeene | 0.48% | 0.10%(+0.377)#15 | 0.29%(+0.194)#3,260 |
| 16. | Cleora | 0.46% | 0.10%(+0.362)#16 | 0.29%(+0.179)#3,350 |
| 17. | Tahlequah | 0.38% | 0.10%(+0.282)#17 | 0.29%(+0.099)#3,935 |
| 18. | Milburn | 0.37% | 0.10%(+0.271)#18 | 0.29%(+0.088)#4,035 |
| 19. | Oktaha | 0.37% | 0.10%(+0.268)#19 | 0.29%(+0.085)#4,051 |
| 20. | Purcell | 0.36% | 0.10%(+0.260)#20 | 0.29%(+0.076)#4,116 |
| 21. | Claremore | 0.36% | 0.10%(+0.258)#21 | 0.29%(+0.075)#4,130 |
| 22. | Ringling | 0.35% | 0.10%(+0.250)#22 | 0.29%(+0.066)#4,208 |
| 23. | Watonga | 0.30% | 0.10%(+0.200)#23 | 0.29%(+0.016)#4,661 |
| 24. | Jenks | 0.28% | 0.10%(+0.180)#24 | 0.29%(-0.003)#4,884 |
| 25. | Dewar | 0.27% | 0.10%(+0.169)#25 | 0.29%(-0.015)#4,996 |
| 26. | Rock Island | 0.26% | 0.10%(+0.157)#26 | 0.29%(-0.026)#5,119 |
| 27. | Chickasha | 0.25% | 0.10%(+0.145)#27 | 0.29%(-0.039)#5,275 |
| 28. | Edmond | 0.24% | 0.10%(+0.143)#28 | 0.29%(-0.041)#5,303 |
| 29. | Sulphur | 0.24% | 0.10%(+0.137)#29 | 0.29%(-0.047)#5,362 |
| 30. | Quapaw | 0.24% | 0.10%(+0.133)#30 | 0.29%(-0.050)#5,412 |
| 31. | Nichols Hills | 0.23% | 0.10%(+0.132)#31 | 0.29%(-0.052)#5,428 |
| 32. | Stillwater | 0.22% | 0.10%(+0.120)#32 | 0.29%(-0.063)#5,582 |
| 33. | Mustang | 0.22% | 0.10%(+0.117)#33 | 0.29%(-0.066)#5,620 |
| 34. | Ponca City | 0.21% | 0.10%(+0.111)#34 | 0.29%(-0.073)#5,709 |
| 35. | Locust Grove | 0.21% | 0.10%(+0.109)#35 | 0.29%(-0.075)#5,736 |
| 36. | Newcastle | 0.21% | 0.10%(+0.107)#36 | 0.29%(-0.077)#5,766 |
| 37. | Bixby | 0.20% | 0.10%(+0.100)#37 | 0.29%(-0.084)#5,858 |
| 38. | Tulsa | 0.20% | 0.10%(+0.095)#38 | 0.29%(-0.089)#5,937 |
| 39. | Lexington | 0.20% | 0.10%(+0.094)#39 | 0.29%(-0.089)#5,942 |
| 40. | Altus | 0.19% | 0.10%(+0.090)#40 | 0.29%(-0.093)#5,997 |
| 41. | Elk City | 0.18% | 0.10%(+0.081)#41 | 0.29%(-0.103)#6,143 |
| 42. | Catoosa | 0.18% | 0.10%(+0.080)#42 | 0.29%(-0.103)#6,145 |
| 43. | Shawnee | 0.18% | 0.10%(+0.080)#43 | 0.29%(-0.104)#6,161 |
| 44. | Mcalester | 0.17% | 0.10%(+0.069)#44 | 0.29%(-0.114)#6,306 |
| 45. | Guymon | 0.16% | 0.10%(+0.063)#45 | 0.29%(-0.121)#6,406 |
| 46. | North Enid | 0.16% | 0.10%(+0.063)#46 | 0.29%(-0.121)#6,408 |
| 47. | Broken Arrow | 0.16% | 0.10%(+0.062)#47 | 0.29%(-0.122)#6,416 |
| 48. | Tishomingo | 0.16% | 0.10%(+0.059)#48 | 0.29%(-0.125)#6,457 |
| 49. | Pauls Valley | 0.15% | 0.10%(+0.047)#49 | 0.29%(-0.136)#6,614 |
| 50. | Norman | 0.15% | 0.10%(+0.046)#50 | 0.29%(-0.137)#6,627 |
| 51. | Miami | 0.15% | 0.10%(+0.044)#51 | 0.29%(-0.139)#6,652 |
| 52. | Moore | 0.14% | 0.10%(+0.040)#52 | 0.29%(-0.143)#6,716 |
| 53. | Oklahoma City | 0.13% | 0.10%(+0.024)#53 | 0.29%(-0.160)#6,920 |
| 54. | Cleveland | 0.12% | 0.10%(+0.023)#54 | 0.29%(-0.161)#6,935 |
| 55. | Tuttle | 0.11% | 0.10%(+0.004)#55 | 0.29%(-0.179)#7,194 |
| 56. | Coweta | 0.10% | 0.10%(-0.001)#56 | 0.29%(-0.184)#7,282 |
| 57. | El Reno | 0.092% | 0.10%(-0.010)#57 | 0.29%(-0.194)#7,397 |
| 58. | Ada | 0.091% | 0.10%(-0.011)#58 | 0.29%(-0.195)#7,409 |
| 59. | Boise City | 0.088% | 0.10%(-0.014)#59 | 0.29%(-0.198)#7,468 |
| 60. | Commerce | 0.087% | 0.10%(-0.015)#60 | 0.29%(-0.199)#7,480 |
| 61. | Sand Springs | 0.070% | 0.10%(-0.032)#61 | 0.29%(-0.215)#7,713 |
| 62. | Warr Acres | 0.067% | 0.10%(-0.035)#62 | 0.29%(-0.218)#7,754 |
| 63. | Woodward | 0.058% | 0.10%(-0.044)#63 | 0.29%(-0.227)#7,873 |
| 64. | Grove | 0.057% | 0.10%(-0.045)#64 | 0.29%(-0.228)#7,884 |
| 65. | Midwest City | 0.053% | 0.10%(-0.049)#65 | 0.29%(-0.232)#7,930 |
| 66. | The Village | 0.053% | 0.10%(-0.049)#66 | 0.29%(-0.233)#7,939 |
| 67. | Sapulpa | 0.050% | 0.10%(-0.052)#67 | 0.29%(-0.235)#7,974 |
| 68. | Owasso | 0.050% | 0.10%(-0.052)#68 | 0.29%(-0.236)#7,977 |
| 69. | Enid | 0.037% | 0.10%(-0.065)#69 | 0.29%(-0.248)#8,108 |
| 70. | Glenpool | 0.037% | 0.10%(-0.065)#70 | 0.29%(-0.249)#8,118 |
| 71. | Jay | 0.034% | 0.10%(-0.067)#71 | 0.29%(-0.251)#8,130 |
| 72. | Del City | 0.032% | 0.10%(-0.070)#72 | 0.29%(-0.253)#8,150 |
| 73. | Ardmore | 0.032% | 0.10%(-0.070)#73 | 0.29%(-0.253)#8,151 |
| 74. | Bethany | 0.029% | 0.10%(-0.073)#74 | 0.29%(-0.256)#8,173 |
| 75. | Sallisaw | 0.023% | 0.10%(-0.078)#75 | 0.29%(-0.262)#8,224 |
| 76. | Noble | 0.014% | 0.10%(-0.088)#76 | 0.29%(-0.271)#8,291 |
| 77. | Bartlesville | 0.013% | 0.10%(-0.089)#77 | 0.29%(-0.272)#8,297 |
| 78. | Lawton | 0.0099% | 0.10%(-0.092)#78 | 0.29%(-0.276)#8,315 |
Common Questions
What are the Top 10 Cities with the Highest Percentage of Immigrants from Northern Europe in Oklahoma?
Top 10 Cities with the Highest Percentage of Immigrants from Northern Europe in Oklahoma are:
#1
1.89%
#2
1.43%
#3
1.13%
#4
1.00%
#5
0.96%
#6
0.93%
#7
0.77%
#8
0.76%
#9
0.71%
#10
0.62%
What city has the Highest Percentage of Immigrants from Northern Europe in Oklahoma?
Lake Aluma has the Highest Percentage of Immigrants from Northern Europe in Oklahoma with 1.89%.
What is the Percentage of Immigrants from Northern Europe in the State of Oklahoma?
Percentage of Immigrants from Northern Europe in Oklahoma is 0.10%.
What is the Percentage of Immigrants from Northern Europe in the United States?
Percentage of Immigrants from Northern Europe in the United States is 0.29%.