Cities with the Highest Costs of Housing as Percentage of Income in Maryland
RELATED REPORTS & OPTIONS
Highest Housing Costs / Income
Maryland
Compare Cities
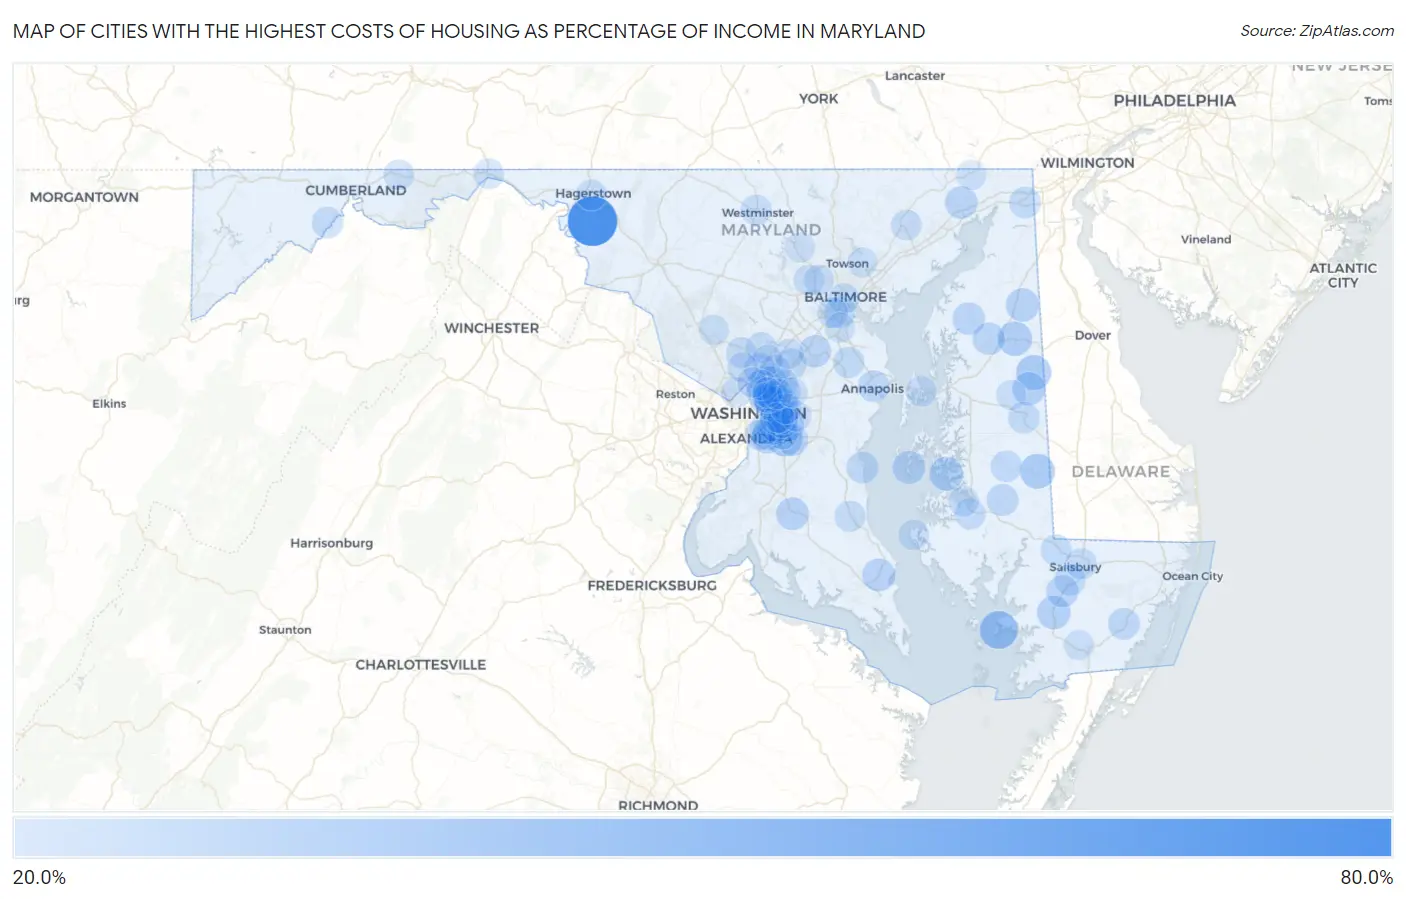
Map of Cities with the Highest Costs of Housing as Percentage of Income in Maryland
0.0%
80.0%
Cities with the Highest Costs of Housing as Percentage of Income in Maryland
| City | Housing Costs / Income | vs State | vs National | |
| 1. | Breathedsville | 76.4% | 20.8%(+55.6)#1 | 20.4%(+56.0)#26 |
| 2. | Deal Island | 44.3% | 20.8%(+23.5)#2 | 20.4%(+23.9)#124 |
| 3. | Chesapeake Landing | 38.9% | 20.8%(+18.1)#3 | 20.4%(+18.5)#224 |
| 4. | Andrews Afb | 37.5% | 20.8%(+16.6)#4 | 20.4%(+17.1)#269 |
| 5. | Goldsboro | 36.4% | 20.8%(+15.6)#5 | 20.4%(+16.0)#332 |
| 6. | Federalsburg | 35.9% | 20.8%(+15.1)#6 | 20.4%(+15.5)#353 |
| 7. | Barclay | 34.8% | 20.8%(+14.0)#7 | 20.4%(+14.5)#413 |
| 8. | Oxford | 33.8% | 20.8%(+13.0)#8 | 20.4%(+13.5)#487 |
| 9. | Princess Anne | 32.7% | 20.8%(+11.9)#9 | 20.4%(+12.3)#594 |
| 10. | Bladensburg | 32.6% | 20.8%(+11.8)#10 | 20.4%(+12.2)#604 |
| 11. | Seat Pleasant | 32.2% | 20.8%(+11.4)#11 | 20.4%(+11.9)#641 |
| 12. | Millington | 32.2% | 20.8%(+11.4)#12 | 20.4%(+11.8)#644 |
| 13. | Fairmount Heights | 31.9% | 20.8%(+11.1)#13 | 20.4%(+11.5)#674 |
| 14. | Greensboro | 31.9% | 20.8%(+11.1)#14 | 20.4%(+11.5)#681 |
| 15. | Solomons | 31.1% | 20.8%(+10.3)#15 | 20.4%(+10.7)#778 |
| 16. | Tilghman Island | 30.9% | 20.8%(+10.1)#16 | 20.4%(+10.5)#811 |
| 17. | Maryland Park | 30.8% | 20.8%(+10.00)#17 | 20.4%(+10.4)#826 |
| 18. | Forestville | 30.8% | 20.8%(+9.95)#18 | 20.4%(+10.4)#833 |
| 19. | Bryantown | 30.7% | 20.8%(+9.85)#19 | 20.4%(+10.3)#852 |
| 20. | Marlow Heights | 30.6% | 20.8%(+9.78)#20 | 20.4%(+10.2)#865 |
| 21. | Port Deposit | 30.4% | 20.8%(+9.58)#21 | 20.4%(+10.0)#899 |
| 22. | Adelphi | 30.3% | 20.8%(+9.45)#22 | 20.4%(+9.89)#919 |
| 23. | Chestertown | 29.9% | 20.8%(+9.12)#23 | 20.4%(+9.56)#991 |
| 24. | Church Hill | 29.8% | 20.8%(+8.99)#24 | 20.4%(+9.43)#1,005 |
| 25. | Fort Meade | 29.7% | 20.8%(+8.91)#25 | 20.4%(+9.35)#1,025 |
| 26. | Temple Hills | 29.1% | 20.8%(+8.29)#26 | 20.4%(+8.73)#1,162 |
| 27. | Eden | 29.0% | 20.8%(+8.18)#27 | 20.4%(+8.62)#1,189 |
| 28. | Silver Hill | 29.0% | 20.8%(+8.16)#28 | 20.4%(+8.60)#1,191 |
| 29. | College Park | 28.6% | 20.8%(+7.82)#29 | 20.4%(+8.26)#1,286 |
| 30. | North Beach | 28.4% | 20.8%(+7.56)#30 | 20.4%(+8.00)#1,360 |
| 31. | North Brentwood | 28.4% | 20.8%(+7.55)#31 | 20.4%(+7.99)#1,367 |
| 32. | Melwood | 28.3% | 20.8%(+7.53)#32 | 20.4%(+7.97)#1,375 |
| 33. | East New Market | 28.2% | 20.8%(+7.39)#33 | 20.4%(+7.83)#1,416 |
| 34. | Snow Hill | 27.9% | 20.8%(+7.12)#34 | 20.4%(+7.56)#1,516 |
| 35. | Naval Academy | 27.9% | 20.8%(+7.12)#35 | 20.4%(+7.56)#1,518 |
| 36. | Chillum | 27.9% | 20.8%(+7.11)#36 | 20.4%(+7.55)#1,526 |
| 37. | Denton | 27.9% | 20.8%(+7.04)#37 | 20.4%(+7.48)#1,561 |
| 38. | Landover | 27.8% | 20.8%(+7.01)#38 | 20.4%(+7.46)#1,571 |
| 39. | Elkton | 27.8% | 20.8%(+6.93)#39 | 20.4%(+7.38)#1,603 |
| 40. | Burnt Mills | 27.6% | 20.8%(+6.81)#40 | 20.4%(+7.25)#1,641 |
| 41. | Baltimore Highlands | 27.5% | 20.8%(+6.67)#41 | 20.4%(+7.11)#1,687 |
| 42. | Cottage City | 27.3% | 20.8%(+6.48)#42 | 20.4%(+6.92)#1,766 |
| 43. | Preston | 27.2% | 20.8%(+6.43)#43 | 20.4%(+6.87)#1,790 |
| 44. | White Oak | 27.2% | 20.8%(+6.38)#44 | 20.4%(+6.82)#1,807 |
| 45. | New Carrollton | 27.2% | 20.8%(+6.35)#45 | 20.4%(+6.79)#1,822 |
| 46. | Mount Rainier | 27.1% | 20.8%(+6.32)#46 | 20.4%(+6.76)#1,829 |
| 47. | Suitland | 27.1% | 20.8%(+6.25)#47 | 20.4%(+6.69)#1,861 |
| 48. | Rawlings | 27.1% | 20.8%(+6.25)#48 | 20.4%(+6.69)#1,863 |
| 49. | Arden On The Severn | 27.0% | 20.8%(+6.22)#49 | 20.4%(+6.67)#1,877 |
| 50. | Fruitland | 27.0% | 20.8%(+6.22)#50 | 20.4%(+6.66)#1,881 |
| 51. | Salisbury | 26.9% | 20.8%(+6.11)#51 | 20.4%(+6.55)#1,926 |
| 52. | Colmar Manor | 26.9% | 20.8%(+6.05)#52 | 20.4%(+6.49)#1,955 |
| 53. | Hebron | 26.5% | 20.8%(+5.71)#53 | 20.4%(+6.15)#2,134 |
| 54. | Cambridge | 26.5% | 20.8%(+5.68)#54 | 20.4%(+6.12)#2,149 |
| 55. | Hillcrest Heights | 26.4% | 20.8%(+5.55)#55 | 20.4%(+5.99)#2,210 |
| 56. | Morningside | 26.3% | 20.8%(+5.52)#56 | 20.4%(+5.96)#2,224 |
| 57. | Walker Mill | 26.3% | 20.8%(+5.46)#57 | 20.4%(+5.90)#2,253 |
| 58. | Coral Hills | 26.2% | 20.8%(+5.43)#58 | 20.4%(+5.87)#2,264 |
| 59. | Baltimore | 26.2% | 20.8%(+5.41)#59 | 20.4%(+5.85)#2,284 |
| 60. | District Heights | 26.1% | 20.8%(+5.28)#60 | 20.4%(+5.72)#2,338 |
| 61. | South Laurel | 26.1% | 20.8%(+5.27)#61 | 20.4%(+5.71)#2,341 |
| 62. | Hagerstown | 26.0% | 20.8%(+5.20)#62 | 20.4%(+5.64)#2,389 |
| 63. | Prince Frederick | 25.9% | 20.8%(+5.09)#63 | 20.4%(+5.53)#2,461 |
| 64. | Westminster | 25.9% | 20.8%(+5.06)#64 | 20.4%(+5.50)#2,482 |
| 65. | Greenbelt | 25.8% | 20.8%(+5.02)#65 | 20.4%(+5.46)#2,503 |
| 66. | Glassmanor | 25.7% | 20.8%(+4.84)#66 | 20.4%(+5.28)#2,621 |
| 67. | Spencerville | 25.6% | 20.8%(+4.81)#67 | 20.4%(+5.25)#2,641 |
| 68. | Leisure World | 25.4% | 20.8%(+4.59)#68 | 20.4%(+5.03)#2,774 |
| 69. | Lansdowne | 25.4% | 20.8%(+4.59)#69 | 20.4%(+5.03)#2,777 |
| 70. | Bel Air | 25.4% | 20.8%(+4.58)#70 | 20.4%(+5.02)#2,779 |
| 71. | Milford Mill | 25.2% | 20.8%(+4.39)#71 | 20.4%(+4.83)#2,908 |
| 72. | Flintstone | 25.2% | 20.8%(+4.35)#72 | 20.4%(+4.79)#2,939 |
| 73. | Edmonston | 25.1% | 20.8%(+4.31)#73 | 20.4%(+4.75)#2,965 |
| 74. | Chester | 25.1% | 20.8%(+4.27)#74 | 20.4%(+4.72)#2,990 |
| 75. | Algonquin | 25.0% | 20.8%(+4.16)#75 | 20.4%(+4.60)#3,069 |
| 76. | Largo | 25.0% | 20.8%(+4.15)#76 | 20.4%(+4.59)#3,084 |
| 77. | Beltsville | 24.9% | 20.8%(+4.13)#77 | 20.4%(+4.57)#3,102 |
| 78. | Brentwood | 24.9% | 20.8%(+4.04)#78 | 20.4%(+4.48)#3,173 |
| 79. | Fairland | 24.8% | 20.8%(+4.02)#79 | 20.4%(+4.46)#3,185 |
| 80. | Capitol Heights | 24.8% | 20.8%(+4.00)#80 | 20.4%(+4.44)#3,202 |
| 81. | Taylors Island | 24.8% | 20.8%(+3.98)#81 | 20.4%(+4.42)#3,210 |
| 82. | Hancock | 24.8% | 20.8%(+3.96)#82 | 20.4%(+4.41)#3,224 |
| 83. | Langley Park | 24.7% | 20.8%(+3.93)#83 | 20.4%(+4.37)#3,248 |
| 84. | Summerfield | 24.7% | 20.8%(+3.92)#84 | 20.4%(+4.36)#3,259 |
| 85. | Friendship Heights Village | 24.7% | 20.8%(+3.87)#85 | 20.4%(+4.31)#3,302 |
| 86. | Montgomery Village | 24.5% | 20.8%(+3.68)#86 | 20.4%(+4.12)#3,442 |
| 87. | Lochearn | 24.4% | 20.8%(+3.57)#87 | 20.4%(+4.01)#3,536 |
| 88. | Wheaton | 24.4% | 20.8%(+3.57)#88 | 20.4%(+4.01)#3,543 |
| 89. | East Riverdale | 24.4% | 20.8%(+3.57)#89 | 20.4%(+4.01)#3,545 |
| 90. | Silver Spring | 24.4% | 20.8%(+3.56)#90 | 20.4%(+4.00)#3,554 |
| 91. | Hyattsville | 24.4% | 20.8%(+3.53)#91 | 20.4%(+3.98)#3,583 |
| 92. | Reisterstown | 24.3% | 20.8%(+3.52)#92 | 20.4%(+3.96)#3,598 |
| 93. | Laurel | 24.3% | 20.8%(+3.49)#93 | 20.4%(+3.93)#3,620 |
| 94. | West Pocomoke | 24.3% | 20.8%(+3.46)#94 | 20.4%(+3.90)#3,638 |
| 95. | Ferndale | 24.3% | 20.8%(+3.45)#95 | 20.4%(+3.89)#3,648 |
| 96. | Ridgely | 24.3% | 20.8%(+3.44)#96 | 20.4%(+3.88)#3,658 |
| 97. | Rising Sun | 24.2% | 20.8%(+3.35)#97 | 20.4%(+3.79)#3,736 |
| 98. | Lanham | 24.1% | 20.8%(+3.25)#98 | 20.4%(+3.69)#3,820 |
| 99. | Woodlawn Cdp Baltimore County | 23.9% | 20.8%(+3.11)#99 | 20.4%(+3.55)#3,923 |
| 100. | Carney | 23.9% | 20.8%(+3.11)#100 | 20.4%(+3.55)#3,926 |
Common Questions
What are the Top 10 Cities with the Highest Costs of Housing as Percentage of Income in Maryland?
Top 10 Cities with the Highest Costs of Housing as Percentage of Income in Maryland are:
#1
76.4%
#2
44.3%
#3
37.5%
#4
36.4%
#5
35.9%
#6
34.8%
#7
33.8%
#8
32.7%
#9
32.6%
#10
32.2%
What city has the Highest Costs of Housing as Percentage of Income in Maryland?
Breathedsville has the Highest Costs of Housing as Percentage of Income in Maryland with 76.4%.
What is the Average Housing Costs as Percentage of Income in the State of Maryland?
Average Housing Costs as Percentage of Income in Maryland is 20.8%.
What is the Average Housing Costs as Percentage of Income in the United States?
Average Housing Costs as Percentage of Income in the United States is 20.4%.