Cities with the Highest Percentage of Immigrants from Northern Europe in Indiana
RELATED REPORTS & OPTIONS
Northern Europe
Indiana
Compare Cities
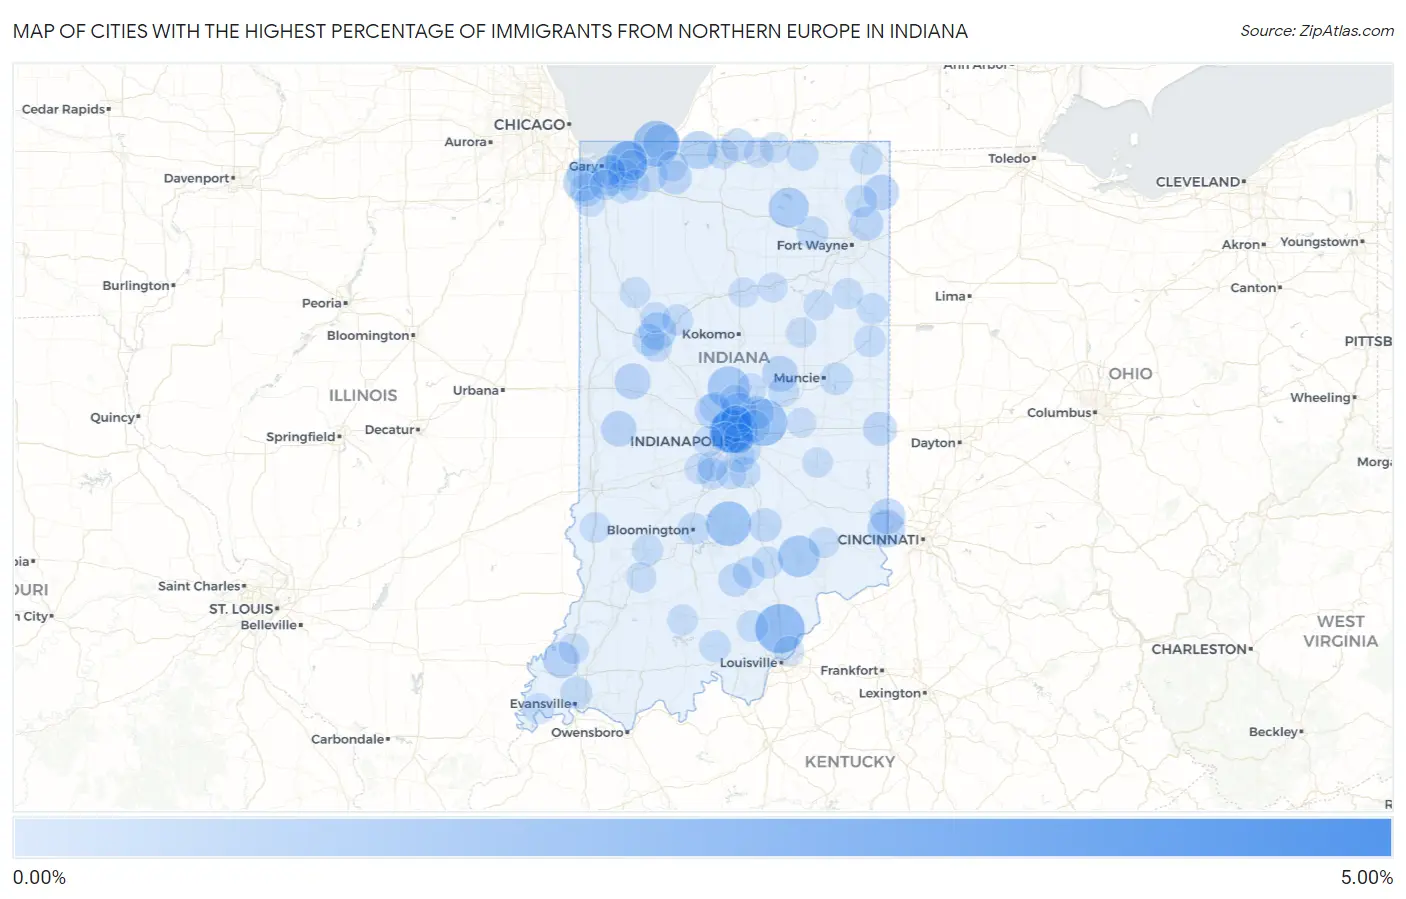
Map of Cities with the Highest Percentage of Immigrants from Northern Europe in Indiana
0.00%
5.00%
Cities with the Highest Percentage of Immigrants from Northern Europe in Indiana
| City | Northern Europe | vs State | vs National | |
| 1. | Harrison Lake | 4.72% | 0.11%(+4.61)#1 | 0.29%(+4.44)#105 |
| 2. | Floyds Knobs | 3.19% | 0.11%(+3.08)#2 | 0.29%(+2.91)#245 |
| 3. | Memphis | 1.96% | 0.11%(+1.85)#3 | 0.29%(+1.68)#554 |
| 4. | Mccordsville | 1.73% | 0.11%(+1.62)#4 | 0.29%(+1.44)#669 |
| 5. | Rocky Ripple | 1.63% | 0.11%(+1.52)#5 | 0.29%(+1.34)#730 |
| 6. | Long Beach | 1.60% | 0.11%(+1.50)#6 | 0.29%(+1.32)#745 |
| 7. | Nashville | 1.51% | 0.11%(+1.40)#7 | 0.29%(+1.22)#822 |
| 8. | Spring Hill | 1.39% | 0.11%(+1.28)#8 | 0.29%(+1.10)#924 |
| 9. | Wynnedale | 1.38% | 0.11%(+1.27)#9 | 0.29%(+1.09)#930 |
| 10. | Sheridan | 1.27% | 0.11%(+1.16)#10 | 0.29%(+0.985)#1,043 |
| 11. | Burns Harbor | 1.25% | 0.11%(+1.14)#11 | 0.29%(+0.960)#1,071 |
| 12. | Vernon | 1.21% | 0.11%(+1.10)#12 | 0.29%(+0.924)#1,122 |
| 13. | North Webster | 1.04% | 0.11%(+0.930)#13 | 0.29%(+0.754)#1,395 |
| 14. | Dyer | 0.87% | 0.11%(+0.756)#14 | 0.29%(+0.580)#1,771 |
| 15. | New Carlisle | 0.83% | 0.11%(+0.723)#15 | 0.29%(+0.547)#1,868 |
| 16. | Battle Ground | 0.82% | 0.11%(+0.711)#16 | 0.29%(+0.535)#1,906 |
| 17. | Hidden Valley | 0.81% | 0.11%(+0.700)#17 | 0.29%(+0.524)#1,936 |
| 18. | Michiana Shores | 0.71% | 0.11%(+0.605)#18 | 0.29%(+0.429)#2,216 |
| 19. | Owensville | 0.70% | 0.11%(+0.595)#19 | 0.29%(+0.419)#2,240 |
| 20. | Carmel | 0.70% | 0.11%(+0.592)#20 | 0.29%(+0.416)#2,249 |
| 21. | Meridian Hills | 0.69% | 0.11%(+0.578)#21 | 0.29%(+0.402)#2,296 |
| 22. | Dune Acres | 0.68% | 0.11%(+0.573)#22 | 0.29%(+0.397)#2,321 |
| 23. | Wingate | 0.66% | 0.11%(+0.555)#23 | 0.29%(+0.379)#2,388 |
| 24. | Frankton | 0.65% | 0.11%(+0.539)#24 | 0.29%(+0.364)#2,445 |
| 25. | West Harrison | 0.62% | 0.11%(+0.512)#25 | 0.29%(+0.336)#2,551 |
| 26. | Butler | 0.62% | 0.11%(+0.510)#26 | 0.29%(+0.334)#2,560 |
| 27. | Marshall | 0.60% | 0.11%(+0.495)#27 | 0.29%(+0.319)#2,631 |
| 28. | Whitestown | 0.59% | 0.11%(+0.476)#28 | 0.29%(+0.300)#2,718 |
| 29. | Leo Cedarville | 0.49% | 0.11%(+0.384)#29 | 0.29%(+0.208)#3,179 |
| 30. | Spring Grove | 0.47% | 0.11%(+0.359)#30 | 0.29%(+0.183)#3,323 |
| 31. | Kingsbury | 0.44% | 0.11%(+0.331)#31 | 0.29%(+0.155)#3,501 |
| 32. | Hobart | 0.44% | 0.11%(+0.330)#32 | 0.29%(+0.154)#3,506 |
| 33. | Columbus | 0.43% | 0.11%(+0.319)#33 | 0.29%(+0.143)#3,577 |
| 34. | Medora | 0.42% | 0.11%(+0.312)#34 | 0.29%(+0.136)#3,631 |
| 35. | Westville | 0.41% | 0.11%(+0.298)#35 | 0.29%(+0.122)#3,738 |
| 36. | Fishers | 0.39% | 0.11%(+0.282)#36 | 0.29%(+0.106)#3,868 |
| 37. | St John | 0.38% | 0.11%(+0.272)#37 | 0.29%(+0.096)#3,963 |
| 38. | New Chicago | 0.38% | 0.11%(+0.269)#38 | 0.29%(+0.094)#3,975 |
| 39. | Granger | 0.38% | 0.11%(+0.267)#39 | 0.29%(+0.091)#4,003 |
| 40. | Selma | 0.35% | 0.11%(+0.240)#40 | 0.29%(+0.064)#4,235 |
| 41. | Auburn | 0.34% | 0.11%(+0.228)#41 | 0.29%(+0.053)#4,325 |
| 42. | Lawrence | 0.33% | 0.11%(+0.218)#42 | 0.29%(+0.042)#4,427 |
| 43. | West Lafayette | 0.32% | 0.11%(+0.214)#43 | 0.29%(+0.038)#4,466 |
| 44. | Angola | 0.31% | 0.11%(+0.202)#44 | 0.29%(+0.026)#4,574 |
| 45. | Brownstown | 0.30% | 0.11%(+0.189)#45 | 0.29%(+0.013)#4,695 |
| 46. | Bloomington | 0.29% | 0.11%(+0.179)#46 | 0.29%(+0.003)#4,820 |
| 47. | Highland | 0.29% | 0.11%(+0.177)#47 | 0.29%(+0.001)#4,845 |
| 48. | Columbia City | 0.28% | 0.11%(+0.175)#48 | 0.29%(-0.001)#4,862 |
| 49. | Beech Grove | 0.28% | 0.11%(+0.167)#49 | 0.29%(-0.009)#4,929 |
| 50. | Portland | 0.26% | 0.11%(+0.155)#50 | 0.29%(-0.021)#5,071 |
| 51. | Seymour | 0.25% | 0.11%(+0.143)#51 | 0.29%(-0.033)#5,202 |
| 52. | Marengo | 0.25% | 0.11%(+0.141)#52 | 0.29%(-0.034)#5,221 |
| 53. | New Pekin | 0.25% | 0.11%(+0.136)#53 | 0.29%(-0.040)#5,294 |
| 54. | Zionsville | 0.24% | 0.11%(+0.130)#54 | 0.29%(-0.045)#5,343 |
| 55. | Lafayette | 0.24% | 0.11%(+0.129)#55 | 0.29%(-0.047)#5,366 |
| 56. | South Haven | 0.23% | 0.11%(+0.125)#56 | 0.29%(-0.050)#5,413 |
| 57. | Berne | 0.23% | 0.11%(+0.120)#57 | 0.29%(-0.056)#5,481 |
| 58. | Shipshewana | 0.23% | 0.11%(+0.120)#58 | 0.29%(-0.056)#5,482 |
| 59. | Brooklyn | 0.22% | 0.11%(+0.113)#59 | 0.29%(-0.063)#5,575 |
| 60. | Williams Creek | 0.22% | 0.11%(+0.113)#60 | 0.29%(-0.063)#5,579 |
| 61. | Munster | 0.22% | 0.11%(+0.110)#61 | 0.29%(-0.066)#5,624 |
| 62. | Shorewood Forest | 0.22% | 0.11%(+0.108)#62 | 0.29%(-0.068)#5,648 |
| 63. | Bloomfield | 0.21% | 0.11%(+0.104)#63 | 0.29%(-0.071)#5,688 |
| 64. | Valparaiso | 0.21% | 0.11%(+0.102)#64 | 0.29%(-0.074)#5,722 |
| 65. | Whiteland | 0.21% | 0.11%(+0.101)#65 | 0.29%(-0.075)#5,740 |
| 66. | Edgewood | 0.20% | 0.11%(+0.094)#66 | 0.29%(-0.082)#5,835 |
| 67. | Delphi | 0.20% | 0.11%(+0.091)#67 | 0.29%(-0.084)#5,869 |
| 68. | Monrovia | 0.19% | 0.11%(+0.081)#68 | 0.29%(-0.095)#6,023 |
| 69. | Mount Vernon | 0.19% | 0.11%(+0.076)#69 | 0.29%(-0.100)#6,105 |
| 70. | Wolcott | 0.18% | 0.11%(+0.075)#70 | 0.29%(-0.101)#6,122 |
| 71. | Cedar Lake | 0.18% | 0.11%(+0.073)#71 | 0.29%(-0.102)#6,141 |
| 72. | Brookston | 0.18% | 0.11%(+0.073)#72 | 0.29%(-0.103)#6,142 |
| 73. | Bluffton | 0.18% | 0.11%(+0.072)#73 | 0.29%(-0.104)#6,160 |
| 74. | South Bend | 0.18% | 0.11%(+0.068)#74 | 0.29%(-0.108)#6,220 |
| 75. | Lake Station | 0.17% | 0.11%(+0.063)#75 | 0.29%(-0.113)#6,290 |
| 76. | French Lick | 0.17% | 0.11%(+0.062)#76 | 0.29%(-0.114)#6,305 |
| 77. | Cicero | 0.17% | 0.11%(+0.059)#77 | 0.29%(-0.117)#6,361 |
| 78. | Bristol | 0.16% | 0.11%(+0.052)#78 | 0.29%(-0.124)#6,451 |
| 79. | Shelburn | 0.16% | 0.11%(+0.047)#79 | 0.29%(-0.129)#6,517 |
| 80. | La Porte | 0.16% | 0.11%(+0.047)#80 | 0.29%(-0.129)#6,522 |
| 81. | Princeton | 0.16% | 0.11%(+0.046)#81 | 0.29%(-0.130)#6,529 |
| 82. | Warren | 0.15% | 0.11%(+0.045)#82 | 0.29%(-0.130)#6,535 |
| 83. | Speedway | 0.15% | 0.11%(+0.044)#83 | 0.29%(-0.131)#6,545 |
| 84. | Holton | 0.15% | 0.11%(+0.044)#84 | 0.29%(-0.132)#6,558 |
| 85. | Westfield | 0.15% | 0.11%(+0.044)#85 | 0.29%(-0.132)#6,560 |
| 86. | Jeffersonville | 0.15% | 0.11%(+0.043)#86 | 0.29%(-0.133)#6,569 |
| 87. | Gas City | 0.15% | 0.11%(+0.038)#87 | 0.29%(-0.138)#6,633 |
| 88. | Bargersville | 0.15% | 0.11%(+0.038)#88 | 0.29%(-0.138)#6,643 |
| 89. | Southport | 0.14% | 0.11%(+0.034)#89 | 0.29%(-0.142)#6,692 |
| 90. | Odon | 0.14% | 0.11%(+0.029)#90 | 0.29%(-0.147)#6,759 |
| 91. | Rushville | 0.12% | 0.11%(+0.015)#91 | 0.29%(-0.161)#6,929 |
| 92. | Merrillville | 0.12% | 0.11%(+0.015)#92 | 0.29%(-0.161)#6,937 |
| 93. | Avon | 0.12% | 0.11%(+0.010)#93 | 0.29%(-0.166)#7,003 |
| 94. | Mooresville | 0.12% | 0.11%(+0.006)#94 | 0.29%(-0.170)#7,054 |
| 95. | Indianapolis | 0.11% | 0.11%(+0.005)#95 | 0.29%(-0.171)#7,072 |
| 96. | Peru | 0.11% | 0.11%(+0.001)#96 | 0.29%(-0.175)#7,120 |
| 97. | Elkhart | 0.11% | 0.11%(-0.002)#97 | 0.29%(-0.178)#7,160 |
| 98. | Chesterton | 0.11% | 0.11%(-0.004)#98 | 0.29%(-0.180)#7,200 |
| 99. | Shirley | 0.097% | 0.11%(-0.012)#99 | 0.29%(-0.188)#7,334 |
| 100. | Wabash | 0.096% | 0.11%(-0.014)#100 | 0.29%(-0.189)#7,348 |
Common Questions
What are the Top 10 Cities with the Highest Percentage of Immigrants from Northern Europe in Indiana?
Top 10 Cities with the Highest Percentage of Immigrants from Northern Europe in Indiana are:
#1
1.96%
#2
1.73%
#3
1.63%
#4
1.60%
#5
1.51%
#6
1.39%
#7
1.38%
#8
1.27%
#9
1.25%
#10
1.21%
What city has the Highest Percentage of Immigrants from Northern Europe in Indiana?
Memphis has the Highest Percentage of Immigrants from Northern Europe in Indiana with 1.96%.
What is the Percentage of Immigrants from Northern Europe in the State of Indiana?
Percentage of Immigrants from Northern Europe in Indiana is 0.11%.
What is the Percentage of Immigrants from Northern Europe in the United States?
Percentage of Immigrants from Northern Europe in the United States is 0.29%.