Cities with the Most Immigrants from Brazil in Maryland
RELATED REPORTS & OPTIONS
Brazil
Maryland
Compare Cities
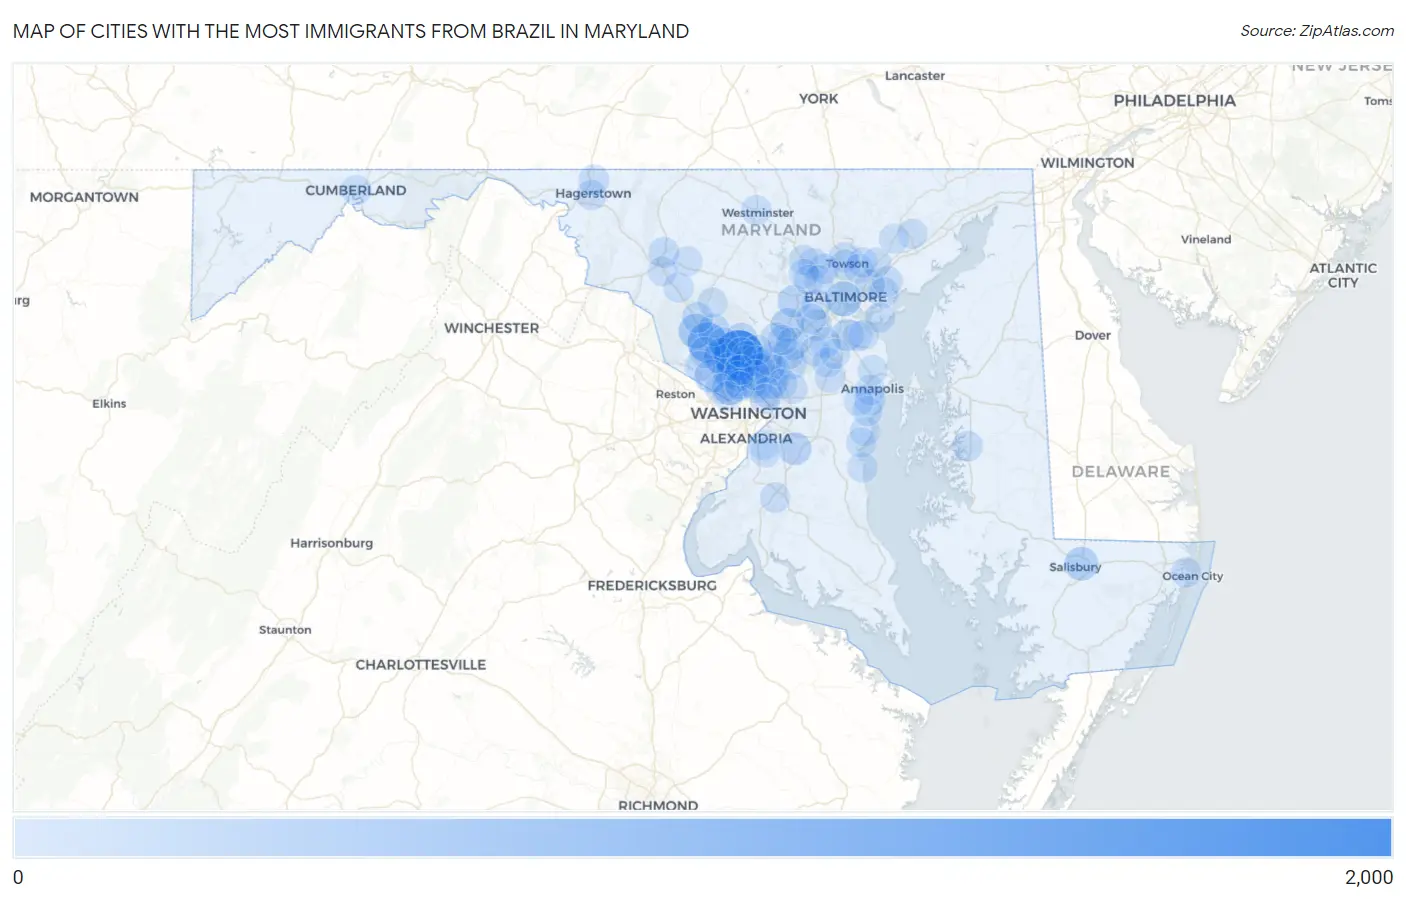
Map of Cities with the Most Immigrants from Brazil in Maryland
0
2,000
Cities with the Most Immigrants from Brazil in Maryland
| City | Brazil | vs State | vs National | |
| 1. | Aspen Hill | 1,812 | 11,980(15.13%)#1 | 552,373(0.33%)#36 |
| 2. | Gaithersburg | 885 | 11,980(7.39%)#2 | 552,373(0.16%)#73 |
| 3. | Rockville | 635 | 11,980(5.30%)#3 | 552,373(0.11%)#113 |
| 4. | Baltimore | 464 | 11,980(3.87%)#4 | 552,373(0.08%)#171 |
| 5. | North Bethesda | 449 | 11,980(3.75%)#5 | 552,373(0.08%)#178 |
| 6. | Germantown | 436 | 11,980(3.64%)#6 | 552,373(0.08%)#184 |
| 7. | Bethesda | 433 | 11,980(3.61%)#7 | 552,373(0.08%)#185 |
| 8. | Salisbury | 327 | 11,980(2.73%)#8 | 552,373(0.06%)#239 |
| 9. | Columbia | 311 | 11,980(2.60%)#9 | 552,373(0.06%)#254 |
| 10. | Wheaton | 285 | 11,980(2.38%)#10 | 552,373(0.05%)#276 |
| 11. | Potomac | 284 | 11,980(2.37%)#11 | 552,373(0.05%)#278 |
| 12. | College Park | 260 | 11,980(2.17%)#12 | 552,373(0.05%)#305 |
| 13. | Rosaryville | 254 | 11,980(2.12%)#13 | 552,373(0.05%)#314 |
| 14. | Calverton | 251 | 11,980(2.10%)#14 | 552,373(0.05%)#321 |
| 15. | North Laurel | 223 | 11,980(1.86%)#15 | 552,373(0.04%)#359 |
| 16. | Ellicott City | 211 | 11,980(1.76%)#16 | 552,373(0.04%)#378 |
| 17. | Montgomery Village | 194 | 11,980(1.62%)#17 | 552,373(0.04%)#404 |
| 18. | Glen Burnie | 184 | 11,980(1.54%)#18 | 552,373(0.03%)#416 |
| 19. | Olney | 172 | 11,980(1.44%)#19 | 552,373(0.03%)#443 |
| 20. | Glenmont | 139 | 11,980(1.16%)#20 | 552,373(0.03%)#534 |
| 21. | Elkridge | 128 | 11,980(1.07%)#21 | 552,373(0.02%)#575 |
| 22. | Silver Spring | 120 | 11,980(1.00%)#22 | 552,373(0.02%)#619 |
| 23. | South Laurel | 101 | 11,980(0.84%)#23 | 552,373(0.02%)#699 |
| 24. | North Potomac | 99 | 11,980(0.83%)#24 | 552,373(0.02%)#710 |
| 25. | Garrison | 97 | 11,980(0.81%)#25 | 552,373(0.02%)#727 |
| 26. | Frederick | 96 | 11,980(0.80%)#26 | 552,373(0.02%)#731 |
| 27. | Annapolis Neck | 94 | 11,980(0.78%)#27 | 552,373(0.02%)#744 |
| 28. | Clarksburg | 84 | 11,980(0.70%)#28 | 552,373(0.02%)#799 |
| 29. | Layhill | 83 | 11,980(0.69%)#29 | 552,373(0.02%)#812 |
| 30. | Laurel | 81 | 11,980(0.68%)#30 | 552,373(0.01%)#822 |
| 31. | Severn | 79 | 11,980(0.66%)#31 | 552,373(0.01%)#833 |
| 32. | Towson | 74 | 11,980(0.62%)#32 | 552,373(0.01%)#881 |
| 33. | Easton | 74 | 11,980(0.62%)#33 | 552,373(0.01%)#884 |
| 34. | Fountainhead Orchard Hills | 66 | 11,980(0.55%)#34 | 552,373(0.01%)#964 |
| 35. | Essex | 59 | 11,980(0.49%)#35 | 552,373(0.01%)#1,038 |
| 36. | Middle River | 59 | 11,980(0.49%)#36 | 552,373(0.01%)#1,039 |
| 37. | Flower Hill | 59 | 11,980(0.49%)#37 | 552,373(0.01%)#1,041 |
| 38. | Chevy Chase | 59 | 11,980(0.49%)#38 | 552,373(0.01%)#1,046 |
| 39. | Takoma Park | 58 | 11,980(0.48%)#39 | 552,373(0.01%)#1,058 |
| 40. | Beltsville | 57 | 11,980(0.48%)#40 | 552,373(0.01%)#1,077 |
| 41. | Colesville | 57 | 11,980(0.48%)#41 | 552,373(0.01%)#1,082 |
| 42. | White Oak | 54 | 11,980(0.45%)#42 | 552,373(0.01%)#1,115 |
| 43. | Hyattsville | 47 | 11,980(0.39%)#43 | 552,373(0.01%)#1,216 |
| 44. | Rosedale | 47 | 11,980(0.39%)#44 | 552,373(0.01%)#1,218 |
| 45. | Pikesville | 45 | 11,980(0.38%)#45 | 552,373(0.01%)#1,249 |
| 46. | Crofton | 44 | 11,980(0.37%)#46 | 552,373(0.01%)#1,264 |
| 47. | Seabrook | 43 | 11,980(0.36%)#47 | 552,373(0.01%)#1,282 |
| 48. | Hagerstown | 41 | 11,980(0.34%)#48 | 552,373(0.01%)#1,318 |
| 49. | Fairland | 39 | 11,980(0.33%)#49 | 552,373(0.01%)#1,353 |
| 50. | Redland | 35 | 11,980(0.29%)#50 | 552,373(0.01%)#1,463 |
| 51. | Catonsville | 34 | 11,980(0.28%)#51 | 552,373(0.01%)#1,478 |
| 52. | South Kensington | 33 | 11,980(0.28%)#52 | 552,373(0.01%)#1,530 |
| 53. | Greenbelt | 32 | 11,980(0.27%)#53 | 552,373(0.01%)#1,552 |
| 54. | Fulton | 32 | 11,980(0.27%)#54 | 552,373(0.01%)#1,569 |
| 55. | Owings Mills | 31 | 11,980(0.26%)#55 | 552,373(0.01%)#1,579 |
| 56. | Cloverly | 31 | 11,980(0.26%)#56 | 552,373(0.01%)#1,589 |
| 57. | Riviera Beach | 28 | 11,980(0.23%)#57 | 552,373(0.01%)#1,677 |
| 58. | Travilah | 28 | 11,980(0.23%)#58 | 552,373(0.01%)#1,680 |
| 59. | Cabin John | 27 | 11,980(0.23%)#59 | 552,373(0.00%)#1,731 |
| 60. | Waldorf | 26 | 11,980(0.22%)#60 | 552,373(0.00%)#1,738 |
| 61. | Annapolis | 26 | 11,980(0.22%)#61 | 552,373(0.00%)#1,743 |
| 62. | Urbana | 26 | 11,980(0.22%)#62 | 552,373(0.00%)#1,755 |
| 63. | Lutherville | 26 | 11,980(0.22%)#63 | 552,373(0.00%)#1,767 |
| 64. | Fort Meade | 25 | 11,980(0.21%)#64 | 552,373(0.00%)#1,800 |
| 65. | Burnt Mills | 24 | 11,980(0.20%)#65 | 552,373(0.00%)#1,843 |
| 66. | Carney | 23 | 11,980(0.19%)#66 | 552,373(0.00%)#1,860 |
| 67. | Scaggsville | 23 | 11,980(0.19%)#67 | 552,373(0.00%)#1,881 |
| 68. | Odenton | 21 | 11,980(0.18%)#68 | 552,373(0.00%)#1,954 |
| 69. | Ilchester | 21 | 11,980(0.18%)#69 | 552,373(0.00%)#1,962 |
| 70. | Bel Air South | 20 | 11,980(0.17%)#70 | 552,373(0.00%)#2,000 |
| 71. | Four Corners | 19 | 11,980(0.16%)#71 | 552,373(0.00%)#2,084 |
| 72. | Arnold | 18 | 11,980(0.15%)#72 | 552,373(0.00%)#2,115 |
| 73. | Cumberland | 18 | 11,980(0.15%)#73 | 552,373(0.00%)#2,121 |
| 74. | Edgemere | 18 | 11,980(0.15%)#74 | 552,373(0.00%)#2,135 |
| 75. | North Kensington | 18 | 11,980(0.15%)#75 | 552,373(0.00%)#2,137 |
| 76. | Westminster | 17 | 11,980(0.14%)#76 | 552,373(0.00%)#2,180 |
| 77. | West Ocean City | 17 | 11,980(0.14%)#77 | 552,373(0.00%)#2,198 |
| 78. | Mount Rainier | 16 | 11,980(0.13%)#78 | 552,373(0.00%)#2,245 |
| 79. | Pasadena | 15 | 11,980(0.13%)#79 | 552,373(0.00%)#2,281 |
| 80. | Linganore | 14 | 11,980(0.12%)#80 | 552,373(0.00%)#2,384 |
| 81. | Shady Side | 14 | 11,980(0.12%)#81 | 552,373(0.00%)#2,405 |
| 82. | Damascus | 13 | 11,980(0.11%)#82 | 552,373(0.00%)#2,447 |
| 83. | Mayo | 13 | 11,980(0.11%)#83 | 552,373(0.00%)#2,466 |
| 84. | North Beach | 13 | 11,980(0.11%)#84 | 552,373(0.00%)#2,480 |
| 85. | Parkville | 12 | 11,980(0.10%)#85 | 552,373(0.00%)#2,507 |
| 86. | Ballenger Creek | 12 | 11,980(0.10%)#86 | 552,373(0.00%)#2,512 |
| 87. | Green Valley | 12 | 11,980(0.10%)#87 | 552,373(0.00%)#2,526 |
| 88. | Leisure World | 12 | 11,980(0.10%)#88 | 552,373(0.00%)#2,537 |
| 89. | Brookmont | 12 | 11,980(0.10%)#89 | 552,373(0.00%)#2,550 |
| 90. | Perry Hall | 10 | 11,980(0.08%)#90 | 552,373(0.00%)#2,668 |
| 91. | Pleasant Hills | 10 | 11,980(0.08%)#91 | 552,373(0.00%)#2,724 |
| 92. | Oxon Hill | 9 | 11,980(0.08%)#92 | 552,373(0.00%)#2,768 |
| 93. | Deale | 9 | 11,980(0.08%)#93 | 552,373(0.00%)#2,812 |
| 94. | Gambrills | 9 | 11,980(0.08%)#94 | 552,373(0.00%)#2,829 |
| 95. | Milford Mill | 8 | 11,980(0.07%)#95 | 552,373(0.00%)#2,859 |
| 96. | Edgewater | 8 | 11,980(0.07%)#96 | 552,373(0.00%)#2,889 |
| 97. | Randallstown | 7 | 11,980(0.06%)#97 | 552,373(0.00%)#2,941 |
| 98. | Lochearn | 7 | 11,980(0.06%)#98 | 552,373(0.00%)#2,945 |
| 99. | Friendly | 7 | 11,980(0.06%)#99 | 552,373(0.00%)#2,963 |
| 100. | Chevy Chase Section Five | 7 | 11,980(0.06%)#100 | 552,373(0.00%)#3,017 |
Common Questions
What are the Top 10 Cities with the Most Immigrants from Brazil in Maryland?
Top 10 Cities with the Most Immigrants from Brazil in Maryland are:
#1
1,812
#2
885
#3
635
#4
464
#5
449
#6
436
#7
433
#8
327
#9
311
#10
285
What city has the Most Immigrants from Brazil in Maryland?
Aspen Hill has the Most Immigrants from Brazil in Maryland with 1,812.
What is the Total Immigrants from Brazil in the State of Maryland?
Total Immigrants from Brazil in Maryland is 11,980.
What is the Total Immigrants from Brazil in the United States?
Total Immigrants from Brazil in the United States is 552,373.