Cities with the Highest Percentage of Immigrants from Dominican Republic in Maryland
RELATED REPORTS & OPTIONS
Dominican Republic
Maryland
Compare Cities
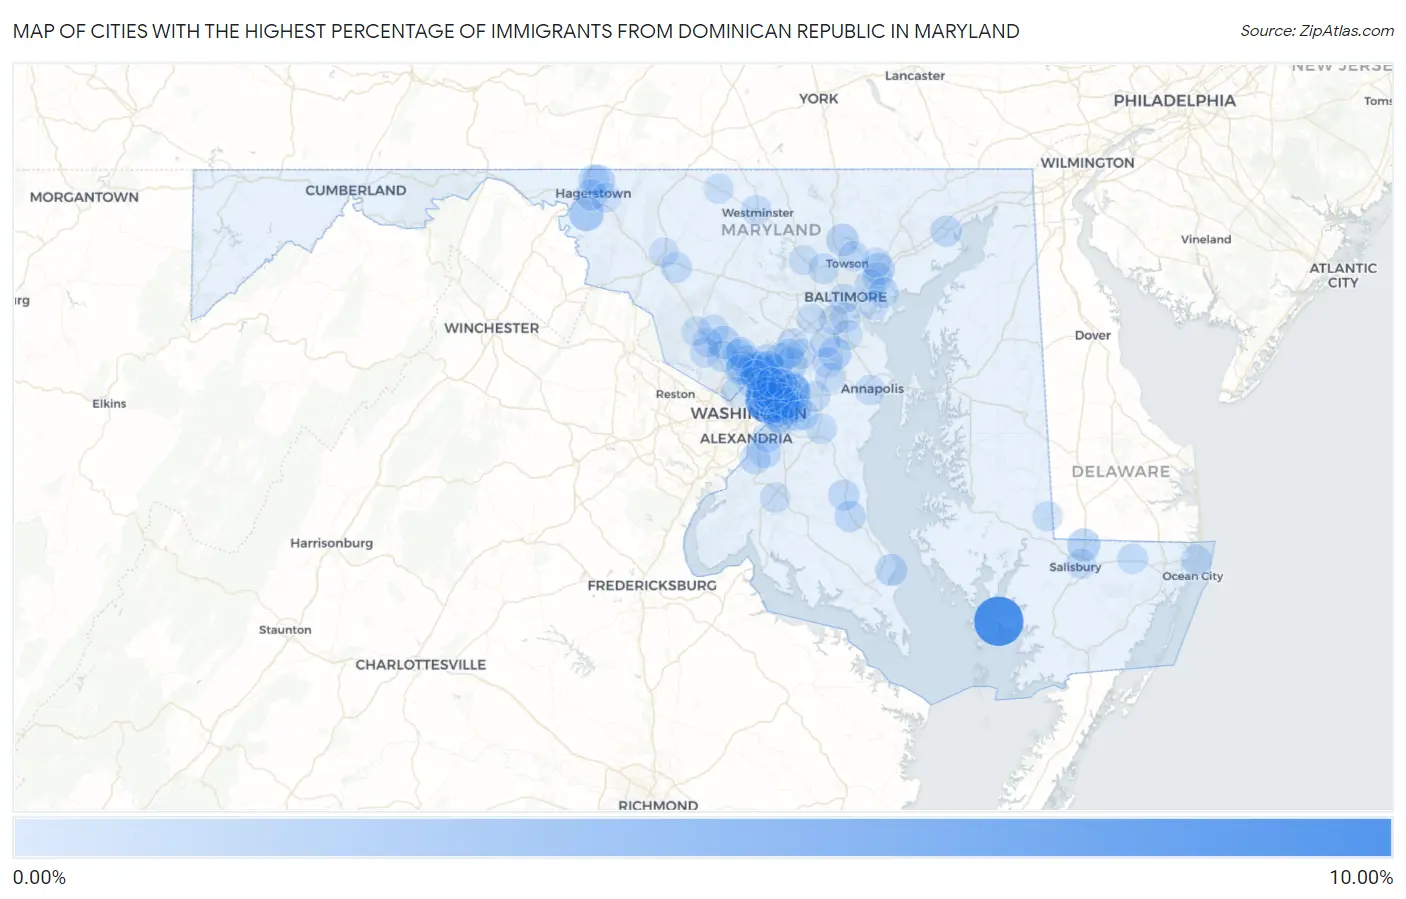
Map of Cities with the Highest Percentage of Immigrants from Dominican Republic in Maryland
0.00%
10.00%
Cities with the Highest Percentage of Immigrants from Dominican Republic in Maryland
| City | Dominican Republic | vs State | vs National | |
| 1. | Chance | 8.24% | 0.23%(+8.01)#-1 | 0.37%(+7.87)#0 |
| 2. | Cottage City | 7.09% | 0.23%(+6.86)#0 | 0.37%(+6.72)#1 |
| 3. | Lanham | 2.74% | 0.23%(+2.52)#1 | 0.37%(+2.37)#2 |
| 4. | Mount Rainier | 2.74% | 0.23%(+2.51)#2 | 0.37%(+2.37)#3 |
| 5. | Hillandale | 2.70% | 0.23%(+2.47)#3 | 0.37%(+2.33)#4 |
| 6. | New Carrollton | 2.25% | 0.23%(+2.03)#4 | 0.37%(+1.88)#5 |
| 7. | St James | 2.09% | 0.23%(+1.87)#5 | 0.37%(+1.73)#6 |
| 8. | White Oak | 1.87% | 0.23%(+1.65)#6 | 0.37%(+1.50)#7 |
| 9. | East Riverdale | 1.74% | 0.23%(+1.52)#7 | 0.37%(+1.37)#8 |
| 10. | Adelphi | 1.51% | 0.23%(+1.28)#8 | 0.37%(+1.14)#9 |
| 11. | Seabrook | 1.40% | 0.23%(+1.17)#9 | 0.37%(+1.03)#10 |
| 12. | Redland | 1.34% | 0.23%(+1.11)#10 | 0.37%(+0.966)#11 |
| 13. | Chillum | 1.33% | 0.23%(+1.10)#11 | 0.37%(+0.962)#12 |
| 14. | Delmar | 1.31% | 0.23%(+1.08)#12 | 0.37%(+0.939)#13 |
| 15. | Landover | 1.31% | 0.23%(+1.08)#13 | 0.37%(+0.936)#14 |
| 16. | Beltsville | 1.28% | 0.23%(+1.06)#14 | 0.37%(+0.915)#15 |
| 17. | Gambrills | 1.25% | 0.23%(+1.03)#15 | 0.37%(+0.884)#16 |
| 18. | Summerfield | 1.22% | 0.23%(+0.991)#16 | 0.37%(+0.848)#17 |
| 19. | Paramount Long Meadow | 1.14% | 0.23%(+0.919)#17 | 0.37%(+0.775)#18 |
| 20. | Kemp Mill | 1.14% | 0.23%(+0.916)#18 | 0.37%(+0.773)#19 |
| 21. | Cockeysville | 1.11% | 0.23%(+0.884)#19 | 0.37%(+0.740)#20 |
| 22. | Fairmount Heights | 1.07% | 0.23%(+0.847)#20 | 0.37%(+0.704)#21 |
| 23. | Brentwood | 1.06% | 0.23%(+0.831)#21 | 0.37%(+0.688)#22 |
| 24. | Wheaton | 1.04% | 0.23%(+0.810)#22 | 0.37%(+0.667)#23 |
| 25. | Glenmont | 0.99% | 0.23%(+0.766)#23 | 0.37%(+0.623)#24 |
| 26. | South Laurel | 0.94% | 0.23%(+0.713)#24 | 0.37%(+0.570)#25 |
| 27. | Chesapeake Ranch Estates | 0.92% | 0.23%(+0.692)#25 | 0.37%(+0.549)#26 |
| 28. | Riverdale Park | 0.88% | 0.23%(+0.652)#26 | 0.37%(+0.509)#27 |
| 29. | Edmonston | 0.80% | 0.23%(+0.573)#27 | 0.37%(+0.430)#28 |
| 30. | White Marsh | 0.79% | 0.23%(+0.567)#28 | 0.37%(+0.424)#29 |
| 31. | North Brentwood | 0.78% | 0.23%(+0.557)#29 | 0.37%(+0.414)#30 |
| 32. | Fairland | 0.78% | 0.23%(+0.555)#30 | 0.37%(+0.412)#31 |
| 33. | Hagerstown | 0.72% | 0.23%(+0.495)#31 | 0.37%(+0.352)#32 |
| 34. | Friendly | 0.71% | 0.23%(+0.488)#32 | 0.37%(+0.345)#33 |
| 35. | Huntingtown | 0.67% | 0.23%(+0.446)#33 | 0.37%(+0.303)#34 |
| 36. | Berwyn Heights | 0.66% | 0.23%(+0.438)#34 | 0.37%(+0.295)#35 |
| 37. | Walker Mill | 0.66% | 0.23%(+0.435)#35 | 0.37%(+0.292)#36 |
| 38. | Landover Hills | 0.66% | 0.23%(+0.435)#36 | 0.37%(+0.292)#37 |
| 39. | Fort Washington | 0.65% | 0.23%(+0.428)#37 | 0.37%(+0.285)#38 |
| 40. | Aberdeen | 0.65% | 0.23%(+0.425)#38 | 0.37%(+0.282)#39 |
| 41. | Prince Frederick | 0.64% | 0.23%(+0.416)#39 | 0.37%(+0.273)#40 |
| 42. | Konterra | 0.61% | 0.23%(+0.386)#40 | 0.37%(+0.243)#41 |
| 43. | Aspen Hill | 0.61% | 0.23%(+0.382)#41 | 0.37%(+0.239)#42 |
| 44. | Ten Mile Creek | 0.61% | 0.23%(+0.379)#42 | 0.37%(+0.236)#43 |
| 45. | Rockville | 0.59% | 0.23%(+0.366)#43 | 0.37%(+0.223)#44 |
| 46. | Bartonsville | 0.59% | 0.23%(+0.364)#44 | 0.37%(+0.220)#45 |
| 47. | Calverton | 0.58% | 0.23%(+0.352)#45 | 0.37%(+0.209)#46 |
| 48. | Flower Hill | 0.53% | 0.23%(+0.300)#46 | 0.37%(+0.157)#47 |
| 49. | Leisure World | 0.51% | 0.23%(+0.286)#47 | 0.37%(+0.143)#48 |
| 50. | Fountainhead Orchard Hills | 0.50% | 0.23%(+0.274)#48 | 0.37%(+0.131)#49 |
| 51. | Rosedale | 0.49% | 0.23%(+0.267)#49 | 0.37%(+0.124)#50 |
| 52. | North Laurel | 0.48% | 0.23%(+0.257)#50 | 0.37%(+0.114)#51 |
| 53. | Ocean City | 0.48% | 0.23%(+0.253)#51 | 0.37%(+0.110)#52 |
| 54. | Marlboro Meadows | 0.48% | 0.23%(+0.253)#52 | 0.37%(+0.110)#53 |
| 55. | Pikesville | 0.44% | 0.23%(+0.211)#53 | 0.37%(+0.067)#54 |
| 56. | Silver Spring | 0.44% | 0.23%(+0.209)#54 | 0.37%(+0.066)#55 |
| 57. | Hyattsville | 0.43% | 0.23%(+0.200)#55 | 0.37%(+0.057)#56 |
| 58. | Langley Park | 0.42% | 0.23%(+0.196)#56 | 0.37%(+0.053)#57 |
| 59. | Friendship Heights Village | 0.42% | 0.23%(+0.191)#57 | 0.37%(+0.048)#58 |
| 60. | Lake Arbor | 0.42% | 0.23%(+0.190)#58 | 0.37%(+0.047)#59 |
| 61. | Odenton | 0.41% | 0.23%(+0.187)#59 | 0.37%(+0.044)#60 |
| 62. | North Kensington | 0.41% | 0.23%(+0.187)#60 | 0.37%(+0.044)#61 |
| 63. | Rossville | 0.41% | 0.23%(+0.186)#61 | 0.37%(+0.043)#62 |
| 64. | Capitol Heights | 0.40% | 0.23%(+0.170)#62 | 0.37%(+0.027)#63 |
| 65. | Hampton | 0.39% | 0.23%(+0.167)#63 | 0.37%(+0.024)#64 |
| 66. | Essex | 0.39% | 0.23%(+0.161)#64 | 0.37%(+0.017)#65 |
| 67. | Glenarden | 0.38% | 0.23%(+0.152)#65 | 0.37%(+0.009)#66 |
| 68. | Bowie | 0.35% | 0.23%(+0.126)#66 | 0.37%(-0.017)#67 |
| 69. | Willards | 0.34% | 0.23%(+0.118)#67 | 0.37%(-0.025)#68 |
| 70. | Brooklyn Park | 0.34% | 0.23%(+0.113)#68 | 0.37%(-0.030)#69 |
| 71. | Salisbury | 0.34% | 0.23%(+0.110)#69 | 0.37%(-0.033)#70 |
| 72. | Maryland City | 0.31% | 0.23%(+0.084)#70 | 0.37%(-0.059)#71 |
| 73. | Montgomery Village | 0.31% | 0.23%(+0.079)#71 | 0.37%(-0.064)#72 |
| 74. | Severn | 0.27% | 0.23%(+0.043)#72 | 0.37%(-0.100)#73 |
| 75. | Waldorf | 0.27% | 0.23%(+0.041)#73 | 0.37%(-0.102)#74 |
| 76. | Sharptown | 0.27% | 0.23%(+0.039)#74 | 0.37%(-0.104)#75 |
| 77. | Largo | 0.25% | 0.23%(+0.020)#75 | 0.37%(-0.123)#76 |
| 78. | Temple Hills | 0.24% | 0.23%(+0.014)#76 | 0.37%(-0.129)#77 |
| 79. | Laurel | 0.24% | 0.23%(+0.010)#77 | 0.37%(-0.133)#78 |
| 80. | Kettering | 0.22% | 0.23%(-0.003)#78 | 0.37%(-0.146)#79 |
| 81. | North Potomac | 0.22% | 0.23%(-0.004)#79 | 0.37%(-0.147)#80 |
| 82. | Baltimore | 0.22% | 0.23%(-0.007)#80 | 0.37%(-0.150)#81 |
| 83. | Woodlawn Cdp Baltimore County | 0.22% | 0.23%(-0.009)#81 | 0.37%(-0.152)#82 |
| 84. | Annapolis | 0.22% | 0.23%(-0.010)#82 | 0.37%(-0.153)#83 |
| 85. | Greenbelt | 0.22% | 0.23%(-0.011)#83 | 0.37%(-0.154)#84 |
| 86. | Westminster | 0.21% | 0.23%(-0.017)#84 | 0.37%(-0.161)#85 |
| 87. | Four Corners | 0.21% | 0.23%(-0.020)#85 | 0.37%(-0.163)#86 |
| 88. | Glen Burnie | 0.20% | 0.23%(-0.028)#86 | 0.37%(-0.171)#87 |
| 89. | Dundalk | 0.19% | 0.23%(-0.033)#87 | 0.37%(-0.176)#88 |
| 90. | Gaithersburg | 0.19% | 0.23%(-0.037)#88 | 0.37%(-0.180)#89 |
| 91. | Crofton | 0.17% | 0.23%(-0.053)#89 | 0.37%(-0.196)#90 |
| 92. | Germantown | 0.17% | 0.23%(-0.059)#90 | 0.37%(-0.202)#91 |
| 93. | Taneytown | 0.17% | 0.23%(-0.060)#91 | 0.37%(-0.204)#92 |
| 94. | Linthicum | 0.16% | 0.23%(-0.068)#92 | 0.37%(-0.211)#93 |
| 95. | Perry Hall | 0.15% | 0.23%(-0.073)#93 | 0.37%(-0.216)#94 |
| 96. | Ilchester | 0.15% | 0.23%(-0.076)#94 | 0.37%(-0.219)#95 |
| 97. | Frederick | 0.15% | 0.23%(-0.081)#95 | 0.37%(-0.224)#96 |
| 98. | College Park | 0.15% | 0.23%(-0.081)#96 | 0.37%(-0.224)#97 |
| 99. | Owings Mills | 0.14% | 0.23%(-0.086)#97 | 0.37%(-0.229)#98 |
| 100. | Robinwood | 0.14% | 0.23%(-0.089)#98 | 0.37%(-0.232)#99 |
Common Questions
What are the Top 10 Cities with the Highest Percentage of Immigrants from Dominican Republic in Maryland?
Top 10 Cities with the Highest Percentage of Immigrants from Dominican Republic in Maryland are:
#1
8.24%
#2
7.09%
#3
2.74%
#4
2.74%
#5
2.70%
#6
2.25%
#7
2.09%
#8
1.87%
#9
1.74%
#10
1.51%
What city has the Highest Percentage of Immigrants from Dominican Republic in Maryland?
Chance has the Highest Percentage of Immigrants from Dominican Republic in Maryland with 8.24%.
What is the Percentage of Immigrants from Dominican Republic in the State of Maryland?
Percentage of Immigrants from Dominican Republic in Maryland is 0.23%.
What is the Percentage of Immigrants from Dominican Republic in the United States?
Percentage of Immigrants from Dominican Republic in the United States is 0.37%.