Cities with the Highest Percentage of Mexican American Indian Population in Maryland
RELATED REPORTS & OPTIONS
Mexican American Indian
Maryland
Compare Cities
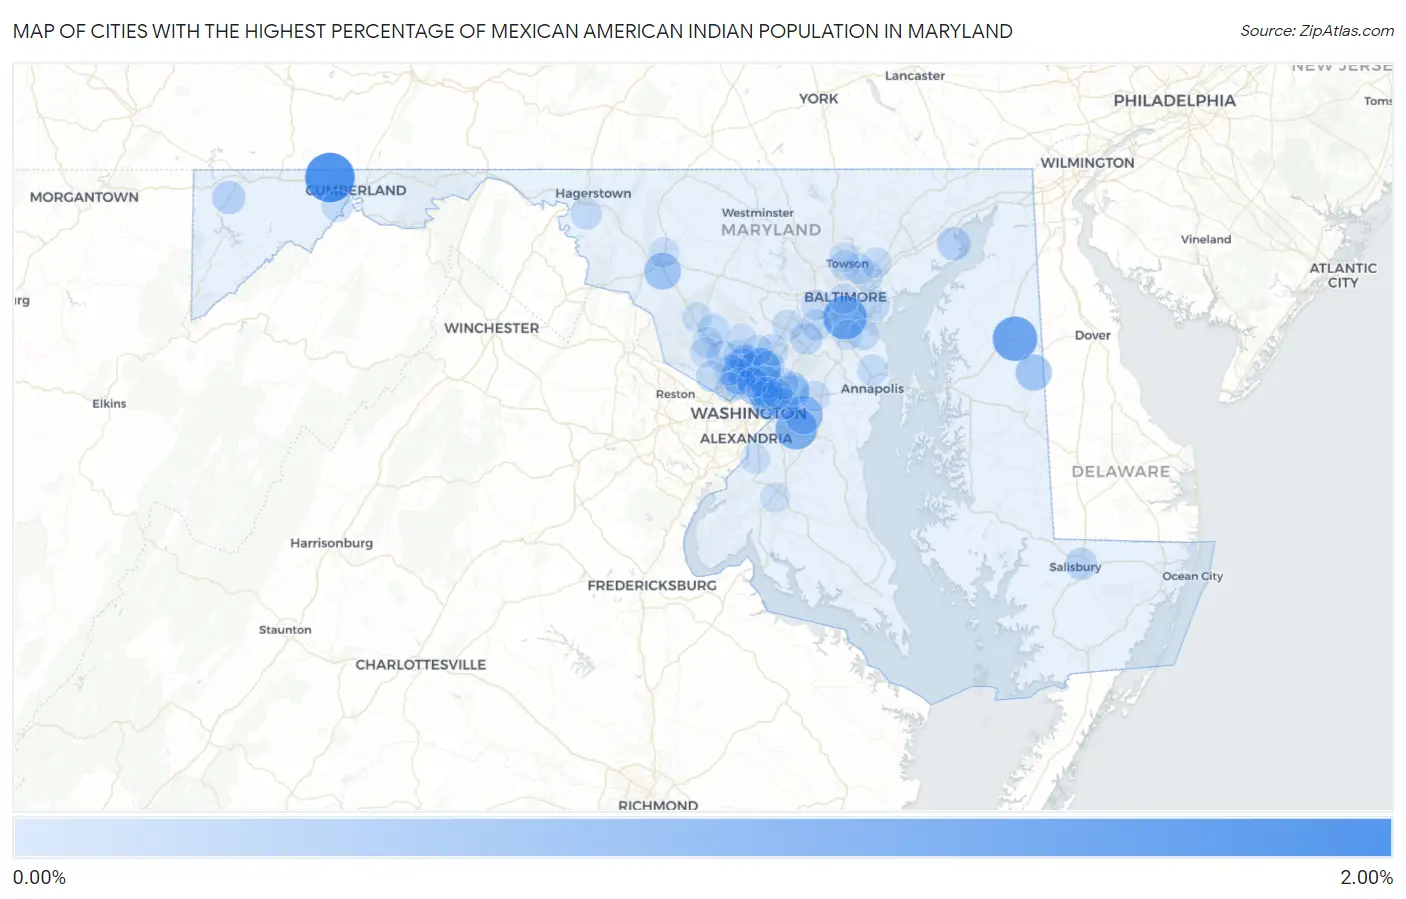
Map of Cities with the Highest Percentage of Mexican American Indian Population in Maryland
0.00%
2.00%
Cities with the Highest Percentage of Mexican American Indian Population in Maryland
| City | Mexican American Indian | vs State | vs National | |
| 1. | Mount Savage | 1.55% | 0.046%(+1.50)#1 | 0.16%(+1.39)#339 |
| 2. | Barclay | 1.14% | 0.046%(+1.10)#2 | 0.16%(+0.987)#487 |
| 3. | Brooklyn Park | 1.07% | 0.046%(+1.02)#3 | 0.16%(+0.913)#528 |
| 4. | Westphalia | 0.90% | 0.046%(+0.851)#4 | 0.16%(+0.741)#641 |
| 5. | White Oak | 0.87% | 0.046%(+0.825)#5 | 0.16%(+0.715)#658 |
| 6. | Kettering | 0.62% | 0.046%(+0.574)#6 | 0.16%(+0.464)#908 |
| 7. | Wheaton | 0.58% | 0.046%(+0.535)#7 | 0.16%(+0.425)#958 |
| 8. | Ballenger Creek | 0.53% | 0.046%(+0.484)#8 | 0.16%(+0.374)#1,033 |
| 9. | Goldsboro | 0.47% | 0.046%(+0.428)#9 | 0.16%(+0.318)#1,132 |
| 10. | Takoma Park | 0.46% | 0.046%(+0.410)#10 | 0.16%(+0.300)#1,177 |
| 11. | Brentwood | 0.45% | 0.046%(+0.403)#11 | 0.16%(+0.293)#1,192 |
| 12. | Chevy Chase View | 0.45% | 0.046%(+0.399)#12 | 0.16%(+0.289)#1,209 |
| 13. | Colmar Manor | 0.40% | 0.046%(+0.349)#13 | 0.16%(+0.240)#1,293 |
| 14. | Lanham | 0.31% | 0.046%(+0.262)#14 | 0.16%(+0.152)#1,509 |
| 15. | Seabrook | 0.28% | 0.046%(+0.232)#15 | 0.16%(+0.123)#1,578 |
| 16. | Aberdeen Proving Ground | 0.26% | 0.046%(+0.213)#16 | 0.16%(+0.103)#1,648 |
| 17. | Accident | 0.26% | 0.046%(+0.209)#17 | 0.16%(+0.100)#1,661 |
| 18. | Glenmont | 0.25% | 0.046%(+0.206)#18 | 0.16%(+0.096)#1,667 |
| 19. | Adelphi | 0.18% | 0.046%(+0.137)#19 | 0.16%(+0.027)#1,969 |
| 20. | Jessup | 0.17% | 0.046%(+0.120)#20 | 0.16%(+0.010)#2,049 |
| 21. | Salisbury | 0.16% | 0.046%(+0.114)#21 | 0.16%(+0.005)#2,079 |
| 22. | Landover | 0.16% | 0.046%(+0.113)#22 | 0.16%(+0.003)#2,089 |
| 23. | Burtonsville | 0.16% | 0.046%(+0.109)#23 | 0.16%(-0.001)#2,115 |
| 24. | Greenbelt | 0.14% | 0.046%(+0.096)#24 | 0.16%(-0.014)#2,184 |
| 25. | Dundalk | 0.14% | 0.046%(+0.089)#25 | 0.16%(-0.021)#2,218 |
| 26. | St James | 0.12% | 0.046%(+0.075)#26 | 0.16%(-0.034)#2,289 |
| 27. | Montgomery Village | 0.11% | 0.046%(+0.066)#27 | 0.16%(-0.044)#2,339 |
| 28. | Cresaptown | 0.11% | 0.046%(+0.059)#28 | 0.16%(-0.051)#2,385 |
| 29. | Chevy Chase | 0.10% | 0.046%(+0.056)#29 | 0.16%(-0.054)#2,409 |
| 30. | Chillum | 0.092% | 0.046%(+0.046)#30 | 0.16%(-0.064)#2,474 |
| 31. | Elkridge | 0.087% | 0.046%(+0.041)#31 | 0.16%(-0.069)#2,504 |
| 32. | Arnold | 0.085% | 0.046%(+0.038)#32 | 0.16%(-0.072)#2,534 |
| 33. | Rockville | 0.083% | 0.046%(+0.037)#33 | 0.16%(-0.073)#2,548 |
| 34. | Riviera Beach | 0.083% | 0.046%(+0.036)#34 | 0.16%(-0.074)#2,553 |
| 35. | Calverton | 0.082% | 0.046%(+0.036)#35 | 0.16%(-0.074)#2,563 |
| 36. | Overlea | 0.078% | 0.046%(+0.032)#36 | 0.16%(-0.078)#2,590 |
| 37. | Hyattsville | 0.077% | 0.046%(+0.030)#37 | 0.16%(-0.079)#2,602 |
| 38. | North Bethesda | 0.074% | 0.046%(+0.028)#38 | 0.16%(-0.082)#2,622 |
| 39. | Columbia | 0.067% | 0.046%(+0.020)#39 | 0.16%(-0.090)#2,682 |
| 40. | Perry Hall | 0.065% | 0.046%(+0.019)#40 | 0.16%(-0.091)#2,693 |
| 41. | Potomac | 0.062% | 0.046%(+0.016)#41 | 0.16%(-0.094)#2,709 |
| 42. | Gaithersburg | 0.058% | 0.046%(+0.012)#42 | 0.16%(-0.098)#2,742 |
| 43. | Parkville | 0.052% | 0.046%(+0.006)#43 | 0.16%(-0.104)#2,787 |
| 44. | Towson | 0.049% | 0.046%(+0.002)#44 | 0.16%(-0.108)#2,810 |
| 45. | Fort Washington | 0.043% | 0.046%(-0.004)#45 | 0.16%(-0.114)#2,862 |
| 46. | Bethesda | 0.042% | 0.046%(-0.004)#46 | 0.16%(-0.114)#2,865 |
| 47. | Baltimore | 0.042% | 0.046%(-0.005)#47 | 0.16%(-0.115)#2,869 |
| 48. | Catonsville | 0.040% | 0.046%(-0.007)#48 | 0.16%(-0.116)#2,879 |
| 49. | Aspen Hill | 0.037% | 0.046%(-0.009)#49 | 0.16%(-0.119)#2,905 |
| 50. | Silver Spring | 0.037% | 0.046%(-0.010)#50 | 0.16%(-0.120)#2,907 |
| 51. | Frederick | 0.036% | 0.046%(-0.011)#51 | 0.16%(-0.120)#2,913 |
| 52. | East Riverdale | 0.033% | 0.046%(-0.013)#52 | 0.16%(-0.123)#2,938 |
| 53. | Bowie | 0.031% | 0.046%(-0.015)#53 | 0.16%(-0.125)#2,959 |
| 54. | Cloverly | 0.030% | 0.046%(-0.016)#54 | 0.16%(-0.126)#2,969 |
| 55. | Olney | 0.025% | 0.046%(-0.021)#55 | 0.16%(-0.131)#3,019 |
| 56. | Clarksburg | 0.025% | 0.046%(-0.022)#56 | 0.16%(-0.132)#3,027 |
| 57. | North Potomac | 0.024% | 0.046%(-0.022)#57 | 0.16%(-0.132)#3,030 |
| 58. | Glen Burnie | 0.024% | 0.046%(-0.023)#58 | 0.16%(-0.132)#3,040 |
| 59. | Waldorf | 0.017% | 0.046%(-0.029)#59 | 0.16%(-0.139)#3,109 |
| 60. | Lutherville | 0.015% | 0.046%(-0.031)#60 | 0.16%(-0.141)#3,136 |
Common Questions
What are the Top 10 Cities with the Highest Percentage of Mexican American Indian Population in Maryland?
Top 10 Cities with the Highest Percentage of Mexican American Indian Population in Maryland are:
#1
1.55%
#2
1.14%
#3
1.07%
#4
0.90%
#5
0.87%
#6
0.62%
#7
0.58%
#8
0.53%
#9
0.47%
#10
0.46%
What city has the Highest Percentage of Mexican American Indian Population in Maryland?
Mount Savage has the Highest Percentage of Mexican American Indian Population in Maryland with 1.55%.
What is the Percentage of Mexican American Indian Population in the State of Maryland?
Percentage of Mexican American Indian Population in Maryland is 0.046%.
What is the Percentage of Mexican American Indian Population in the United States?
Percentage of Mexican American Indian Population in the United States is 0.16%.