Cities with the Most Immigrants from Burma / Myanmar in Maryland
RELATED REPORTS & OPTIONS
Burma / Myanmar
Maryland
Compare Cities
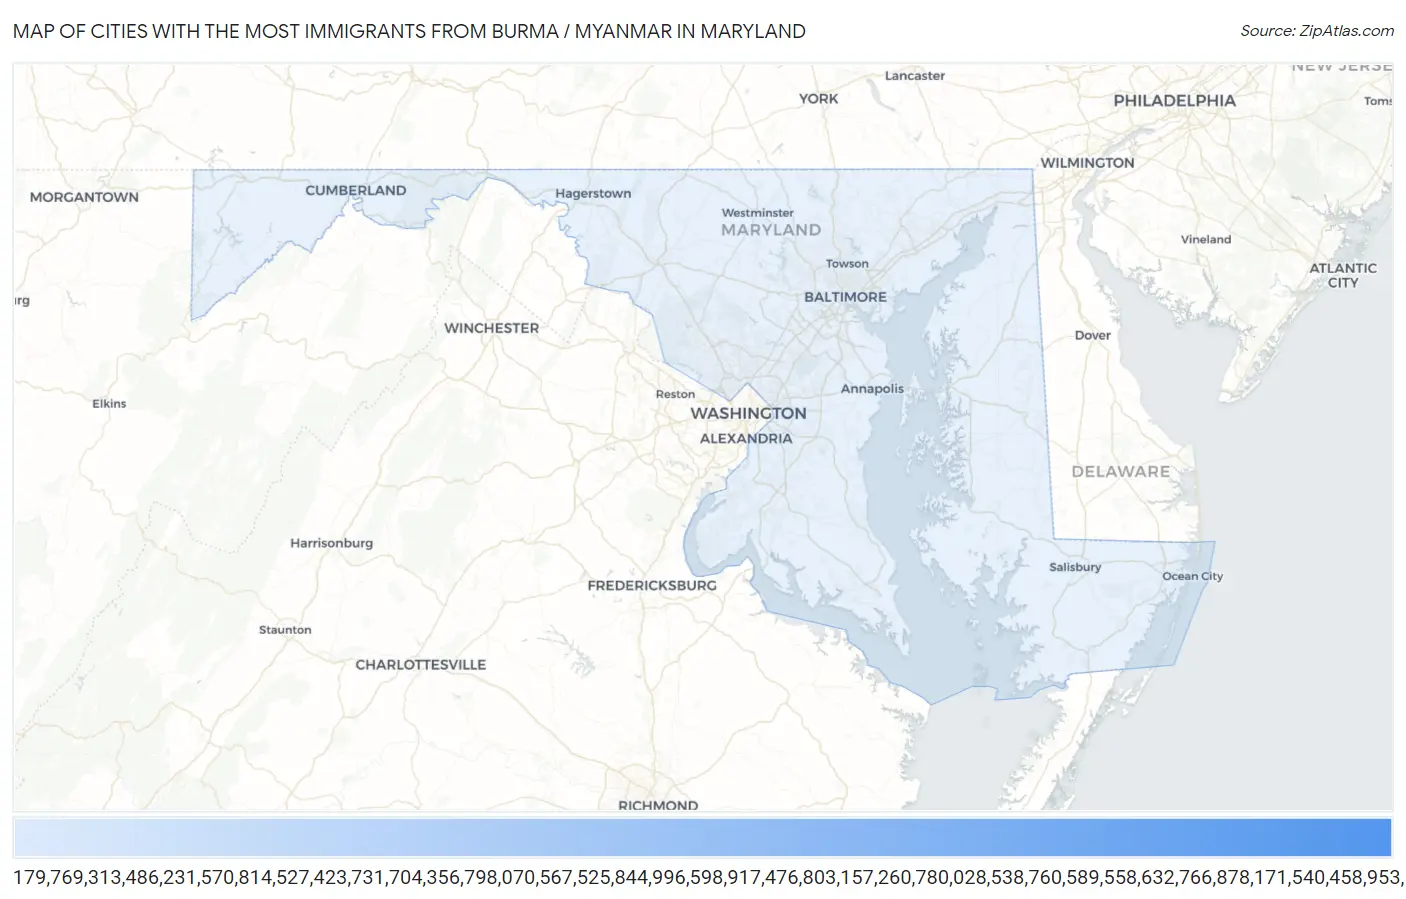
Map of Cities with the Most Immigrants from Burma / Myanmar in Maryland
0
800
Cities with the Most Immigrants from Burma / Myanmar in Maryland
| City | Burma / Myanmar | vs State | vs National | |
| 1. | Arbutus | 644 | 4,888(13.18%)#-1 | 157,000(0.41%)#0 |
| 2. | Catonsville | 549 | 4,888(11.23%)#0 | 157,000(0.35%)#1 |
| 3. | Woodlawn Cdp Baltimore County | 505 | 4,888(10.33%)#1 | 157,000(0.32%)#2 |
| 4. | Frederick | 273 | 4,888(5.59%)#2 | 157,000(0.17%)#3 |
| 5. | Germantown | 271 | 4,888(5.54%)#3 | 157,000(0.17%)#4 |
| 6. | Olney | 242 | 4,888(4.95%)#4 | 157,000(0.15%)#5 |
| 7. | Calverton | 184 | 4,888(3.76%)#5 | 157,000(0.12%)#6 |
| 8. | North Laurel | 166 | 4,888(3.40%)#6 | 157,000(0.11%)#7 |
| 9. | College Park | 163 | 4,888(3.33%)#7 | 157,000(0.10%)#8 |
| 10. | Severn | 159 | 4,888(3.25%)#8 | 157,000(0.10%)#9 |
| 11. | Gaithersburg | 135 | 4,888(2.76%)#9 | 157,000(0.09%)#10 |
| 12. | Towson | 111 | 4,888(2.27%)#10 | 157,000(0.07%)#11 |
| 13. | Rockville | 107 | 4,888(2.19%)#11 | 157,000(0.07%)#12 |
| 14. | Savage | 106 | 4,888(2.17%)#12 | 157,000(0.07%)#13 |
| 15. | Elkridge | 102 | 4,888(2.09%)#13 | 157,000(0.06%)#14 |
| 16. | Columbia | 93 | 4,888(1.90%)#14 | 157,000(0.06%)#15 |
| 17. | Wheaton | 81 | 4,888(1.66%)#15 | 157,000(0.05%)#16 |
| 18. | Beltsville | 77 | 4,888(1.58%)#16 | 157,000(0.05%)#17 |
| 19. | North Bethesda | 73 | 4,888(1.49%)#17 | 157,000(0.05%)#18 |
| 20. | Colesville | 67 | 4,888(1.37%)#18 | 157,000(0.04%)#19 |
| 21. | Montgomery Village | 66 | 4,888(1.35%)#19 | 157,000(0.04%)#20 |
| 22. | Cloverly | 65 | 4,888(1.33%)#20 | 157,000(0.04%)#21 |
| 23. | Flower Hill | 63 | 4,888(1.29%)#21 | 157,000(0.04%)#22 |
| 24. | Aspen Hill | 51 | 4,888(1.04%)#22 | 157,000(0.03%)#23 |
| 25. | Hagerstown | 45 | 4,888(0.92%)#23 | 157,000(0.03%)#24 |
| 26. | Baltimore | 37 | 4,888(0.76%)#24 | 157,000(0.02%)#25 |
| 27. | Overlea | 32 | 4,888(0.65%)#25 | 157,000(0.02%)#26 |
| 28. | Carney | 30 | 4,888(0.61%)#26 | 157,000(0.02%)#27 |
| 29. | Redland | 28 | 4,888(0.57%)#27 | 157,000(0.02%)#28 |
| 30. | Chestertown | 28 | 4,888(0.57%)#28 | 157,000(0.02%)#29 |
| 31. | Travilah | 27 | 4,888(0.55%)#29 | 157,000(0.02%)#30 |
| 32. | Eldersburg | 26 | 4,888(0.53%)#30 | 157,000(0.02%)#31 |
| 33. | Fairland | 22 | 4,888(0.45%)#31 | 157,000(0.01%)#32 |
| 34. | Cockeysville | 19 | 4,888(0.39%)#32 | 157,000(0.01%)#33 |
| 35. | Konterra | 19 | 4,888(0.39%)#33 | 157,000(0.01%)#34 |
| 36. | Bloomington | 17 | 4,888(0.35%)#34 | 157,000(0.01%)#35 |
| 37. | Owings Mills | 16 | 4,888(0.33%)#35 | 157,000(0.01%)#36 |
| 38. | Kensington | 16 | 4,888(0.33%)#36 | 157,000(0.01%)#37 |
| 39. | North Kensington | 11 | 4,888(0.23%)#37 | 157,000(0.01%)#38 |
| 40. | Bel Air South | 10 | 4,888(0.20%)#38 | 157,000(0.01%)#39 |
| 41. | Adelphi | 10 | 4,888(0.20%)#39 | 157,000(0.01%)#40 |
| 42. | Glenn Dale | 10 | 4,888(0.20%)#40 | 157,000(0.01%)#41 |
| 43. | Bartonsville | 9 | 4,888(0.18%)#41 | 157,000(0.01%)#42 |
| 44. | Greenbelt | 8 | 4,888(0.16%)#42 | 157,000(0.01%)#43 |
| 45. | Cumberland | 8 | 4,888(0.16%)#43 | 157,000(0.01%)#44 |
| 46. | Takoma Park | 7 | 4,888(0.14%)#44 | 157,000(0.00%)#45 |
| 47. | Bethesda | 6 | 4,888(0.12%)#45 | 157,000(0.00%)#46 |
| 48. | Hyattsville | 4 | 4,888(0.08%)#46 | 157,000(0.00%)#47 |
| 49. | Damascus | 1 | 4,888(0.02%)#47 | 157,000(0.00%)#48 |
Common Questions
What are the Top 10 Cities with the Most Immigrants from Burma / Myanmar in Maryland?
Top 10 Cities with the Most Immigrants from Burma / Myanmar in Maryland are:
#1
644
#2
549
#3
273
#4
271
#5
242
#6
184
#7
166
#8
163
#9
159
#10
135
What city has the Most Immigrants from Burma / Myanmar in Maryland?
Arbutus has the Most Immigrants from Burma / Myanmar in Maryland with 644.
What is the Total Immigrants from Burma / Myanmar in the State of Maryland?
Total Immigrants from Burma / Myanmar in Maryland is 4,888.
What is the Total Immigrants from Burma / Myanmar in the United States?
Total Immigrants from Burma / Myanmar in the United States is 157,000.