Cities with the Highest Percentage of Population Employed in Cleaning & Maintenance in Maryland
RELATED REPORTS & OPTIONS
Cleaning & Maintenance
Maryland
Compare Cities
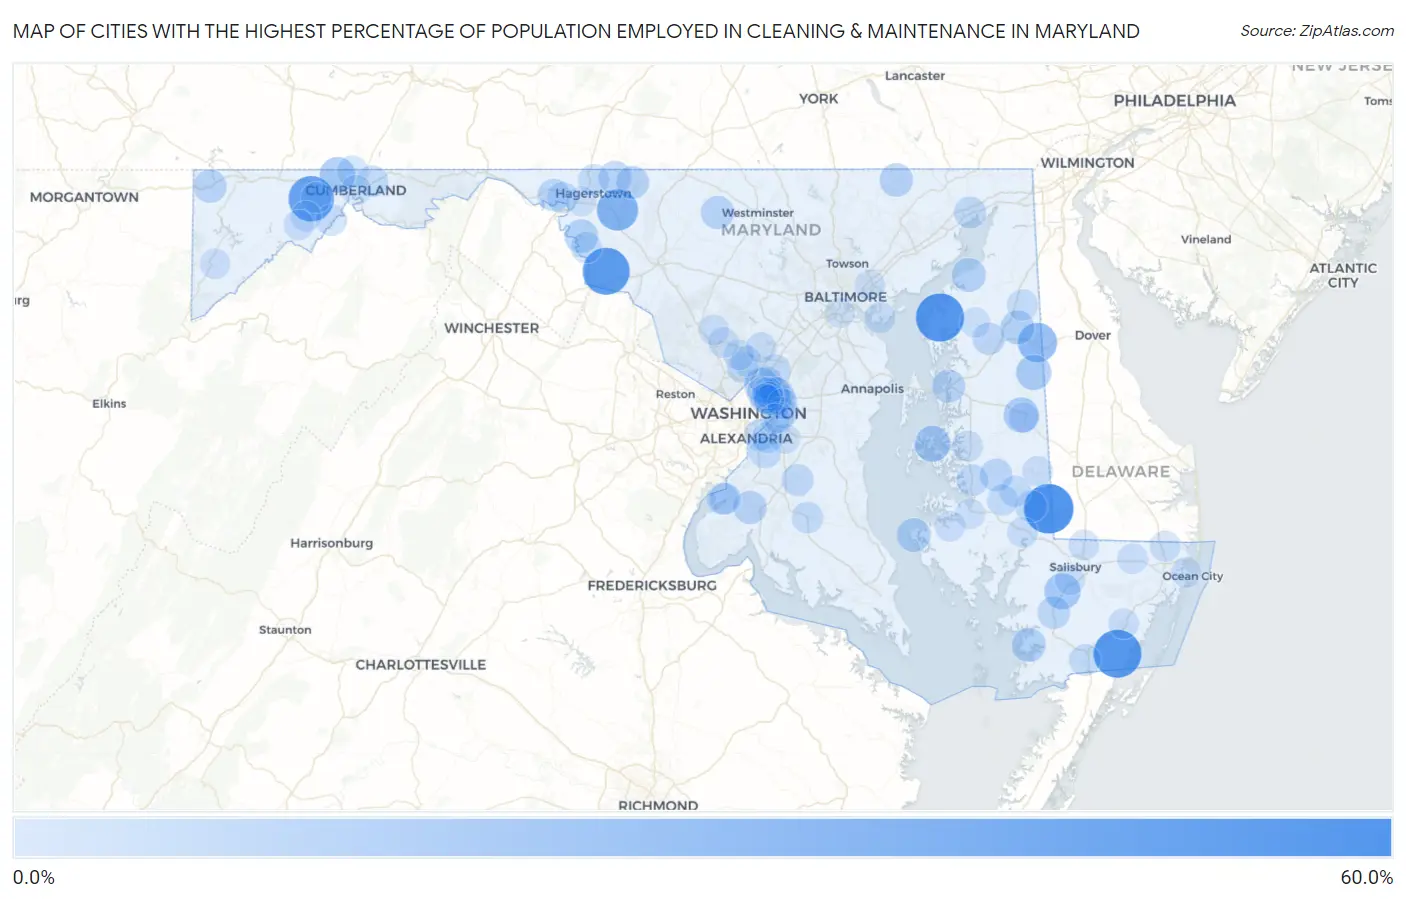
Map of Cities with the Highest Percentage of Population Employed in Cleaning & Maintenance in Maryland
0.0%
60.0%
Cities with the Highest Percentage of Population Employed in Cleaning & Maintenance in Maryland
| City | % Employed | vs State | vs National | |
| 1. | Galestown | 57.1% | 3.2%(+53.9)#1 | 3.5%(+53.7)#63 |
| 2. | Georgetown | 53.6% | 3.2%(+50.4)#2 | 3.5%(+50.1)#73 |
| 3. | Stockton | 52.6% | 3.2%(+49.4)#3 | 3.5%(+49.1)#77 |
| 4. | Brownsville | 50.0% | 3.2%(+46.8)#4 | 3.5%(+46.5)#90 |
| 5. | Carlos | 45.9% | 3.2%(+42.8)#5 | 3.5%(+42.5)#106 |
| 6. | Chesapeake Landing | 44.9% | 3.2%(+41.7)#6 | 3.5%(+41.4)#113 |
| 7. | Bagtown | 34.5% | 3.2%(+31.3)#7 | 3.5%(+31.0)#195 |
| 8. | Templeville | 29.2% | 3.2%(+26.0)#8 | 3.5%(+25.7)#283 |
| 9. | Cedar Heights | 21.5% | 3.2%(+18.3)#9 | 3.5%(+18.0)#544 |
| 10. | Eden | 20.6% | 3.2%(+17.4)#10 | 3.5%(+17.1)#591 |
| 11. | St Michaels | 20.1% | 3.2%(+16.9)#11 | 3.5%(+16.6)#624 |
| 12. | Barrelville | 20.0% | 3.2%(+16.8)#12 | 3.5%(+16.5)#632 |
| 13. | West Denton | 18.4% | 3.2%(+15.2)#13 | 3.5%(+14.9)#740 |
| 14. | Goldsboro | 18.3% | 3.2%(+15.1)#14 | 3.5%(+14.8)#751 |
| 15. | Langley Park | 15.7% | 3.2%(+12.5)#15 | 3.5%(+12.2)#1,017 |
| 16. | Betterton | 15.0% | 3.2%(+11.8)#16 | 3.5%(+11.5)#1,112 |
| 17. | Sudlersville | 14.9% | 3.2%(+11.7)#17 | 3.5%(+11.4)#1,129 |
| 18. | Fairmount | 14.8% | 3.2%(+11.6)#18 | 3.5%(+11.3)#1,140 |
| 19. | Taylors Island | 14.6% | 3.2%(+11.4)#19 | 3.5%(+11.1)#1,188 |
| 20. | Mercersville | 14.5% | 3.2%(+11.3)#20 | 3.5%(+11.1)#1,195 |
| 21. | Pylesville | 13.8% | 3.2%(+10.6)#21 | 3.5%(+10.3)#1,357 |
| 22. | Union Bridge | 13.5% | 3.2%(+10.3)#22 | 3.5%(+10.0)#1,410 |
| 23. | Pomfret | 13.4% | 3.2%(+10.2)#23 | 3.5%(+9.95)#1,429 |
| 24. | Leitersburg | 13.3% | 3.2%(+10.1)#24 | 3.5%(+9.79)#1,467 |
| 25. | Edgemont | 13.0% | 3.2%(+9.82)#25 | 3.5%(+9.53)#1,540 |
| 26. | Queenstown | 12.9% | 3.2%(+9.69)#26 | 3.5%(+9.40)#1,576 |
| 27. | Friendsville | 12.8% | 3.2%(+9.63)#27 | 3.5%(+9.34)#1,601 |
| 28. | Bladensburg | 11.8% | 3.2%(+8.61)#28 | 3.5%(+8.32)#1,917 |
| 29. | Princess Anne | 11.7% | 3.2%(+8.52)#29 | 3.5%(+8.23)#1,944 |
| 30. | Choptank | 11.6% | 3.2%(+8.40)#30 | 3.5%(+8.11)#1,979 |
| 31. | Brentwood | 11.4% | 3.2%(+8.22)#31 | 3.5%(+7.93)#2,044 |
| 32. | East Riverdale | 11.3% | 3.2%(+8.08)#32 | 3.5%(+7.79)#2,105 |
| 33. | Charlton | 11.1% | 3.2%(+7.86)#33 | 3.5%(+7.58)#2,187 |
| 34. | Church Hill | 10.9% | 3.2%(+7.71)#34 | 3.5%(+7.42)#2,247 |
| 35. | Adelphi | 10.5% | 3.2%(+7.28)#35 | 3.5%(+7.00)#2,408 |
| 36. | Glassmanor | 10.2% | 3.2%(+7.01)#36 | 3.5%(+6.72)#2,525 |
| 37. | Cedarville | 10.1% | 3.2%(+6.94)#37 | 3.5%(+6.65)#2,555 |
| 38. | Perryville | 10.0% | 3.2%(+6.81)#38 | 3.5%(+6.53)#2,608 |
| 39. | Landover Hills | 9.6% | 3.2%(+6.45)#39 | 3.5%(+6.16)#2,815 |
| 40. | Indian Head | 9.5% | 3.2%(+6.34)#40 | 3.5%(+6.05)#2,875 |
| 41. | Brookview | 9.5% | 3.2%(+6.33)#41 | 3.5%(+6.04)#2,885 |
| 42. | Trappe | 9.5% | 3.2%(+6.31)#42 | 3.5%(+6.02)#2,888 |
| 43. | Potomac Heights | 9.4% | 3.2%(+6.19)#43 | 3.5%(+5.90)#2,957 |
| 44. | Hughesville | 9.2% | 3.2%(+5.98)#44 | 3.5%(+5.70)#3,059 |
| 45. | Pocomoke City | 9.2% | 3.2%(+5.98)#45 | 3.5%(+5.69)#3,060 |
| 46. | Friendly | 9.1% | 3.2%(+5.87)#46 | 3.5%(+5.58)#3,140 |
| 47. | Pinesburg | 8.9% | 3.2%(+5.74)#47 | 3.5%(+5.46)#3,210 |
| 48. | Fountainhead Orchard Hills | 8.9% | 3.2%(+5.71)#48 | 3.5%(+5.43)#3,230 |
| 49. | Beltsville | 8.9% | 3.2%(+5.71)#49 | 3.5%(+5.42)#3,237 |
| 50. | Pleasant Grove | 8.8% | 3.2%(+5.63)#50 | 3.5%(+5.34)#3,310 |
| 51. | Wheaton | 8.8% | 3.2%(+5.60)#51 | 3.5%(+5.31)#3,332 |
| 52. | Riverdale Park | 8.6% | 3.2%(+5.41)#52 | 3.5%(+5.13)#3,468 |
| 53. | Sharpsburg | 8.5% | 3.2%(+5.26)#53 | 3.5%(+4.97)#3,575 |
| 54. | Hurlock | 8.4% | 3.2%(+5.24)#54 | 3.5%(+4.95)#3,595 |
| 55. | Chillum | 8.4% | 3.2%(+5.19)#55 | 3.5%(+4.91)#3,625 |
| 56. | North Brentwood | 8.3% | 3.2%(+5.14)#56 | 3.5%(+4.85)#3,653 |
| 57. | Bier | 8.2% | 3.2%(+5.05)#57 | 3.5%(+4.76)#3,753 |
| 58. | Millington | 8.2% | 3.2%(+4.96)#58 | 3.5%(+4.67)#3,842 |
| 59. | Temple Hills | 8.1% | 3.2%(+4.88)#59 | 3.5%(+4.60)#3,895 |
| 60. | Woodlawn Cdp Prince George S County | 8.1% | 3.2%(+4.88)#60 | 3.5%(+4.59)#3,898 |
| 61. | East New Market | 7.7% | 3.2%(+4.50)#61 | 3.5%(+4.21)#4,231 |
| 62. | Peppermill Village | 7.7% | 3.2%(+4.48)#62 | 3.5%(+4.19)#4,266 |
| 63. | Ellerslie | 7.6% | 3.2%(+4.38)#63 | 3.5%(+4.09)#4,349 |
| 64. | Easton | 7.6% | 3.2%(+4.35)#64 | 3.5%(+4.07)#4,370 |
| 65. | Burnt Mills | 7.2% | 3.2%(+3.97)#65 | 3.5%(+3.68)#4,759 |
| 66. | Shaft | 7.1% | 3.2%(+3.95)#66 | 3.5%(+3.66)#4,781 |
| 67. | Edgemere | 7.1% | 3.2%(+3.88)#67 | 3.5%(+3.59)#4,845 |
| 68. | Bishopville | 7.0% | 3.2%(+3.82)#68 | 3.5%(+3.53)#4,901 |
| 69. | Lonaconing | 7.0% | 3.2%(+3.79)#69 | 3.5%(+3.51)#4,947 |
| 70. | Glenmont | 6.9% | 3.2%(+3.73)#70 | 3.5%(+3.44)#5,019 |
| 71. | Vienna | 6.9% | 3.2%(+3.70)#71 | 3.5%(+3.41)#5,044 |
| 72. | Crumpton | 6.8% | 3.2%(+3.56)#72 | 3.5%(+3.27)#5,247 |
| 73. | Aspen Hill | 6.7% | 3.2%(+3.54)#73 | 3.5%(+3.25)#5,277 |
| 74. | Federalsburg | 6.7% | 3.2%(+3.46)#74 | 3.5%(+3.18)#5,386 |
| 75. | Spencerville | 6.6% | 3.2%(+3.44)#75 | 3.5%(+3.15)#5,409 |
| 76. | Redland | 6.6% | 3.2%(+3.40)#76 | 3.5%(+3.12)#5,448 |
| 77. | Delmar | 6.6% | 3.2%(+3.39)#77 | 3.5%(+3.10)#5,464 |
| 78. | Capitol Heights | 6.6% | 3.2%(+3.39)#78 | 3.5%(+3.10)#5,468 |
| 79. | Snow Hill | 6.5% | 3.2%(+3.29)#79 | 3.5%(+3.00)#5,621 |
| 80. | Cottage City | 6.4% | 3.2%(+3.24)#80 | 3.5%(+2.95)#5,688 |
| 81. | Montgomery Village | 6.4% | 3.2%(+3.23)#81 | 3.5%(+2.94)#5,694 |
| 82. | Willards | 6.4% | 3.2%(+3.23)#82 | 3.5%(+2.94)#5,700 |
| 83. | Mountain Lake Park | 6.4% | 3.2%(+3.21)#83 | 3.5%(+2.92)#5,723 |
| 84. | Church Creek | 6.4% | 3.2%(+3.19)#84 | 3.5%(+2.90)#5,762 |
| 85. | Hyattsville | 6.4% | 3.2%(+3.18)#85 | 3.5%(+2.89)#5,770 |
| 86. | Denton | 6.2% | 3.2%(+3.00)#86 | 3.5%(+2.71)#6,068 |
| 87. | Barton | 6.2% | 3.2%(+2.98)#87 | 3.5%(+2.70)#6,094 |
| 88. | Landover | 6.0% | 3.2%(+2.77)#88 | 3.5%(+2.48)#6,441 |
| 89. | Kingstown | 5.8% | 3.2%(+2.60)#89 | 3.5%(+2.31)#6,689 |
| 90. | Rosedale | 5.7% | 3.2%(+2.54)#90 | 3.5%(+2.25)#6,793 |
| 91. | Cambridge | 5.7% | 3.2%(+2.51)#91 | 3.5%(+2.22)#6,854 |
| 92. | Andrews Afb | 5.7% | 3.2%(+2.49)#92 | 3.5%(+2.21)#6,872 |
| 93. | Flower Hill | 5.7% | 3.2%(+2.48)#93 | 3.5%(+2.19)#6,898 |
| 94. | Cumberland | 5.7% | 3.2%(+2.47)#94 | 3.5%(+2.18)#6,916 |
| 95. | West Ocean City | 5.7% | 3.2%(+2.46)#95 | 3.5%(+2.17)#6,938 |
| 96. | Baltimore Highlands | 5.6% | 3.2%(+2.43)#96 | 3.5%(+2.15)#6,996 |
| 97. | Halfway | 5.5% | 3.2%(+2.27)#97 | 3.5%(+1.99)#7,278 |
| 98. | Mount Rainier | 5.4% | 3.2%(+2.25)#98 | 3.5%(+1.96)#7,308 |
| 99. | Fruitland | 5.4% | 3.2%(+2.22)#99 | 3.5%(+1.93)#7,354 |
| 100. | Coral Hills | 5.4% | 3.2%(+2.20)#100 | 3.5%(+1.92)#7,396 |
Common Questions
What are the Top 10 Cities with the Highest Percentage of Population Employed in Cleaning & Maintenance in Maryland?
Top 10 Cities with the Highest Percentage of Population Employed in Cleaning & Maintenance in Maryland are:
#1
57.1%
#2
53.6%
#3
52.6%
#4
50.0%
#5
45.9%
#6
34.5%
#7
29.2%
#8
20.6%
#9
20.1%
#10
20.0%
What city has the Highest Percentage of Population Employed in Cleaning & Maintenance in Maryland?
Galestown has the Highest Percentage of Population Employed in Cleaning & Maintenance in Maryland with 57.1%.
What is the Percentage of Population Employed in Cleaning & Maintenance in the State of Maryland?
Percentage of Population Employed in Cleaning & Maintenance in Maryland is 3.2%.
What is the Percentage of Population Employed in Cleaning & Maintenance in the United States?
Percentage of Population Employed in Cleaning & Maintenance in the United States is 3.5%.