Cities with the Most Immigrants from Jamaica in Maryland
RELATED REPORTS & OPTIONS
Jamaica
Maryland
Compare Cities
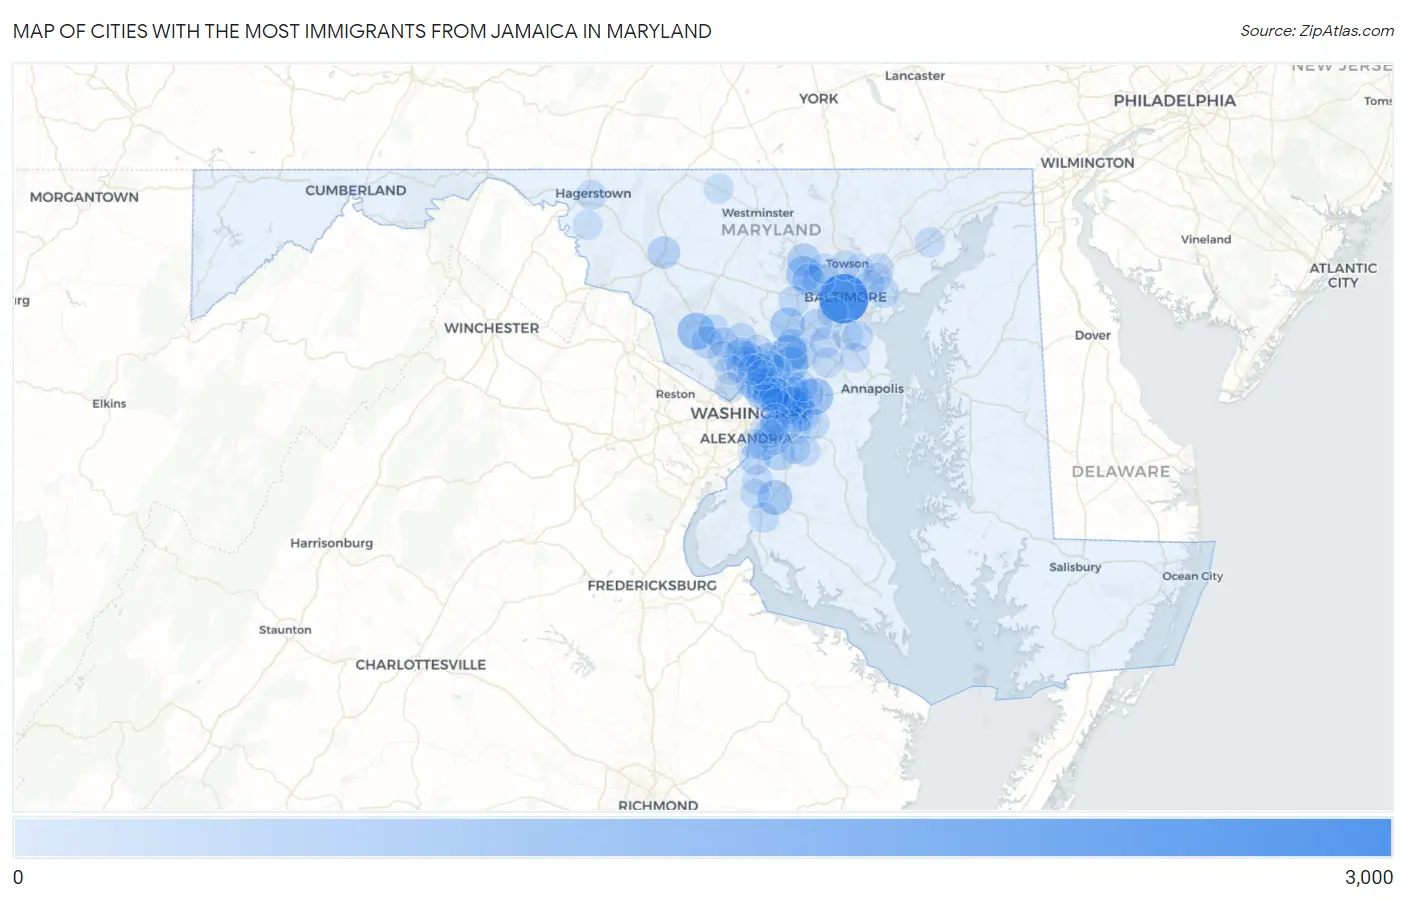
Map of Cities with the Most Immigrants from Jamaica in Maryland
0
3,000
Cities with the Most Immigrants from Jamaica in Maryland
| City | Jamaica | vs State | vs National | |
| 1. | Baltimore | 2,619 | 27,444(9.54%)#1 | 785,998(0.33%)#31 |
| 2. | Laurel | 977 | 27,444(3.56%)#2 | 785,998(0.12%)#90 |
| 3. | Germantown | 964 | 27,444(3.51%)#3 | 785,998(0.12%)#93 |
| 4. | Bowie | 880 | 27,444(3.21%)#4 | 785,998(0.11%)#99 |
| 5. | Randallstown | 708 | 27,444(2.58%)#5 | 785,998(0.09%)#123 |
| 6. | Waldorf | 665 | 27,444(2.42%)#6 | 785,998(0.08%)#131 |
| 7. | South Laurel | 645 | 27,444(2.35%)#7 | 785,998(0.08%)#136 |
| 8. | Columbia | 644 | 27,444(2.35%)#8 | 785,998(0.08%)#137 |
| 9. | Landover | 619 | 27,444(2.26%)#9 | 785,998(0.08%)#144 |
| 10. | Chillum | 614 | 27,444(2.24%)#10 | 785,998(0.08%)#146 |
| 11. | Seabrook | 534 | 27,444(1.95%)#11 | 785,998(0.07%)#170 |
| 12. | Fairland | 486 | 27,444(1.77%)#12 | 785,998(0.06%)#188 |
| 13. | Lake Arbor | 483 | 27,444(1.76%)#13 | 785,998(0.06%)#190 |
| 14. | Owings Mills | 458 | 27,444(1.67%)#14 | 785,998(0.06%)#198 |
| 15. | Clinton | 425 | 27,444(1.55%)#15 | 785,998(0.05%)#217 |
| 16. | Largo | 420 | 27,444(1.53%)#16 | 785,998(0.05%)#218 |
| 17. | Lochearn | 398 | 27,444(1.45%)#17 | 785,998(0.05%)#231 |
| 18. | Silver Spring | 392 | 27,444(1.43%)#18 | 785,998(0.05%)#232 |
| 19. | Frederick | 386 | 27,444(1.41%)#19 | 785,998(0.05%)#235 |
| 20. | Gaithersburg | 362 | 27,444(1.32%)#20 | 785,998(0.05%)#251 |
| 21. | Milford Mill | 359 | 27,444(1.31%)#21 | 785,998(0.05%)#252 |
| 22. | Wheaton | 355 | 27,444(1.29%)#22 | 785,998(0.05%)#255 |
| 23. | Glenarden | 299 | 27,444(1.09%)#23 | 785,998(0.04%)#286 |
| 24. | Elkridge | 298 | 27,444(1.09%)#24 | 785,998(0.04%)#287 |
| 25. | Langley Park | 293 | 27,444(1.07%)#25 | 785,998(0.04%)#290 |
| 26. | Kettering | 292 | 27,444(1.06%)#26 | 785,998(0.04%)#291 |
| 27. | Fort Washington | 291 | 27,444(1.06%)#27 | 785,998(0.04%)#292 |
| 28. | Lanham | 289 | 27,444(1.05%)#28 | 785,998(0.04%)#294 |
| 29. | Maryland City | 278 | 27,444(1.01%)#29 | 785,998(0.04%)#300 |
| 30. | Mitchellville | 273 | 27,444(0.99%)#30 | 785,998(0.03%)#305 |
| 31. | Olney | 246 | 27,444(0.90%)#31 | 785,998(0.03%)#324 |
| 32. | Oxon Hill | 241 | 27,444(0.88%)#32 | 785,998(0.03%)#331 |
| 33. | Severn | 240 | 27,444(0.87%)#33 | 785,998(0.03%)#332 |
| 34. | New Carrollton | 231 | 27,444(0.84%)#34 | 785,998(0.03%)#344 |
| 35. | Aspen Hill | 203 | 27,444(0.74%)#35 | 785,998(0.03%)#386 |
| 36. | Beltsville | 201 | 27,444(0.73%)#36 | 785,998(0.03%)#388 |
| 37. | Calverton | 195 | 27,444(0.71%)#37 | 785,998(0.02%)#400 |
| 38. | Montgomery Village | 194 | 27,444(0.71%)#38 | 785,998(0.02%)#402 |
| 39. | Essex | 189 | 27,444(0.69%)#39 | 785,998(0.02%)#413 |
| 40. | Woodlawn Cdp Prince George S County | 184 | 27,444(0.67%)#40 | 785,998(0.02%)#421 |
| 41. | Colesville | 183 | 27,444(0.67%)#41 | 785,998(0.02%)#422 |
| 42. | Woodlawn Cdp Baltimore County | 178 | 27,444(0.65%)#42 | 785,998(0.02%)#432 |
| 43. | Summerfield | 177 | 27,444(0.64%)#43 | 785,998(0.02%)#433 |
| 44. | College Park | 164 | 27,444(0.60%)#44 | 785,998(0.02%)#470 |
| 45. | Ellicott City | 157 | 27,444(0.57%)#45 | 785,998(0.02%)#489 |
| 46. | Brock Hall | 155 | 27,444(0.56%)#46 | 785,998(0.02%)#497 |
| 47. | Glenmont | 146 | 27,444(0.53%)#47 | 785,998(0.02%)#529 |
| 48. | Westphalia | 142 | 27,444(0.52%)#48 | 785,998(0.02%)#535 |
| 49. | Glen Burnie | 140 | 27,444(0.51%)#49 | 785,998(0.02%)#541 |
| 50. | East Riverdale | 139 | 27,444(0.51%)#50 | 785,998(0.02%)#549 |
| 51. | Adelphi | 133 | 27,444(0.48%)#51 | 785,998(0.02%)#561 |
| 52. | Marlton | 133 | 27,444(0.48%)#52 | 785,998(0.02%)#564 |
| 53. | Odenton | 128 | 27,444(0.47%)#53 | 785,998(0.02%)#583 |
| 54. | La Plata | 127 | 27,444(0.46%)#54 | 785,998(0.02%)#591 |
| 55. | Riverdale Park | 125 | 27,444(0.46%)#55 | 785,998(0.02%)#601 |
| 56. | Lansdowne | 122 | 27,444(0.44%)#56 | 785,998(0.02%)#615 |
| 57. | Rosaryville | 120 | 27,444(0.44%)#57 | 785,998(0.02%)#621 |
| 58. | Pasadena | 117 | 27,444(0.43%)#58 | 785,998(0.01%)#634 |
| 59. | Takoma Park | 116 | 27,444(0.42%)#59 | 785,998(0.01%)#637 |
| 60. | Cloverly | 116 | 27,444(0.42%)#60 | 785,998(0.01%)#639 |
| 61. | Hyattsville | 115 | 27,444(0.42%)#61 | 785,998(0.01%)#643 |
| 62. | Rockville | 111 | 27,444(0.40%)#62 | 785,998(0.01%)#661 |
| 63. | North Laurel | 111 | 27,444(0.40%)#63 | 785,998(0.01%)#664 |
| 64. | Flower Hill | 110 | 27,444(0.40%)#64 | 785,998(0.01%)#670 |
| 65. | White Marsh | 108 | 27,444(0.39%)#65 | 785,998(0.01%)#678 |
| 66. | Layhill | 108 | 27,444(0.39%)#66 | 785,998(0.01%)#679 |
| 67. | Leisure World | 100 | 27,444(0.36%)#67 | 785,998(0.01%)#724 |
| 68. | Accokeek | 97 | 27,444(0.35%)#68 | 785,998(0.01%)#743 |
| 69. | Springdale | 96 | 27,444(0.35%)#69 | 785,998(0.01%)#752 |
| 70. | Bethesda | 95 | 27,444(0.35%)#70 | 785,998(0.01%)#755 |
| 71. | Forestville | 93 | 27,444(0.34%)#71 | 785,998(0.01%)#764 |
| 72. | Pikesville | 89 | 27,444(0.32%)#72 | 785,998(0.01%)#793 |
| 73. | Camp Springs | 89 | 27,444(0.32%)#73 | 785,998(0.01%)#795 |
| 74. | Fairwood | 88 | 27,444(0.32%)#74 | 785,998(0.01%)#799 |
| 75. | Parkville | 87 | 27,444(0.32%)#75 | 785,998(0.01%)#802 |
| 76. | North Bethesda | 85 | 27,444(0.31%)#76 | 785,998(0.01%)#810 |
| 77. | Bladensburg | 80 | 27,444(0.29%)#77 | 785,998(0.01%)#847 |
| 78. | Riverside | 80 | 27,444(0.29%)#78 | 785,998(0.01%)#849 |
| 79. | White Oak | 74 | 27,444(0.27%)#79 | 785,998(0.01%)#886 |
| 80. | Silver Hill | 74 | 27,444(0.27%)#80 | 785,998(0.01%)#888 |
| 81. | Cheverly | 72 | 27,444(0.26%)#81 | 785,998(0.01%)#910 |
| 82. | Brentwood | 72 | 27,444(0.26%)#82 | 785,998(0.01%)#912 |
| 83. | Redland | 71 | 27,444(0.26%)#83 | 785,998(0.01%)#920 |
| 84. | Hillcrest Heights | 69 | 27,444(0.25%)#84 | 785,998(0.01%)#938 |
| 85. | Hagerstown | 68 | 27,444(0.25%)#85 | 785,998(0.01%)#949 |
| 86. | Coral Hills | 66 | 27,444(0.24%)#86 | 785,998(0.01%)#977 |
| 87. | Rosedale | 64 | 27,444(0.23%)#87 | 785,998(0.01%)#994 |
| 88. | Wildewood | 64 | 27,444(0.23%)#88 | 785,998(0.01%)#996 |
| 89. | Severna Park | 60 | 27,444(0.22%)#89 | 785,998(0.01%)#1,037 |
| 90. | Hillandale | 57 | 27,444(0.21%)#90 | 785,998(0.01%)#1,078 |
| 91. | Fairplay | 57 | 27,444(0.21%)#91 | 785,998(0.01%)#1,080 |
| 92. | Glenn Dale | 56 | 27,444(0.20%)#92 | 785,998(0.01%)#1,091 |
| 93. | Marlow Heights | 55 | 27,444(0.20%)#93 | 785,998(0.01%)#1,099 |
| 94. | Suitland | 54 | 27,444(0.20%)#94 | 785,998(0.01%)#1,111 |
| 95. | Bensville | 54 | 27,444(0.20%)#95 | 785,998(0.01%)#1,112 |
| 96. | Towson | 50 | 27,444(0.18%)#96 | 785,998(0.01%)#1,165 |
| 97. | Kemp Mill | 50 | 27,444(0.18%)#97 | 785,998(0.01%)#1,172 |
| 98. | Rossville | 48 | 27,444(0.17%)#98 | 785,998(0.01%)#1,197 |
| 99. | Taneytown | 45 | 27,444(0.16%)#99 | 785,998(0.01%)#1,238 |
| 100. | National Harbor | 45 | 27,444(0.16%)#100 | 785,998(0.01%)#1,240 |
Common Questions
What are the Top 10 Cities with the Most Immigrants from Jamaica in Maryland?
Top 10 Cities with the Most Immigrants from Jamaica in Maryland are:
#1
2,619
#2
977
#3
964
#4
880
#5
708
#6
665
#7
645
#8
644
#9
619
#10
614
What city has the Most Immigrants from Jamaica in Maryland?
Baltimore has the Most Immigrants from Jamaica in Maryland with 2,619.
What is the Total Immigrants from Jamaica in the State of Maryland?
Total Immigrants from Jamaica in Maryland is 27,444.
What is the Total Immigrants from Jamaica in the United States?
Total Immigrants from Jamaica in the United States is 785,998.