Cities with the Highest Percentage of Immigrants from Guyana in Maryland
RELATED REPORTS & OPTIONS
Guyana
Maryland
Compare Cities
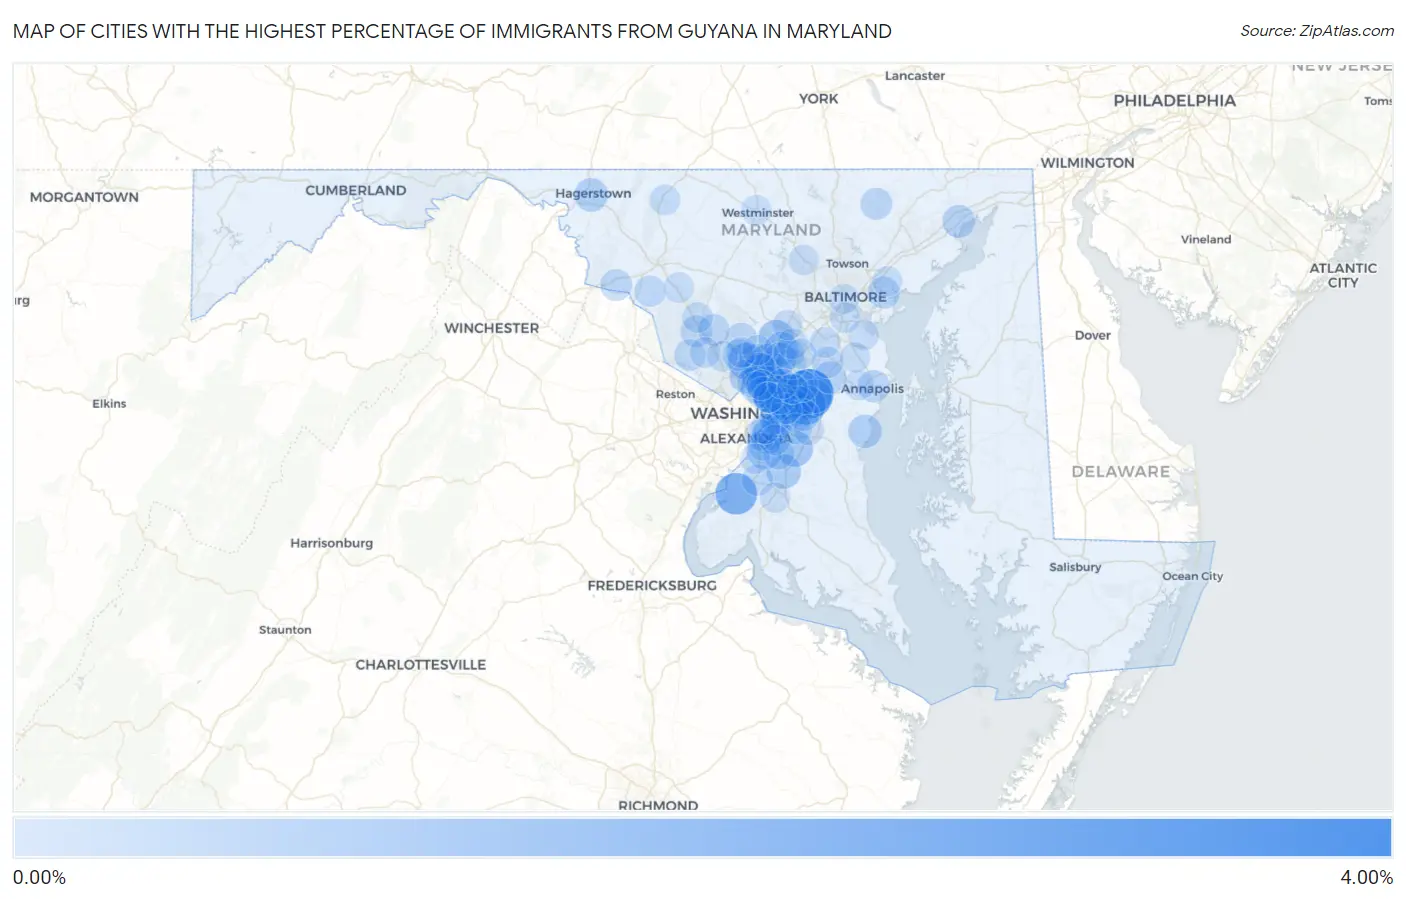
Map of Cities with the Highest Percentage of Immigrants from Guyana in Maryland
0.00%
4.00%
Cities with the Highest Percentage of Immigrants from Guyana in Maryland
| City | Guyana | vs State | vs National | |
| 1. | Fairwood | 3.25% | 0.13%(+3.12)#-1 | 0.087%(+3.17)#0 |
| 2. | Ten Mile Creek | 3.20% | 0.13%(+3.07)#0 | 0.087%(+3.11)#1 |
| 3. | Riverdale Park | 2.46% | 0.13%(+2.33)#52 | 0.087%(+2.37)#834 |
| 4. | Bryans Road | 1.91% | 0.13%(+1.78)#53 | 0.087%(+1.82)#835 |
| 5. | Hillandale | 1.90% | 0.13%(+1.77)#54 | 0.087%(+1.81)#836 |
| 6. | Woodmore | 1.58% | 0.13%(+1.45)#55 | 0.087%(+1.49)#837 |
| 7. | East Riverdale | 1.44% | 0.13%(+1.31)#56 | 0.087%(+1.36)#988 |
| 8. | Glenmont | 1.15% | 0.13%(+1.02)#57 | 0.087%(+1.06)#989 |
| 9. | Rosaryville | 1.00% | 0.13%(+0.866)#58 | 0.087%(+0.911)#990 |
| 10. | New Carrollton | 0.98% | 0.13%(+0.848)#59 | 0.087%(+0.893)#991 |
| 11. | Woodlawn Cdp Prince George S County | 0.96% | 0.13%(+0.826)#60 | 0.087%(+0.871)#992 |
| 12. | Lanham | 0.95% | 0.13%(+0.820)#61 | 0.087%(+0.865)#993 |
| 13. | Fulton | 0.92% | 0.13%(+0.788)#62 | 0.087%(+0.833)#994 |
| 14. | Glenarden | 0.79% | 0.13%(+0.658)#71 | 0.087%(+0.703)#1,279 |
| 15. | Brandywine | 0.78% | 0.13%(+0.652)#72 | 0.087%(+0.696)#1,280 |
| 16. | Colesville | 0.78% | 0.13%(+0.649)#73 | 0.087%(+0.694)#1,281 |
| 17. | Lake Arbor | 0.75% | 0.13%(+0.620)#74 | 0.087%(+0.665)#1,282 |
| 18. | Friendly | 0.67% | 0.13%(+0.536)#75 | 0.087%(+0.581)#1,283 |
| 19. | Bowie | 0.66% | 0.13%(+0.526)#76 | 0.087%(+0.571)#1,284 |
| 20. | West Laurel | 0.65% | 0.13%(+0.515)#77 | 0.087%(+0.560)#1,285 |
| 21. | Forest Glen | 0.64% | 0.13%(+0.510)#78 | 0.087%(+0.555)#1,286 |
| 22. | Hagerstown | 0.62% | 0.13%(+0.489)#79 | 0.087%(+0.533)#1,287 |
| 23. | Capitol Heights | 0.60% | 0.13%(+0.463)#80 | 0.087%(+0.508)#1,288 |
| 24. | Shady Side | 0.58% | 0.13%(+0.453)#81 | 0.087%(+0.498)#1,289 |
| 25. | Brown Station | 0.58% | 0.13%(+0.444)#82 | 0.087%(+0.489)#1,290 |
| 26. | Temple Hills | 0.54% | 0.13%(+0.410)#83 | 0.087%(+0.455)#1,291 |
| 27. | Beltsville | 0.52% | 0.13%(+0.386)#84 | 0.087%(+0.431)#1,292 |
| 28. | College Park | 0.52% | 0.13%(+0.386)#85 | 0.087%(+0.430)#1,293 |
| 29. | Havre De Grace | 0.51% | 0.13%(+0.377)#86 | 0.087%(+0.422)#1,294 |
| 30. | Fairland | 0.51% | 0.13%(+0.376)#87 | 0.087%(+0.421)#1,295 |
| 31. | Adelphi | 0.51% | 0.13%(+0.376)#88 | 0.087%(+0.421)#1,296 |
| 32. | Konterra | 0.48% | 0.13%(+0.352)#89 | 0.087%(+0.397)#1,297 |
| 33. | Landover | 0.47% | 0.13%(+0.343)#90 | 0.087%(+0.388)#1,298 |
| 34. | Fairmount Heights | 0.47% | 0.13%(+0.338)#91 | 0.087%(+0.383)#1,299 |
| 35. | Mitchellville | 0.45% | 0.13%(+0.323)#92 | 0.087%(+0.368)#1,300 |
| 36. | Hyattsville | 0.43% | 0.13%(+0.300)#93 | 0.087%(+0.345)#1,301 |
| 37. | Crofton | 0.42% | 0.13%(+0.291)#94 | 0.087%(+0.336)#1,302 |
| 38. | Marlow Heights | 0.42% | 0.13%(+0.284)#95 | 0.087%(+0.329)#1,303 |
| 39. | Naval Academy | 0.40% | 0.13%(+0.265)#96 | 0.087%(+0.310)#1,304 |
| 40. | Essex | 0.39% | 0.13%(+0.258)#97 | 0.087%(+0.303)#1,545 |
| 41. | White Oak | 0.37% | 0.13%(+0.236)#98 | 0.087%(+0.281)#1,546 |
| 42. | Walker Mill | 0.35% | 0.13%(+0.219)#99 | 0.087%(+0.264)#1,547 |
| 43. | Olney | 0.34% | 0.13%(+0.206)#100 | 0.087%(+0.251)#1,548 |
| 44. | Jarrettsville | 0.34% | 0.13%(+0.205)#101 | 0.087%(+0.249)#1,549 |
| 45. | Rosemont | 0.34% | 0.13%(+0.204)#102 | 0.087%(+0.249)#1,550 |
| 46. | Takoma Park | 0.33% | 0.13%(+0.199)#103 | 0.087%(+0.244)#1,551 |
| 47. | Germantown | 0.31% | 0.13%(+0.179)#104 | 0.087%(+0.224)#1,552 |
| 48. | Montgomery Village | 0.31% | 0.13%(+0.176)#105 | 0.087%(+0.221)#1,553 |
| 49. | Largo | 0.30% | 0.13%(+0.166)#106 | 0.087%(+0.211)#1,554 |
| 50. | Aspen Hill | 0.30% | 0.13%(+0.165)#107 | 0.087%(+0.210)#1,555 |
| 51. | Burnt Mills | 0.29% | 0.13%(+0.162)#108 | 0.087%(+0.207)#1,556 |
| 52. | Darnestown | 0.28% | 0.13%(+0.153)#109 | 0.087%(+0.198)#1,557 |
| 53. | Accokeek | 0.27% | 0.13%(+0.143)#110 | 0.087%(+0.188)#1,558 |
| 54. | Oxon Hill | 0.27% | 0.13%(+0.138)#111 | 0.087%(+0.183)#1,559 |
| 55. | Odenton | 0.27% | 0.13%(+0.135)#112 | 0.087%(+0.180)#1,560 |
| 56. | Suitland | 0.26% | 0.13%(+0.128)#113 | 0.087%(+0.173)#1,561 |
| 57. | Clinton | 0.25% | 0.13%(+0.122)#114 | 0.087%(+0.167)#1,562 |
| 58. | Kettering | 0.25% | 0.13%(+0.121)#115 | 0.087%(+0.166)#1,563 |
| 59. | Adamstown | 0.25% | 0.13%(+0.119)#116 | 0.087%(+0.164)#1,564 |
| 60. | Chillum | 0.25% | 0.13%(+0.113)#117 | 0.087%(+0.158)#1,565 |
| 61. | Bladensburg | 0.24% | 0.13%(+0.109)#118 | 0.087%(+0.153)#1,566 |
| 62. | Glassmanor | 0.23% | 0.13%(+0.099)#119 | 0.087%(+0.144)#1,567 |
| 63. | Glenn Dale | 0.23% | 0.13%(+0.098)#120 | 0.087%(+0.143)#1,568 |
| 64. | Coral Hills | 0.22% | 0.13%(+0.091)#121 | 0.087%(+0.136)#1,569 |
| 65. | South Laurel | 0.21% | 0.13%(+0.083)#122 | 0.087%(+0.128)#1,570 |
| 66. | Laurel | 0.20% | 0.13%(+0.064)#123 | 0.087%(+0.109)#1,571 |
| 67. | Silver Spring | 0.20% | 0.13%(+0.064)#124 | 0.087%(+0.109)#1,572 |
| 68. | Landover Hills | 0.19% | 0.13%(+0.057)#125 | 0.087%(+0.102)#1,573 |
| 69. | Brentwood | 0.19% | 0.13%(+0.053)#126 | 0.087%(+0.098)#1,574 |
| 70. | Severn | 0.18% | 0.13%(+0.053)#127 | 0.087%(+0.098)#1,575 |
| 71. | Westphalia | 0.18% | 0.13%(+0.046)#128 | 0.087%(+0.091)#1,576 |
| 72. | Rockville | 0.18% | 0.13%(+0.046)#129 | 0.087%(+0.090)#1,577 |
| 73. | Camp Springs | 0.16% | 0.13%(+0.032)#130 | 0.087%(+0.077)#1,578 |
| 74. | North Laurel | 0.15% | 0.13%(+0.020)#131 | 0.087%(+0.065)#1,579 |
| 75. | Summerfield | 0.15% | 0.13%(+0.019)#132 | 0.087%(+0.064)#1,580 |
| 76. | North Potomac | 0.15% | 0.13%(+0.014)#133 | 0.087%(+0.059)#1,581 |
| 77. | Clarksburg | 0.14% | 0.13%(+0.013)#134 | 0.087%(+0.058)#1,582 |
| 78. | Thurmont | 0.14% | 0.13%(+0.011)#135 | 0.087%(+0.056)#1,583 |
| 79. | Marlboro Village | 0.13% | 0.13%(-0.000)#136 | 0.087%(+0.045)#1,584 |
| 80. | North Brentwood | 0.13% | 0.13%(-0.001)#137 | 0.087%(+0.044)#1,585 |
| 81. | Urbana | 0.13% | 0.13%(-0.004)#138 | 0.087%(+0.040)#1,586 |
| 82. | Owings Mills | 0.12% | 0.13%(-0.009)#139 | 0.087%(+0.036)#1,587 |
| 83. | Seabrook | 0.11% | 0.13%(-0.018)#140 | 0.087%(+0.027)#1,588 |
| 84. | Parole | 0.11% | 0.13%(-0.018)#141 | 0.087%(+0.027)#1,589 |
| 85. | Leisure World | 0.11% | 0.13%(-0.020)#142 | 0.087%(+0.025)#1,590 |
| 86. | Brooklyn Park | 0.11% | 0.13%(-0.025)#143 | 0.087%(+0.020)#1,591 |
| 87. | Riviera Beach | 0.099% | 0.13%(-0.033)#144 | 0.087%(+0.012)#1,592 |
| 88. | Flower Hill | 0.096% | 0.13%(-0.036)#145 | 0.087%(+0.009)#1,593 |
| 89. | Waldorf | 0.093% | 0.13%(-0.039)#146 | 0.087%(+0.006)#1,594 |
| 90. | Columbia | 0.091% | 0.13%(-0.041)#147 | 0.087%(+0.004)#1,595 |
| 91. | Fort Washington | 0.085% | 0.13%(-0.046)#148 | 0.087%(-0.002)#1,596 |
| 92. | Severna Park | 0.084% | 0.13%(-0.048)#149 | 0.087%(-0.003)#1,597 |
| 93. | Maryland City | 0.082% | 0.13%(-0.050)#150 | 0.087%(-0.005)#1,598 |
| 94. | Baltimore | 0.080% | 0.13%(-0.052)#151 | 0.087%(-0.007)#1,599 |
| 95. | Hillcrest Heights | 0.079% | 0.13%(-0.053)#152 | 0.087%(-0.008)#1,600 |
| 96. | Langley Park | 0.078% | 0.13%(-0.054)#153 | 0.087%(-0.009)#1,601 |
| 97. | Westminster | 0.075% | 0.13%(-0.057)#154 | 0.087%(-0.012)#1,602 |
| 98. | Middle River | 0.074% | 0.13%(-0.058)#155 | 0.087%(-0.013)#1,603 |
| 99. | Greenbelt | 0.073% | 0.13%(-0.059)#156 | 0.087%(-0.014)#1,604 |
| 100. | Cloverly | 0.073% | 0.13%(-0.059)#157 | 0.087%(-0.014)#1,605 |
Common Questions
What are the Top 10 Cities with the Highest Percentage of Immigrants from Guyana in Maryland?
Top 10 Cities with the Highest Percentage of Immigrants from Guyana in Maryland are:
#1
3.25%
#2
2.46%
#3
1.91%
#4
1.90%
#5
1.58%
#6
1.44%
#7
1.15%
#8
1.00%
#9
0.98%
#10
0.95%
What city has the Highest Percentage of Immigrants from Guyana in Maryland?
Fairwood has the Highest Percentage of Immigrants from Guyana in Maryland with 3.25%.
What is the Percentage of Immigrants from Guyana in the State of Maryland?
Percentage of Immigrants from Guyana in Maryland is 0.13%.
What is the Percentage of Immigrants from Guyana in the United States?
Percentage of Immigrants from Guyana in the United States is 0.087%.