Cities with the Most Immigrants from Sierra Leone in Maryland
RELATED REPORTS & OPTIONS
Sierra Leone
Maryland
Compare Cities
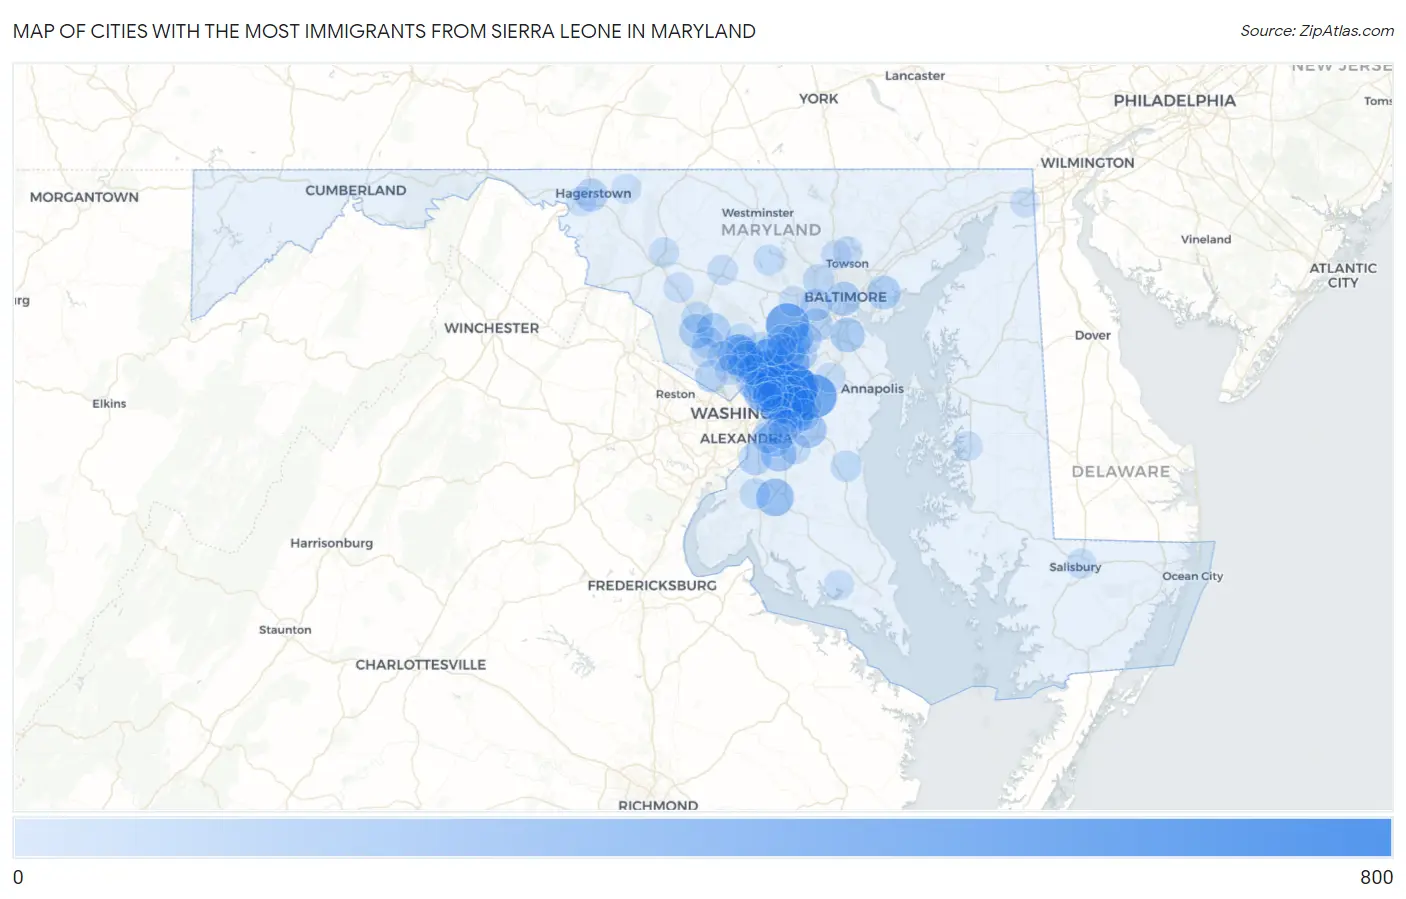
Map of Cities with the Most Immigrants from Sierra Leone in Maryland
0
800
Cities with the Most Immigrants from Sierra Leone in Maryland
| City | Sierra Leone | vs State | vs National | |
| 1. | Seabrook | 696 | 10,233(6.80%)#1 | 47,598(1.46%)#6 |
| 2. | Bowie | 475 | 10,233(4.64%)#2 | 47,598(1.00%)#9 |
| 3. | Columbia | 465 | 10,233(4.54%)#3 | 47,598(0.98%)#10 |
| 4. | Fairland | 419 | 10,233(4.09%)#4 | 47,598(0.88%)#12 |
| 5. | Beltsville | 404 | 10,233(3.95%)#5 | 47,598(0.85%)#13 |
| 6. | Aspen Hill | 394 | 10,233(3.85%)#6 | 47,598(0.83%)#14 |
| 7. | Lake Arbor | 334 | 10,233(3.26%)#7 | 47,598(0.70%)#16 |
| 8. | Landover | 313 | 10,233(3.06%)#8 | 47,598(0.66%)#20 |
| 9. | Greenbelt | 288 | 10,233(2.81%)#9 | 47,598(0.61%)#27 |
| 10. | Chillum | 271 | 10,233(2.65%)#10 | 47,598(0.57%)#28 |
| 11. | Waldorf | 260 | 10,233(2.54%)#11 | 47,598(0.55%)#29 |
| 12. | South Laurel | 243 | 10,233(2.37%)#12 | 47,598(0.51%)#33 |
| 13. | White Oak | 243 | 10,233(2.37%)#13 | 47,598(0.51%)#34 |
| 14. | Bladensburg | 231 | 10,233(2.26%)#14 | 47,598(0.49%)#36 |
| 15. | North Laurel | 190 | 10,233(1.86%)#15 | 47,598(0.40%)#44 |
| 16. | Marlboro Village | 188 | 10,233(1.84%)#16 | 47,598(0.39%)#45 |
| 17. | Clinton | 186 | 10,233(1.82%)#17 | 47,598(0.39%)#46 |
| 18. | Glenmont | 174 | 10,233(1.70%)#18 | 47,598(0.37%)#54 |
| 19. | Largo | 164 | 10,233(1.60%)#19 | 47,598(0.34%)#58 |
| 20. | Glen Burnie | 157 | 10,233(1.53%)#20 | 47,598(0.33%)#62 |
| 21. | Glenn Dale | 142 | 10,233(1.39%)#21 | 47,598(0.30%)#70 |
| 22. | Calverton | 140 | 10,233(1.37%)#22 | 47,598(0.29%)#72 |
| 23. | Baltimore | 139 | 10,233(1.36%)#23 | 47,598(0.29%)#73 |
| 24. | Germantown | 136 | 10,233(1.33%)#24 | 47,598(0.29%)#76 |
| 25. | Essex | 132 | 10,233(1.29%)#25 | 47,598(0.28%)#79 |
| 26. | Montgomery Village | 129 | 10,233(1.26%)#26 | 47,598(0.27%)#81 |
| 27. | New Carrollton | 127 | 10,233(1.24%)#27 | 47,598(0.27%)#82 |
| 28. | Glenarden | 118 | 10,233(1.15%)#28 | 47,598(0.25%)#89 |
| 29. | Woodlawn Cdp Prince George S County | 114 | 10,233(1.11%)#29 | 47,598(0.24%)#93 |
| 30. | Camp Springs | 112 | 10,233(1.09%)#30 | 47,598(0.24%)#97 |
| 31. | Fort Washington | 109 | 10,233(1.07%)#31 | 47,598(0.23%)#100 |
| 32. | Hagerstown | 105 | 10,233(1.03%)#32 | 47,598(0.22%)#103 |
| 33. | Laurel | 105 | 10,233(1.03%)#33 | 47,598(0.22%)#104 |
| 34. | Elkridge | 104 | 10,233(1.02%)#34 | 47,598(0.22%)#107 |
| 35. | Cheverly | 93 | 10,233(0.91%)#35 | 47,598(0.20%)#115 |
| 36. | Adelphi | 90 | 10,233(0.88%)#36 | 47,598(0.19%)#118 |
| 37. | Silver Spring | 87 | 10,233(0.85%)#37 | 47,598(0.18%)#121 |
| 38. | Lanham | 85 | 10,233(0.83%)#38 | 47,598(0.18%)#124 |
| 39. | Potomac | 83 | 10,233(0.81%)#39 | 47,598(0.17%)#127 |
| 40. | Maryland City | 83 | 10,233(0.81%)#40 | 47,598(0.17%)#128 |
| 41. | Silver Hill | 82 | 10,233(0.80%)#41 | 47,598(0.17%)#132 |
| 42. | Mount Rainier | 79 | 10,233(0.77%)#42 | 47,598(0.17%)#135 |
| 43. | Springdale | 76 | 10,233(0.74%)#43 | 47,598(0.16%)#139 |
| 44. | Leisure World | 70 | 10,233(0.68%)#44 | 47,598(0.15%)#152 |
| 45. | Catonsville | 67 | 10,233(0.65%)#45 | 47,598(0.14%)#157 |
| 46. | Gaithersburg | 62 | 10,233(0.61%)#46 | 47,598(0.13%)#167 |
| 47. | Lochearn | 61 | 10,233(0.60%)#47 | 47,598(0.13%)#170 |
| 48. | Mitchellville | 61 | 10,233(0.60%)#48 | 47,598(0.13%)#171 |
| 49. | Kettering | 60 | 10,233(0.59%)#49 | 47,598(0.13%)#176 |
| 50. | East Riverdale | 59 | 10,233(0.58%)#50 | 47,598(0.12%)#181 |
| 51. | Takoma Park | 57 | 10,233(0.56%)#51 | 47,598(0.12%)#183 |
| 52. | Savage | 56 | 10,233(0.55%)#52 | 47,598(0.12%)#186 |
| 53. | Temple Hills | 55 | 10,233(0.54%)#53 | 47,598(0.12%)#192 |
| 54. | Langley Park | 54 | 10,233(0.53%)#54 | 47,598(0.11%)#193 |
| 55. | Burtonsville | 47 | 10,233(0.46%)#55 | 47,598(0.10%)#209 |
| 56. | Summerfield | 46 | 10,233(0.45%)#56 | 47,598(0.10%)#214 |
| 57. | Owings | 45 | 10,233(0.44%)#57 | 47,598(0.09%)#220 |
| 58. | Clarksburg | 43 | 10,233(0.42%)#58 | 47,598(0.09%)#225 |
| 59. | Spencerville | 41 | 10,233(0.40%)#59 | 47,598(0.09%)#231 |
| 60. | Rosaryville | 39 | 10,233(0.38%)#60 | 47,598(0.08%)#241 |
| 61. | Bensville | 37 | 10,233(0.36%)#61 | 47,598(0.08%)#248 |
| 62. | Wheaton | 34 | 10,233(0.33%)#62 | 47,598(0.07%)#259 |
| 63. | Jessup | 33 | 10,233(0.32%)#63 | 47,598(0.07%)#262 |
| 64. | Olney | 29 | 10,233(0.28%)#64 | 47,598(0.06%)#276 |
| 65. | Eldersburg | 29 | 10,233(0.28%)#65 | 47,598(0.06%)#277 |
| 66. | College Park | 28 | 10,233(0.27%)#66 | 47,598(0.06%)#285 |
| 67. | Burnt Mills | 28 | 10,233(0.27%)#67 | 47,598(0.06%)#288 |
| 68. | Layhill | 22 | 10,233(0.21%)#68 | 47,598(0.05%)#317 |
| 69. | Mount Airy | 20 | 10,233(0.20%)#69 | 47,598(0.04%)#343 |
| 70. | Woodmore | 20 | 10,233(0.20%)#70 | 47,598(0.04%)#344 |
| 71. | Frederick | 18 | 10,233(0.18%)#71 | 47,598(0.04%)#356 |
| 72. | Hyattsville | 18 | 10,233(0.18%)#72 | 47,598(0.04%)#358 |
| 73. | Edmonston | 16 | 10,233(0.16%)#73 | 47,598(0.03%)#375 |
| 74. | Scaggsville | 15 | 10,233(0.15%)#74 | 47,598(0.03%)#381 |
| 75. | Fairmount Heights | 15 | 10,233(0.15%)#75 | 47,598(0.03%)#382 |
| 76. | Ellicott City | 14 | 10,233(0.14%)#76 | 47,598(0.03%)#387 |
| 77. | Rockville | 12 | 10,233(0.12%)#77 | 47,598(0.03%)#404 |
| 78. | Urbana | 12 | 10,233(0.12%)#78 | 47,598(0.03%)#412 |
| 79. | Crofton | 11 | 10,233(0.11%)#79 | 47,598(0.02%)#421 |
| 80. | Forestville | 11 | 10,233(0.11%)#80 | 47,598(0.02%)#426 |
| 81. | Mays Chapel | 10 | 10,233(0.10%)#81 | 47,598(0.02%)#434 |
| 82. | Brentwood | 10 | 10,233(0.10%)#82 | 47,598(0.02%)#435 |
| 83. | Woodlawn Cdp Baltimore County | 9 | 10,233(0.09%)#83 | 47,598(0.02%)#442 |
| 84. | District Heights | 8 | 10,233(0.08%)#84 | 47,598(0.02%)#460 |
| 85. | North Bethesda | 7 | 10,233(0.07%)#85 | 47,598(0.01%)#467 |
| 86. | Leonardtown | 7 | 10,233(0.07%)#86 | 47,598(0.01%)#472 |
| 87. | Salisbury | 6 | 10,233(0.06%)#87 | 47,598(0.01%)#473 |
| 88. | North Potomac | 5 | 10,233(0.05%)#88 | 47,598(0.01%)#485 |
| 89. | Timonium | 5 | 10,233(0.05%)#89 | 47,598(0.01%)#488 |
| 90. | Easton | 4 | 10,233(0.04%)#90 | 47,598(0.01%)#498 |
| 91. | Halfway | 4 | 10,233(0.04%)#91 | 47,598(0.01%)#499 |
| 92. | Smithsburg | 4 | 10,233(0.04%)#92 | 47,598(0.01%)#501 |
| 93. | Kemp Mill | 3 | 10,233(0.03%)#93 | 47,598(0.01%)#511 |
| 94. | Morningside | 3 | 10,233(0.03%)#94 | 47,598(0.01%)#515 |
| 95. | Elkton | 2 | 10,233(0.02%)#95 | 47,598(0.00%)#519 |
| 96. | Flower Hill | 2 | 10,233(0.02%)#96 | 47,598(0.00%)#520 |
| 97. | West Laurel | 2 | 10,233(0.02%)#97 | 47,598(0.00%)#523 |
Common Questions
What are the Top 10 Cities with the Most Immigrants from Sierra Leone in Maryland?
Top 10 Cities with the Most Immigrants from Sierra Leone in Maryland are:
#1
696
#2
475
#3
465
#4
419
#5
404
#6
394
#7
334
#8
313
#9
288
#10
271
What city has the Most Immigrants from Sierra Leone in Maryland?
Seabrook has the Most Immigrants from Sierra Leone in Maryland with 696.
What is the Total Immigrants from Sierra Leone in the State of Maryland?
Total Immigrants from Sierra Leone in Maryland is 10,233.
What is the Total Immigrants from Sierra Leone in the United States?
Total Immigrants from Sierra Leone in the United States is 47,598.