Cities with the Highest Percentage of Cape Verdean Population in Maryland

RELATED REPORTS & OPTIONS

Cape Verdean
Population
Families and Households
Female Fertility
Female Fertility (Unmarried)
Race (Community Size)
Race (Percentage)
Ancestry (Community Size)
AfghanAfricanAlaska NativeAlaskan AthabascanAlbanianAleutAlsatianAmericanApacheArabArapahoArgentineanArmenianAssyrian / Chaldean / SyriacAustralianAustrianBahamianBangladeshiBarbadianBasqueBelgianBelizeanBermudanBhutaneseBlackfeetBolivianBrazilianBritishBritish West IndianBulgarianBurmeseCajunCambodianCanadianCape VerdeanCarpatho RusynCelticCentral AmericanCentral American IndianCherokeeCheyenneChickasawChileanChineseChippewaChoctawColombianColvilleComancheCosta RicanCreeCreekCroatianCrowCubanCypriotCzechCzechoslovakianDanishDelawareDominicanDutchDutch West IndianEastern EuropeanEcuadorianEgyptianEnglishEstonianEthiopianEuropeanFijianFilipinoFinnishFrenchFrench American IndianFrench CanadianGermanGerman RussianGhanaianGreekGuamanian / ChamorroGuatemalanGuyaneseHaitianHmongHonduranHopiHoumaHungarianIcelanderIndian (Asian)IndonesianInupiatIranianIraqiIrishIroquoisIsraeliItalianJamaicanJapaneseJordanianKenyanKiowaKoreanLaotianLatvianLebaneseLiberianLithuanianLumbeeLuxembourgerMacedonianMalaysianMalteseMarshalleseMenomineeMexicanMexican American IndianMongolianMoroccanNative HawaiianNavajoNepaleseNew ZealanderNicaraguanNigerianNorthern EuropeanNorwegianOkinawanOsageOttawaPaiutePakistaniPalestinianPanamanianParaguayanPennsylvania GermanPeruvianPimaPolishPortuguesePotawatomiPuebloPuerto RicanPuget Sound SalishRomanianRussianSalvadoranSamoanScandinavianScotch-IrishScottishSeminoleSenegaleseSerbianShoshoneSierra LeoneanSiouxSlavicSlovakSloveneSomaliSouth AfricanSouth AmericanSouth American IndianSoviet UnionSpaniardSpanishSpanish AmericanSpanish American IndianSri LankanSubsaharan AfricanSudaneseSwedishSwissSyrianTaiwaneseThaiTlingit-HaidaTohono O'OdhamTonganTrinidadian and TobagonianTsimshianTurkishU.S. Virgin IslanderUgandanUkrainianUruguayanUteVenezuelanVietnameseWelshWest IndianYakamaYaquiYugoslavianYumanYup'ikZimbabwean
Ancestry (Percentage)
AfghanAfricanAlaska NativeAlaskan AthabascanAlbanianAleutAlsatianAmericanApacheArabArapahoArgentineanArmenianAssyrian / Chaldean / SyriacAustralianAustrianBahamianBangladeshiBarbadianBasqueBelgianBelizeanBermudanBhutaneseBlackfeetBolivianBrazilianBritishBritish West IndianBulgarianBurmeseCajunCambodianCanadianCape VerdeanCarpatho RusynCelticCentral AmericanCentral American IndianCherokeeCheyenneChickasawChileanChineseChippewaChoctawColombianColvilleComancheCosta RicanCreeCreekCroatianCrowCubanCypriotCzechCzechoslovakianDanishDelawareDominicanDutchDutch West IndianEastern EuropeanEcuadorianEgyptianEnglishEstonianEthiopianEuropeanFijianFilipinoFinnishFrenchFrench American IndianFrench CanadianGermanGerman RussianGhanaianGreekGuamanian / ChamorroGuatemalanGuyaneseHaitianHmongHonduranHopiHoumaHungarianIcelanderIndian (Asian)IndonesianInupiatIranianIraqiIrishIroquoisIsraeliItalianJamaicanJapaneseJordanianKenyanKiowaKoreanLaotianLatvianLebaneseLiberianLithuanianLumbeeLuxembourgerMacedonianMalaysianMalteseMarshalleseMenomineeMexicanMexican American IndianMongolianMoroccanNative HawaiianNavajoNepaleseNew ZealanderNicaraguanNigerianNorthern EuropeanNorwegianOkinawanOsageOttawaPaiutePakistaniPalestinianPanamanianParaguayanPennsylvania GermanPeruvianPimaPolishPortuguesePotawatomiPuebloPuerto RicanPuget Sound SalishRomanianRussianSalvadoranSamoanScandinavianScotch-IrishScottishSeminoleSenegaleseSerbianShoshoneSierra LeoneanSiouxSlavicSlovakSloveneSomaliSouth AfricanSouth AmericanSouth American IndianSoviet UnionSpaniardSpanishSpanish AmericanSpanish American IndianSri LankanSubsaharan AfricanSudaneseSwedishSwissSyrianTaiwaneseThaiTlingit-HaidaTohono O'OdhamTonganTrinidadian and TobagonianTsimshianTurkishU.S. Virgin IslanderUgandanUkrainianUruguayanUteVenezuelanVietnameseWelshWest IndianYakamaYaquiYugoslavianYumanYup'ikZimbabwean
Immigrant Origin (Total)
AfghanistanAfricaAlbaniaArgentinaArmeniaAsiaAustraliaAustriaAzoresBahamasBangladeshBarbadosBelarusBelgiumBelizeBoliviaBosnia and HerzegovinaBrazilBulgariaBurma / MyanmarCabo VerdeCambodiaCameroonCanadaCaribbeanCentral AmericaChileChinaColombiaCongoCosta RicaCroatiaCubaCzechoslovakiaDenmarkDominicaDominican RepublicEastern AfricaEastern AsiaEastern EuropeEcuadorEgyptEl SalvadorEnglandEritreaEthiopiaEuropeFijiFranceGermanyGhanaGreeceGrenadaGuatemalaGuyanaHaitiHondurasHong KongHungaryIndiaIndonesiaIranIraqIrelandIsraelItalyJamaicaJapanJordanKazakhstanKenyaKoreaKuwaitLaosLatin AmericaLatviaLebanonLiberiaLithuaniaMalaysiaMexicoMicronesiaMiddle AfricaMoldovaMoroccoNepalNetherlandsNicaraguaNigeriaNorth MacedoniaNorthern AfricaNorthern EuropeNorwayOceaniaPakistanPanamaPeruPhilippinesPolandPortugalRomaniaRussiaSaudi ArabiaScotlandSenegalSerbiaSierra LeoneSingaporeSomaliaSouth AfricaSouth AmericaSouth Central AsiaSouth Eastern AsiaSouthern EuropeSpainSri LankaSt. Vincent and the GrenadinesSudanSwedenSwitzerlandSyriaTaiwanThailandTrinidad and TobagoTurkeyUgandaUkraineUruguayUzbekistanVenezuelaVietnamWest IndiesWestern AfricaWestern AsiaWestern EuropeYemenZaireZimbabwe
Immigrant Origin (Percentage)
AfghanistanAfricaAlbaniaArgentinaArmeniaAsiaAustraliaAustriaAzoresBahamasBangladeshBarbadosBelarusBelgiumBelizeBoliviaBosnia and HerzegovinaBrazilBulgariaBurma / MyanmarCabo VerdeCambodiaCameroonCanadaCaribbeanCentral AmericaChileChinaColombiaCongoCosta RicaCroatiaCubaCzechoslovakiaDenmarkDominicaDominican RepublicEastern AfricaEastern AsiaEastern EuropeEcuadorEgyptEl SalvadorEnglandEritreaEthiopiaEuropeFijiFranceGermanyGhanaGreeceGrenadaGuatemalaGuyanaHaitiHondurasHong KongHungaryIndiaIndonesiaIranIraqIrelandIsraelItalyJamaicaJapanJordanKazakhstanKenyaKoreaKuwaitLaosLatin AmericaLatviaLebanonLiberiaLithuaniaMalaysiaMexicoMicronesiaMiddle AfricaMoldovaMoroccoNepalNetherlandsNicaraguaNigeriaNorth MacedoniaNorthern AfricaNorthern EuropeNorwayOceaniaPakistanPanamaPeruPhilippinesPolandPortugalRomaniaRussiaSaudi ArabiaScotlandSenegalSerbiaSierra LeoneSingaporeSomaliaSouth AfricaSouth AmericaSouth Central AsiaSouth Eastern AsiaSouthern EuropeSpainSri LankaSt. Vincent and the GrenadinesSudanSwedenSwitzerlandSyriaTaiwanThailandTrinidad and TobagoTurkeyUgandaUkraineUruguayUzbekistanVenezuelaVietnamWest IndiesWestern AfricaWestern AsiaWestern EuropeYemenZaireZimbabwe
Income
Income (Families)
Income (Households)
Poverty
Poverty (Families)
Unemployment
Employment Occupations
Employment Industries
Employer Class
Commute Time
Commute Means
School Enrollment
Education by Degree Field
Occupancy
Finances
Physical Characteristics
Maryland
Compare Cities
Comparison Subject

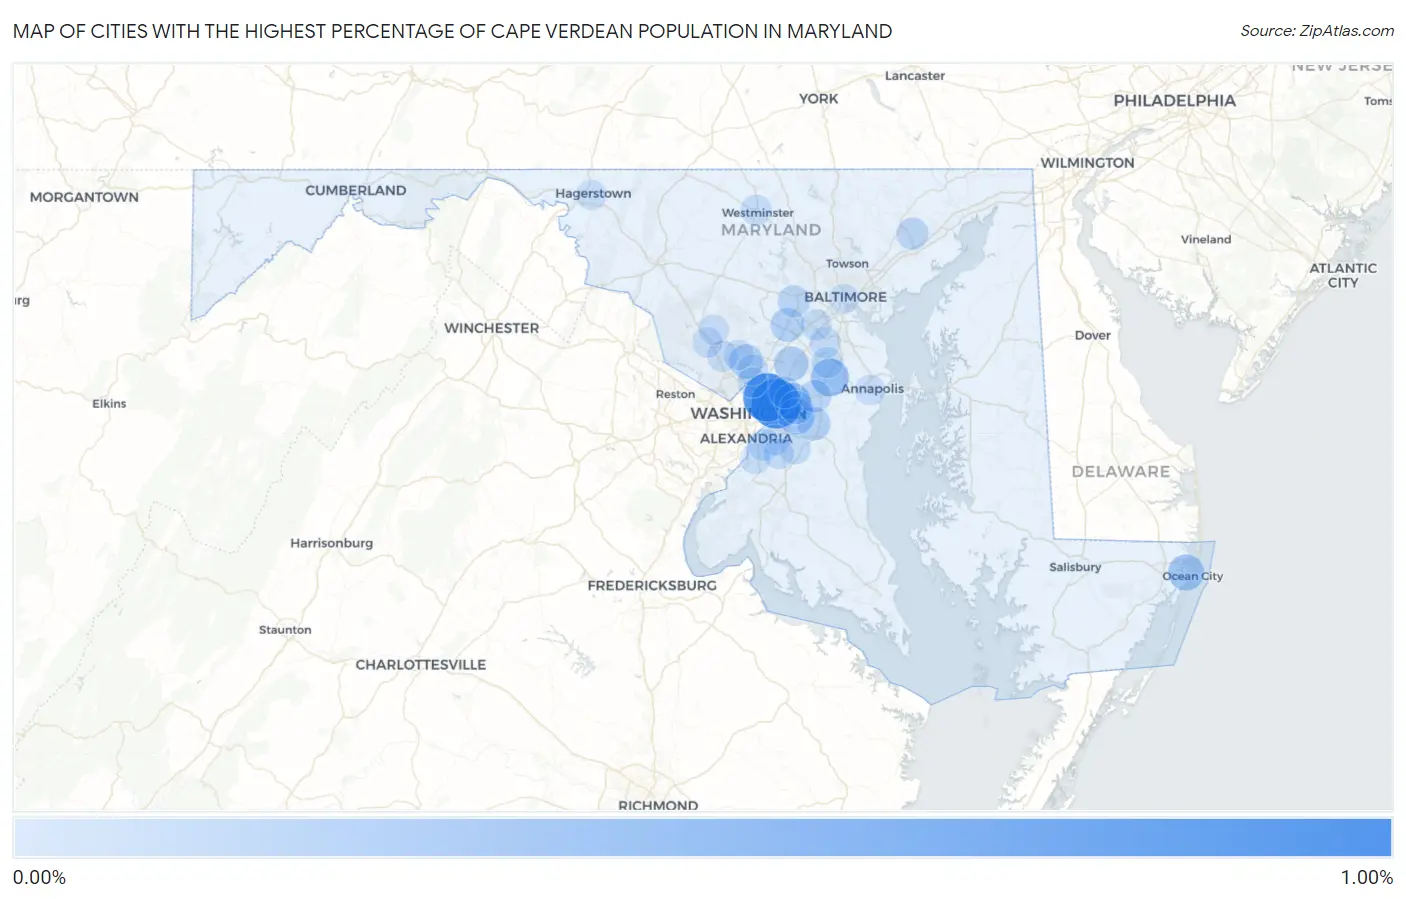
Map of Cities with the Highest Percentage of Cape Verdean Population in Maryland

0.00%
1.00%
Cities with the Highest Percentage of Cape Verdean Population in Maryland Map

Cities with the Highest Percentage of Cape Verdean Population in Maryland

City Cape Verdean vs State vs National
1.Cheverly0.95%0.021%(+0.925)#10.032%(+0.914)#53
2.Brentwood0.90%0.021%(+0.878)#20.032%(+0.867)#56
3.Crofton0.37%0.021%(+0.350)#30.032%(+0.339)#113
4.Springdale0.30%0.021%(+0.282)#40.032%(+0.271)#131
5.Largo0.29%0.021%(+0.268)#50.032%(+0.257)#133
6.West Ocean City0.29%0.021%(+0.265)#60.032%(+0.254)#137
7.South Laurel0.20%0.021%(+0.183)#70.032%(+0.172)#168
8.Glenmont0.19%0.021%(+0.165)#80.032%(+0.154)#178
9.Columbia0.18%0.021%(+0.160)#90.032%(+0.149)#182
10.Brock Hall0.16%0.021%(+0.139)#100.032%(+0.127)#195
11.Lake Arbor0.15%0.021%(+0.127)#110.032%(+0.115)#206
12.Bowie0.12%0.021%(+0.098)#120.032%(+0.087)#229
13.Ellicott City0.11%0.021%(+0.088)#130.032%(+0.076)#240
14.Bel Air South0.10%0.021%(+0.082)#140.032%(+0.071)#244
15.New Carrollton0.081%0.021%(+0.060)#150.032%(+0.049)#271
16.Severn0.060%0.021%(+0.039)#160.032%(+0.028)#308
17.Rosaryville0.058%0.021%(+0.037)#170.032%(+0.026)#311
18.Kemp Mill0.057%0.021%(+0.036)#180.032%(+0.024)#315
19.Odenton0.056%0.021%(+0.035)#190.032%(+0.023)#319
20.Oxon Hill0.054%0.021%(+0.033)#200.032%(+0.022)#324
21.Elkridge0.048%0.021%(+0.027)#210.032%(+0.015)#335
22.Camp Springs0.043%0.021%(+0.022)#220.032%(+0.011)#349
23.Fort Washington0.039%0.021%(+0.018)#230.032%(+0.006)#362
24.Westminster0.035%0.021%(+0.014)#240.032%(+0.003)#367
25.Clinton0.035%0.021%(+0.014)#250.032%(+0.003)#368
26.Rockville0.034%0.021%(+0.013)#260.032%(+0.002)#373
27.Gaithersburg0.032%0.021%(+0.011)#270.032%(-0.000)#383
28.Aspen Hill0.028%0.021%(+0.007)#280.032%(-0.005)#396
29.Annapolis0.025%0.021%(+0.004)#290.032%(-0.008)#413
30.Montgomery Village0.020%0.021%(-0.001)#300.032%(-0.012)#433
31.Hagerstown0.016%0.021%(-0.005)#310.032%(-0.016)#466
32.Silver Spring0.013%0.021%(-0.007)#320.032%(-0.019)#479
33.Baltimore0.011%0.021%(-0.010)#330.032%(-0.021)#496

Common Questions

What are the Top 10 Cities with the Highest Percentage of Cape Verdean Population in Maryland?
Top 10 Cities with the Highest Percentage of Cape Verdean Population in Maryland are:
#1
0.95%
#2
0.90%
#3
0.37%
#4
0.30%
#5
0.29%
#6
0.29%
#7
0.20%
#8
0.19%
#9
0.18%
#10
0.16%
What city has the Highest Percentage of Cape Verdean Population in Maryland?
Cheverly has the Highest Percentage of Cape Verdean Population in Maryland with 0.95%.
What is the Percentage of Cape Verdean Population in the State of Maryland?
Percentage of Cape Verdean Population in Maryland is 0.021%.
What is the Percentage of Cape Verdean Population in the United States?
Percentage of Cape Verdean Population in the United States is 0.032%.