Cities with the Lowest Poverty Level Among Children Under the Age of 5 in Maryland
RELATED REPORTS & OPTIONS
Lowest Poverty | Child 0-5
Maryland
Compare Cities
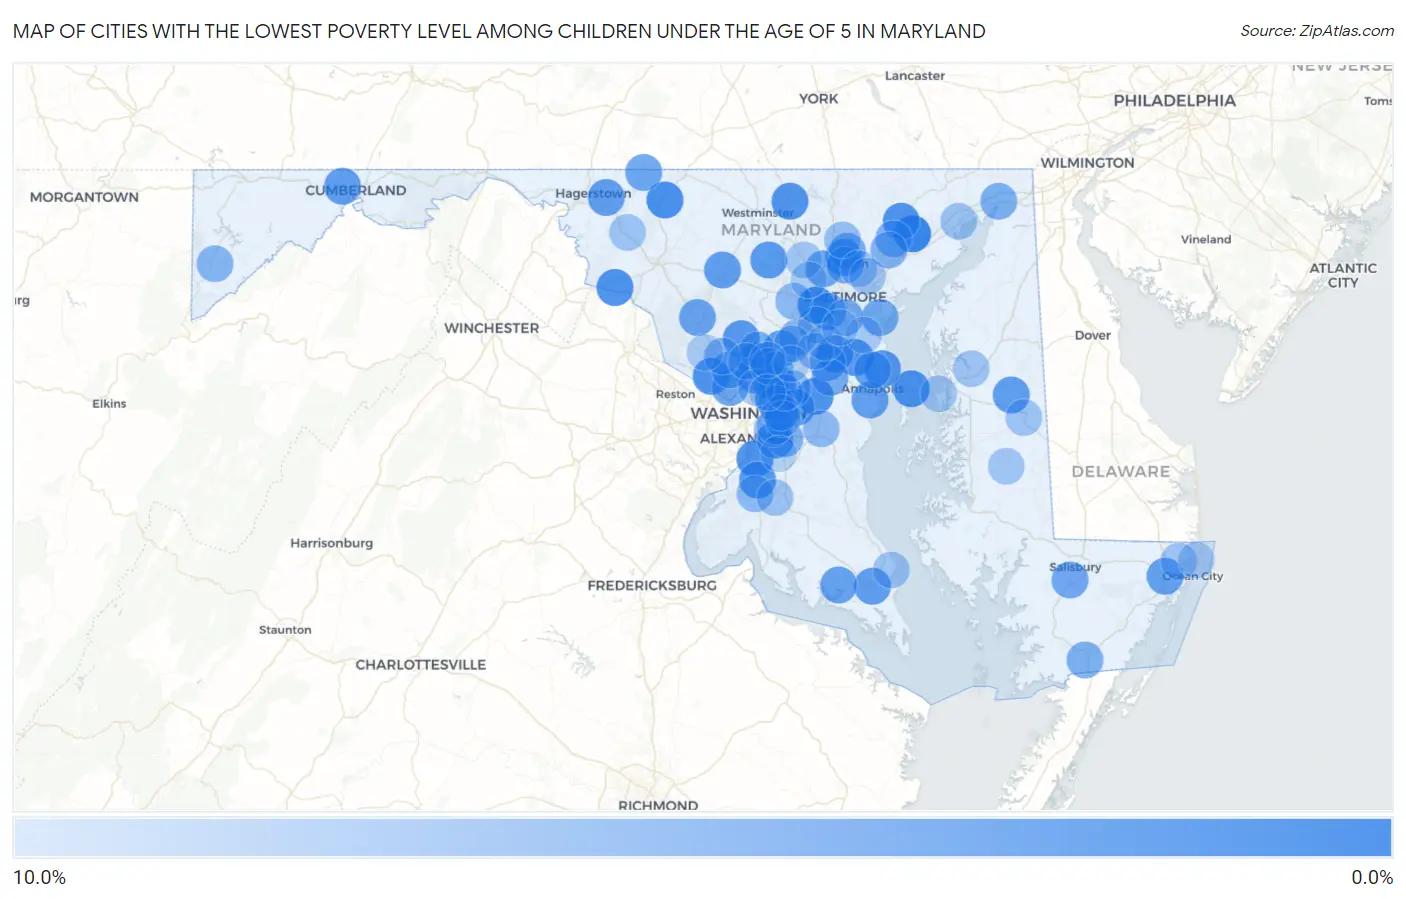
Map of Cities with the Lowest Poverty Level Among Children Under the Age of 5 in Maryland
10.0%
0.0%
Cities with the Lowest Poverty Level Among Children Under the Age of 5 in Maryland
| City | Child Poverty | vs State | vs National | |
| 1. | Bel Air South | 0.37% | 12.3%(-11.9)#1 | 18.1%(-17.7)#10 |
| 2. | Catonsville | 1.4% | 12.3%(-10.8)#2 | 18.1%(-16.6)#190 |
| 3. | Bladensburg | 1.5% | 12.3%(-10.8)#3 | 18.1%(-16.6)#197 |
| 4. | Thurmont | 1.5% | 12.3%(-10.7)#4 | 18.1%(-16.5)#213 |
| 5. | Berwyn Heights | 1.6% | 12.3%(-10.6)#5 | 18.1%(-16.4)#235 |
| 6. | Stevensville | 1.7% | 12.3%(-10.6)#6 | 18.1%(-16.4)#247 |
| 7. | Brunswick | 1.8% | 12.3%(-10.5)#7 | 18.1%(-16.3)#286 |
| 8. | Bowie | 1.8% | 12.3%(-10.4)#8 | 18.1%(-16.2)#297 |
| 9. | Colesville | 1.9% | 12.3%(-10.4)#9 | 18.1%(-16.2)#301 |
| 10. | Fort Washington | 1.9% | 12.3%(-10.4)#10 | 18.1%(-16.2)#305 |
| 11. | Bel Air North | 1.9% | 12.3%(-10.4)#11 | 18.1%(-16.2)#306 |
| 12. | Hampstead | 1.9% | 12.3%(-10.4)#12 | 18.1%(-16.2)#311 |
| 13. | Potomac | 1.9% | 12.3%(-10.3)#13 | 18.1%(-16.2)#313 |
| 14. | Severna Park | 2.2% | 12.3%(-10.0)#14 | 18.1%(-15.8)#419 |
| 15. | Cape St Claire | 2.3% | 12.3%(-9.92)#15 | 18.1%(-15.7)#458 |
| 16. | Gambrills | 2.4% | 12.3%(-9.90)#16 | 18.1%(-15.7)#465 |
| 17. | Olney | 2.5% | 12.3%(-9.74)#17 | 18.1%(-15.5)#508 |
| 18. | Lake Arbor | 2.6% | 12.3%(-9.70)#18 | 18.1%(-15.5)#527 |
| 19. | Camp Springs | 2.7% | 12.3%(-9.57)#19 | 18.1%(-15.4)#572 |
| 20. | Eldersburg | 2.7% | 12.3%(-9.57)#20 | 18.1%(-15.4)#573 |
| 21. | Accokeek | 2.7% | 12.3%(-9.53)#21 | 18.1%(-15.3)#585 |
| 22. | Lutherville | 2.8% | 12.3%(-9.50)#22 | 18.1%(-15.3)#602 |
| 23. | West Laurel | 2.9% | 12.3%(-9.34)#23 | 18.1%(-15.1)#675 |
| 24. | Wildewood | 2.9% | 12.3%(-9.31)#24 | 18.1%(-15.1)#689 |
| 25. | La Vale | 3.0% | 12.3%(-9.22)#25 | 18.1%(-15.0)#724 |
| 26. | Ridgely | 3.1% | 12.3%(-9.16)#26 | 18.1%(-15.0)#742 |
| 27. | California | 3.1% | 12.3%(-9.11)#27 | 18.1%(-14.9)#767 |
| 28. | Mount Airy | 3.2% | 12.3%(-9.10)#28 | 18.1%(-14.9)#770 |
| 29. | Robinwood | 3.2% | 12.3%(-9.09)#29 | 18.1%(-14.9)#771 |
| 30. | Brown Station | 3.2% | 12.3%(-9.05)#30 | 18.1%(-14.9)#794 |
| 31. | Annapolis Neck | 3.3% | 12.3%(-8.95)#31 | 18.1%(-14.8)#834 |
| 32. | Four Corners | 3.4% | 12.3%(-8.90)#32 | 18.1%(-14.7)#854 |
| 33. | Berlin | 3.4% | 12.3%(-8.81)#33 | 18.1%(-14.6)#890 |
| 34. | Arnold | 3.5% | 12.3%(-8.79)#34 | 18.1%(-14.6)#897 |
| 35. | Leonardtown | 3.6% | 12.3%(-8.66)#35 | 18.1%(-14.5)#954 |
| 36. | Clarksburg | 3.6% | 12.3%(-8.65)#36 | 18.1%(-14.5)#955 |
| 37. | Arbutus | 4.0% | 12.3%(-8.27)#37 | 18.1%(-14.1)#1,124 |
| 38. | Highfield Cascade | 4.0% | 12.3%(-8.26)#38 | 18.1%(-14.1)#1,129 |
| 39. | Bethesda | 4.0% | 12.3%(-8.25)#39 | 18.1%(-14.1)#1,137 |
| 40. | Pikesville | 4.0% | 12.3%(-8.22)#40 | 18.1%(-14.0)#1,145 |
| 41. | Odenton | 4.2% | 12.3%(-8.09)#41 | 18.1%(-13.9)#1,184 |
| 42. | Fruitland | 4.2% | 12.3%(-8.07)#42 | 18.1%(-13.9)#1,217 |
| 43. | North Bethesda | 4.4% | 12.3%(-7.87)#43 | 18.1%(-13.7)#1,285 |
| 44. | Edgemere | 4.4% | 12.3%(-7.82)#44 | 18.1%(-13.6)#1,308 |
| 45. | College Park | 4.7% | 12.3%(-7.59)#45 | 18.1%(-13.4)#1,412 |
| 46. | Timonium | 4.7% | 12.3%(-7.59)#46 | 18.1%(-13.4)#1,413 |
| 47. | Crofton | 4.7% | 12.3%(-7.58)#47 | 18.1%(-13.4)#1,415 |
| 48. | Brooklyn Park | 4.9% | 12.3%(-7.40)#48 | 18.1%(-13.2)#1,507 |
| 49. | Cloverly | 4.9% | 12.3%(-7.31)#49 | 18.1%(-13.1)#1,546 |
| 50. | North East | 5.0% | 12.3%(-7.29)#50 | 18.1%(-13.1)#1,555 |
| 51. | Pocomoke City | 5.1% | 12.3%(-7.18)#51 | 18.1%(-13.0)#1,604 |
| 52. | Towson | 5.1% | 12.3%(-7.16)#52 | 18.1%(-13.0)#1,615 |
| 53. | Pleasant Hills | 5.2% | 12.3%(-7.09)#53 | 18.1%(-12.9)#1,644 |
| 54. | Andrews Afb | 5.2% | 12.3%(-7.01)#54 | 18.1%(-12.8)#1,672 |
| 55. | Kingsville | 5.4% | 12.3%(-6.87)#55 | 18.1%(-12.7)#1,737 |
| 56. | Mountain Lake Park | 5.6% | 12.3%(-6.64)#56 | 18.1%(-12.4)#1,841 |
| 57. | Savage | 5.7% | 12.3%(-6.59)#57 | 18.1%(-12.4)#1,868 |
| 58. | Rockville | 5.7% | 12.3%(-6.56)#58 | 18.1%(-12.4)#1,878 |
| 59. | Elkridge | 5.9% | 12.3%(-6.32)#59 | 18.1%(-12.1)#1,963 |
| 60. | Beltsville | 6.1% | 12.3%(-6.18)#60 | 18.1%(-12.0)#2,014 |
| 61. | Ellicott City | 6.1% | 12.3%(-6.17)#61 | 18.1%(-12.0)#2,019 |
| 62. | Seabrook | 6.2% | 12.3%(-6.10)#62 | 18.1%(-11.9)#2,048 |
| 63. | Silver Hill | 6.2% | 12.3%(-6.01)#63 | 18.1%(-11.8)#2,083 |
| 64. | Bensville | 6.3% | 12.3%(-6.00)#64 | 18.1%(-11.8)#2,113 |
| 65. | Marlboro Meadows | 6.3% | 12.3%(-5.95)#65 | 18.1%(-11.8)#2,128 |
| 66. | North Laurel | 6.4% | 12.3%(-5.84)#66 | 18.1%(-11.6)#2,161 |
| 67. | Peppermill Village | 6.6% | 12.3%(-5.66)#67 | 18.1%(-11.5)#2,234 |
| 68. | Fort Meade | 6.8% | 12.3%(-5.45)#68 | 18.1%(-11.3)#2,331 |
| 69. | Cockeysville | 6.9% | 12.3%(-5.38)#69 | 18.1%(-11.2)#2,360 |
| 70. | Cheverly | 7.0% | 12.3%(-5.25)#70 | 18.1%(-11.1)#2,427 |
| 71. | Suitland | 7.1% | 12.3%(-5.19)#71 | 18.1%(-11.0)#2,450 |
| 72. | Havre De Grace | 7.1% | 12.3%(-5.19)#72 | 18.1%(-11.0)#2,451 |
| 73. | Parkville | 7.1% | 12.3%(-5.17)#73 | 18.1%(-11.0)#2,454 |
| 74. | Myersville | 7.2% | 12.3%(-5.06)#74 | 18.1%(-10.9)#2,514 |
| 75. | Glenmont | 7.2% | 12.3%(-5.03)#75 | 18.1%(-10.8)#2,519 |
| 76. | Waldorf | 7.2% | 12.3%(-5.01)#76 | 18.1%(-10.8)#2,524 |
| 77. | Denton | 7.3% | 12.3%(-5.00)#77 | 18.1%(-10.8)#2,532 |
| 78. | Centreville | 7.4% | 12.3%(-4.89)#78 | 18.1%(-10.7)#2,581 |
| 79. | Chesapeake Ranch Estates | 7.4% | 12.3%(-4.88)#79 | 18.1%(-10.7)#2,585 |
| 80. | Ocean Pines | 7.5% | 12.3%(-4.78)#80 | 18.1%(-10.6)#2,624 |
| 81. | Preston | 7.5% | 12.3%(-4.76)#81 | 18.1%(-10.6)#2,636 |
| 82. | Overlea | 7.6% | 12.3%(-4.65)#82 | 18.1%(-10.5)#2,669 |
| 83. | Seat Pleasant | 7.7% | 12.3%(-4.56)#83 | 18.1%(-10.4)#2,700 |
| 84. | Takoma Park | 7.7% | 12.3%(-4.52)#84 | 18.1%(-10.3)#2,738 |
| 85. | Grasonville | 7.7% | 12.3%(-4.51)#85 | 18.1%(-10.3)#2,742 |
| 86. | Owings Mills | 7.8% | 12.3%(-4.50)#86 | 18.1%(-10.3)#2,744 |
| 87. | Walker Mill | 7.8% | 12.3%(-4.49)#87 | 18.1%(-10.3)#2,750 |
| 88. | Riviera Beach | 8.0% | 12.3%(-4.24)#88 | 18.1%(-10.1)#2,839 |
| 89. | North Potomac | 8.1% | 12.3%(-4.19)#89 | 18.1%(-10.00)#2,853 |
| 90. | Ocean City | 8.1% | 12.3%(-4.15)#90 | 18.1%(-9.95)#2,870 |
| 91. | Calverton | 8.2% | 12.3%(-4.05)#91 | 18.1%(-9.86)#2,909 |
| 92. | Fairland | 8.4% | 12.3%(-3.91)#92 | 18.1%(-9.71)#2,991 |
| 93. | Severn | 8.4% | 12.3%(-3.85)#93 | 18.1%(-9.66)#3,004 |
| 94. | Milford Mill | 8.5% | 12.3%(-3.78)#94 | 18.1%(-9.59)#3,026 |
| 95. | Cedar Heights | 8.5% | 12.3%(-3.75)#95 | 18.1%(-9.56)#3,034 |
| 96. | New Carrollton | 8.6% | 12.3%(-3.61)#96 | 18.1%(-9.42)#3,104 |
| 97. | Hyattsville | 8.8% | 12.3%(-3.46)#97 | 18.1%(-9.26)#3,172 |
| 98. | Clinton | 8.9% | 12.3%(-3.38)#98 | 18.1%(-9.19)#3,196 |
| 99. | Ferndale | 8.9% | 12.3%(-3.36)#99 | 18.1%(-9.17)#3,209 |
| 100. | South Laurel | 9.0% | 12.3%(-3.27)#100 | 18.1%(-9.08)#3,239 |
Common Questions
What are the Top 10 Cities with the Lowest Poverty Level Among Children Under the Age of 5 in Maryland?
Top 10 Cities with the Lowest Poverty Level Among Children Under the Age of 5 in Maryland are:
#1
0.37%
#2
1.4%
#3
1.5%
#4
1.5%
#5
1.6%
#6
1.7%
#7
1.8%
#8
1.8%
#9
1.9%
#10
1.9%
What city has the Lowest Poverty Level Among Children Under the Age of 5 in Maryland?
Bel Air South has the Lowest Poverty Level Among Children Under the Age of 5 in Maryland with 0.37%.
What is the Poverty Level Among Children Under the Age of 5 in the State of Maryland?
Poverty Level Among Children Under the Age of 5 in Maryland is 12.3%.
What is the Poverty Level Among Children Under the Age of 5 in the United States?
Poverty Level Among Children Under the Age of 5 in the United States is 18.1%.