Cities with the Highest Percentage of Immigrants from Northern Europe in Connecticut
RELATED REPORTS & OPTIONS
Northern Europe
Connecticut
Compare Cities
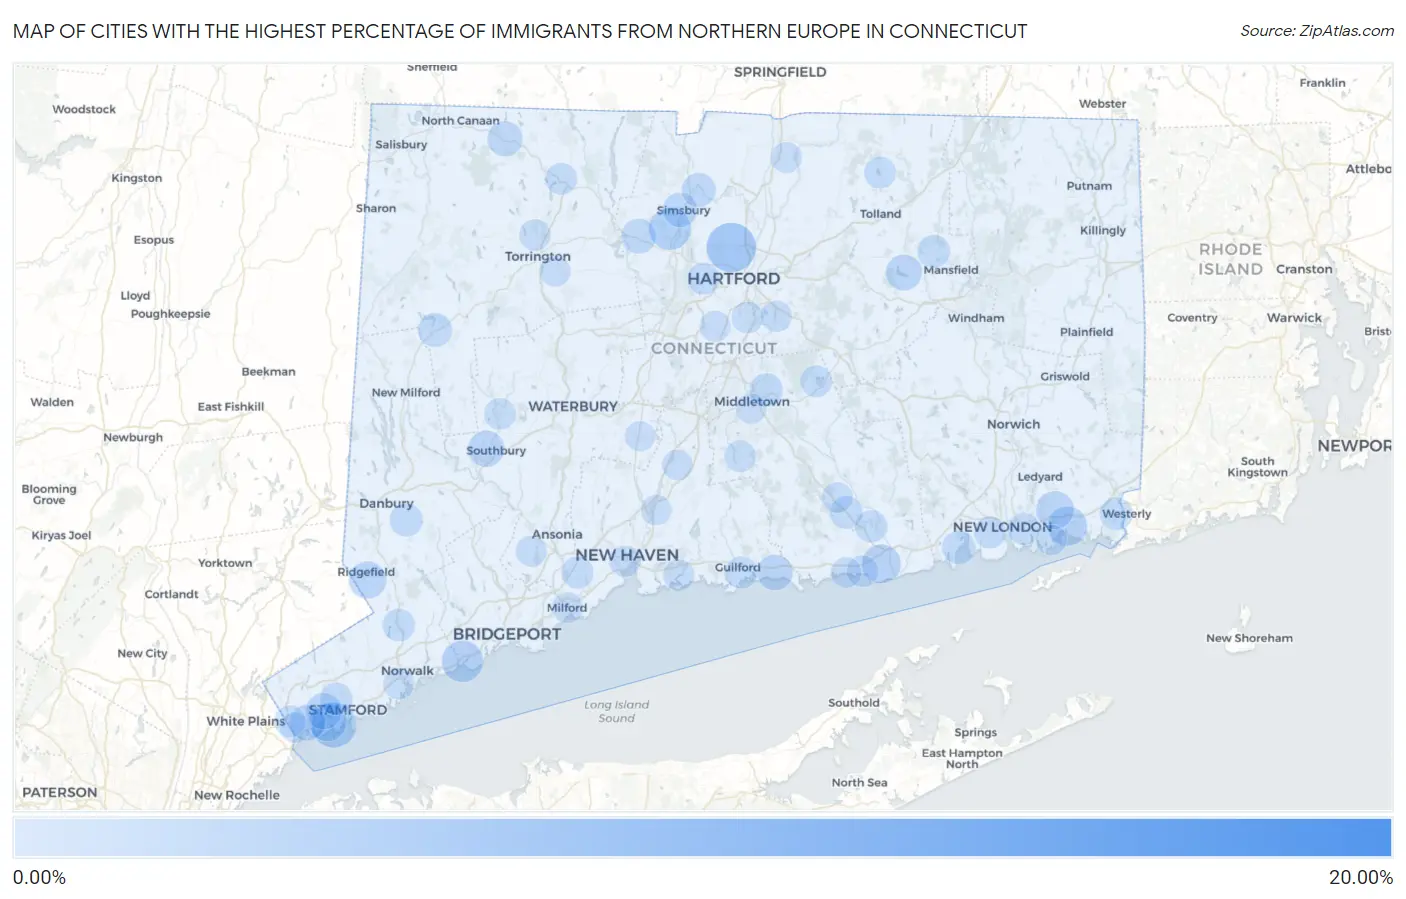
Map of Cities with the Highest Percentage of Immigrants from Northern Europe in Connecticut
0.00%
20.00%
Cities with the Highest Percentage of Immigrants from Northern Europe in Connecticut
| City | Northern Europe | vs State | vs National | |
| 1. | Chimney Point | 16.98% | 0.56%(+16.4)#1 | 0.29%(+16.7)#11 |
| 2. | Fenwick Borough | 12.50% | 0.56%(+11.9)#2 | 0.29%(+12.2)#21 |
| 3. | Candlewood Isle | 11.35% | 0.56%(+10.8)#3 | 0.29%(+11.1)#24 |
| 4. | Topstone | 7.30% | 0.56%(+6.75)#4 | 0.29%(+7.02)#47 |
| 5. | Rock Ridge | 6.70% | 0.56%(+6.14)#5 | 0.29%(+6.41)#57 |
| 6. | Cornwall Bridge | 5.24% | 0.56%(+4.69)#6 | 0.29%(+4.95)#86 |
| 7. | Blue Hills | 4.72% | 0.56%(+4.17)#7 | 0.29%(+4.44)#106 |
| 8. | Coleytown | 4.16% | 0.56%(+3.60)#8 | 0.29%(+3.87)#144 |
| 9. | Murray | 4.10% | 0.56%(+3.55)#9 | 0.29%(+3.82)#151 |
| 10. | Redding Center | 3.88% | 0.56%(+3.32)#10 | 0.29%(+3.59)#167 |
| 11. | Old Greenwich | 3.77% | 0.56%(+3.21)#11 | 0.29%(+3.48)#181 |
| 12. | Staples | 3.74% | 0.56%(+3.18)#12 | 0.29%(+3.45)#183 |
| 13. | Saugatuck | 3.40% | 0.56%(+2.85)#13 | 0.29%(+3.12)#223 |
| 14. | Noroton | 3.23% | 0.56%(+2.67)#14 | 0.29%(+2.94)#239 |
| 15. | Old Hill | 3.22% | 0.56%(+2.67)#15 | 0.29%(+2.94)#241 |
| 16. | Compo | 3.05% | 0.56%(+2.50)#16 | 0.29%(+2.77)#270 |
| 17. | Weatogue | 3.03% | 0.56%(+2.48)#17 | 0.29%(+2.75)#274 |
| 18. | Greens Farms | 2.92% | 0.56%(+2.36)#18 | 0.29%(+2.63)#286 |
| 19. | Southport | 2.90% | 0.56%(+2.35)#19 | 0.29%(+2.62)#288 |
| 20. | Ridgebury | 2.79% | 0.56%(+2.23)#20 | 0.29%(+2.50)#318 |
| 21. | West Mountain | 2.60% | 0.56%(+2.05)#21 | 0.29%(+2.32)#364 |
| 22. | Poplar Plains | 2.52% | 0.56%(+1.96)#22 | 0.29%(+2.23)#386 |
| 23. | Mystic | 2.45% | 0.56%(+1.89)#23 | 0.29%(+2.16)#402 |
| 24. | Old Saybrook Center | 2.33% | 0.56%(+1.78)#24 | 0.29%(+2.04)#423 |
| 25. | Indian Field | 2.22% | 0.56%(+1.66)#25 | 0.29%(+1.93)#454 |
| 26. | Route 7 Gateway | 2.18% | 0.56%(+1.63)#26 | 0.29%(+1.89)#467 |
| 27. | Old Mystic | 2.10% | 0.56%(+1.54)#27 | 0.29%(+1.81)#494 |
| 28. | Lakes East | 2.06% | 0.56%(+1.50)#28 | 0.29%(+1.77)#511 |
| 29. | Riverside | 2.01% | 0.56%(+1.46)#29 | 0.29%(+1.73)#533 |
| 30. | Ridgefield | 1.93% | 0.56%(+1.38)#30 | 0.29%(+1.65)#568 |
| 31. | New Canaan | 1.88% | 0.56%(+1.32)#31 | 0.29%(+1.59)#589 |
| 32. | Woodmont Borough | 1.85% | 0.56%(+1.30)#32 | 0.29%(+1.57)#603 |
| 33. | Stonington Borough | 1.80% | 0.56%(+1.25)#33 | 0.29%(+1.52)#626 |
| 34. | Taylor Corners | 1.77% | 0.56%(+1.21)#34 | 0.29%(+1.48)#645 |
| 35. | Heritage Village | 1.75% | 0.56%(+1.19)#35 | 0.29%(+1.46)#656 |
| 36. | Cos Cob | 1.73% | 0.56%(+1.17)#36 | 0.29%(+1.44)#668 |
| 37. | Greenwich | 1.64% | 0.56%(+1.09)#37 | 0.29%(+1.36)#714 |
| 38. | South Coventry | 1.63% | 0.56%(+1.08)#38 | 0.29%(+1.35)#724 |
| 39. | Madison Center | 1.56% | 0.56%(+1.01)#39 | 0.29%(+1.28)#774 |
| 40. | Norfolk | 1.53% | 0.56%(+0.979)#40 | 0.29%(+1.25)#797 |
| 41. | Canton Valley | 1.42% | 0.56%(+0.860)#41 | 0.29%(+1.13)#893 |
| 42. | Simsbury Center | 1.33% | 0.56%(+0.771)#42 | 0.29%(+1.04)#983 |
| 43. | Tariffville | 1.28% | 0.56%(+0.721)#43 | 0.29%(+0.990)#1,038 |
| 44. | New Preston | 1.27% | 0.56%(+0.712)#44 | 0.29%(+0.982)#1,046 |
| 45. | Plattsville | 1.26% | 0.56%(+0.701)#45 | 0.29%(+0.970)#1,066 |
| 46. | Tokeneke | 1.24% | 0.56%(+0.688)#46 | 0.29%(+0.957)#1,075 |
| 47. | Inglenook | 1.20% | 0.56%(+0.646)#47 | 0.29%(+0.916)#1,131 |
| 48. | Trumbull Center | 1.09% | 0.56%(+0.538)#48 | 0.29%(+0.808)#1,291 |
| 49. | Niantic | 1.09% | 0.56%(+0.532)#49 | 0.29%(+0.801)#1,304 |
| 50. | Portland | 1.06% | 0.56%(+0.505)#50 | 0.29%(+0.774)#1,359 |
| 51. | Westport | 1.05% | 0.56%(+0.494)#51 | 0.29%(+0.764)#1,375 |
| 52. | Bethel | 1.03% | 0.56%(+0.475)#52 | 0.29%(+0.745)#1,414 |
| 53. | Pawcatuck | 1.01% | 0.56%(+0.450)#53 | 0.29%(+0.720)#1,461 |
| 54. | Storrs | 0.97% | 0.56%(+0.411)#54 | 0.29%(+0.680)#1,537 |
| 55. | Deep River Center | 0.93% | 0.56%(+0.371)#55 | 0.29%(+0.641)#1,627 |
| 56. | Wilton Center | 0.91% | 0.56%(+0.359)#56 | 0.29%(+0.628)#1,653 |
| 57. | Oronoque | 0.91% | 0.56%(+0.355)#57 | 0.29%(+0.625)#1,661 |
| 58. | Stamford | 0.90% | 0.56%(+0.340)#58 | 0.29%(+0.610)#1,698 |
| 59. | Essex Village | 0.88% | 0.56%(+0.326)#59 | 0.29%(+0.595)#1,730 |
| 60. | South Wilton | 0.84% | 0.56%(+0.285)#60 | 0.29%(+0.555)#1,850 |
| 61. | Long Hill | 0.82% | 0.56%(+0.264)#61 | 0.29%(+0.533)#1,915 |
| 62. | Orange | 0.82% | 0.56%(+0.260)#62 | 0.29%(+0.530)#1,925 |
| 63. | Guilford Center | 0.79% | 0.56%(+0.232)#63 | 0.29%(+0.502)#2,002 |
| 64. | Lordship | 0.78% | 0.56%(+0.224)#64 | 0.29%(+0.494)#2,024 |
| 65. | Quinnipiac University | 0.77% | 0.56%(+0.216)#65 | 0.29%(+0.486)#2,044 |
| 66. | Darien Downtown | 0.76% | 0.56%(+0.210)#66 | 0.29%(+0.479)#2,060 |
| 67. | Waterford | 0.76% | 0.56%(+0.208)#67 | 0.29%(+0.478)#2,063 |
| 68. | West Hartford | 0.75% | 0.56%(+0.197)#68 | 0.29%(+0.467)#2,102 |
| 69. | Lake Pocotopaug | 0.74% | 0.56%(+0.180)#69 | 0.29%(+0.450)#2,151 |
| 70. | Crystal Lake | 0.72% | 0.56%(+0.166)#70 | 0.29%(+0.436)#2,189 |
| 71. | Winsted | 0.71% | 0.56%(+0.157)#71 | 0.29%(+0.427)#2,222 |
| 72. | Mill Plain | 0.71% | 0.56%(+0.151)#72 | 0.29%(+0.421)#2,236 |
| 73. | Woodbury Center | 0.69% | 0.56%(+0.137)#73 | 0.29%(+0.407)#2,285 |
| 74. | Durham | 0.69% | 0.56%(+0.137)#74 | 0.29%(+0.406)#2,288 |
| 75. | Torrington | 0.69% | 0.56%(+0.132)#75 | 0.29%(+0.402)#2,298 |
| 76. | Glenville | 0.67% | 0.56%(+0.120)#76 | 0.29%(+0.389)#2,346 |
| 77. | Wethersfield | 0.67% | 0.56%(+0.111)#77 | 0.29%(+0.380)#2,382 |
| 78. | Saybrook Manor | 0.65% | 0.56%(+0.095)#78 | 0.29%(+0.364)#2,441 |
| 79. | Norwalk | 0.64% | 0.56%(+0.082)#79 | 0.29%(+0.352)#2,486 |
| 80. | Branford Center | 0.63% | 0.56%(+0.074)#80 | 0.29%(+0.344)#2,515 |
| 81. | Glastonbury Center | 0.63% | 0.56%(+0.073)#81 | 0.29%(+0.343)#2,519 |
| 82. | New Haven | 0.63% | 0.56%(+0.073)#82 | 0.29%(+0.342)#2,521 |
| 83. | Southwood Acres | 0.57% | 0.56%(+0.013)#83 | 0.29%(+0.282)#2,809 |
| 84. | Newington | 0.54% | 0.56%(-0.013)#84 | 0.29%(+0.256)#2,935 |
| 85. | Shelton | 0.53% | 0.56%(-0.024)#85 | 0.29%(+0.246)#2,980 |
| 86. | Tashua | 0.53% | 0.56%(-0.026)#86 | 0.29%(+0.243)#3,000 |
| 87. | Litchfield Borough | 0.52% | 0.56%(-0.038)#87 | 0.29%(+0.231)#3,065 |
| 88. | Newtown Borough | 0.51% | 0.56%(-0.045)#88 | 0.29%(+0.225)#3,090 |
| 89. | Milford City Balance | 0.50% | 0.56%(-0.054)#89 | 0.29%(+0.216)#3,132 |
| 90. | Northwest Harwinton | 0.50% | 0.56%(-0.055)#90 | 0.29%(+0.214)#3,141 |
| 91. | Wallingford Center | 0.48% | 0.56%(-0.075)#91 | 0.29%(+0.195)#3,251 |
| 92. | Daniels Farm | 0.48% | 0.56%(-0.077)#92 | 0.29%(+0.193)#3,264 |
| 93. | Noank | 0.47% | 0.56%(-0.087)#93 | 0.29%(+0.183)#3,322 |
| 94. | Chester Center | 0.46% | 0.56%(-0.092)#94 | 0.29%(+0.177)#3,354 |
| 95. | North Haven | 0.45% | 0.56%(-0.104)#95 | 0.29%(+0.165)#3,437 |
| 96. | Pemberwick | 0.44% | 0.56%(-0.119)#96 | 0.29%(+0.150)#3,535 |
| 97. | Westbrook Center | 0.43% | 0.56%(-0.123)#97 | 0.29%(+0.146)#3,557 |
| 98. | Sandy Hook | 0.40% | 0.56%(-0.159)#98 | 0.29%(+0.110)#3,839 |
| 99. | Middletown | 0.39% | 0.56%(-0.162)#99 | 0.29%(+0.107)#3,860 |
| 100. | Cheshire Village | 0.39% | 0.56%(-0.164)#100 | 0.29%(+0.106)#3,872 |
1
2Common Questions
What are the Top 10 Cities with the Highest Percentage of Immigrants from Northern Europe in Connecticut?
Top 10 Cities with the Highest Percentage of Immigrants from Northern Europe in Connecticut are:
#1
4.72%
#2
3.77%
#3
3.03%
#4
2.90%
#5
2.45%
#6
2.33%
#7
2.10%
#8
2.01%
#9
1.93%
#10
1.75%
What city has the Highest Percentage of Immigrants from Northern Europe in Connecticut?
Blue Hills has the Highest Percentage of Immigrants from Northern Europe in Connecticut with 4.72%.
What is the Percentage of Immigrants from Northern Europe in the State of Connecticut?
Percentage of Immigrants from Northern Europe in Connecticut is 0.56%.
What is the Percentage of Immigrants from Northern Europe in the United States?
Percentage of Immigrants from Northern Europe in the United States is 0.29%.