Cities with the Most Immigrants from Cambodia in Maryland
RELATED REPORTS & OPTIONS
Cambodia
Maryland
Compare Cities
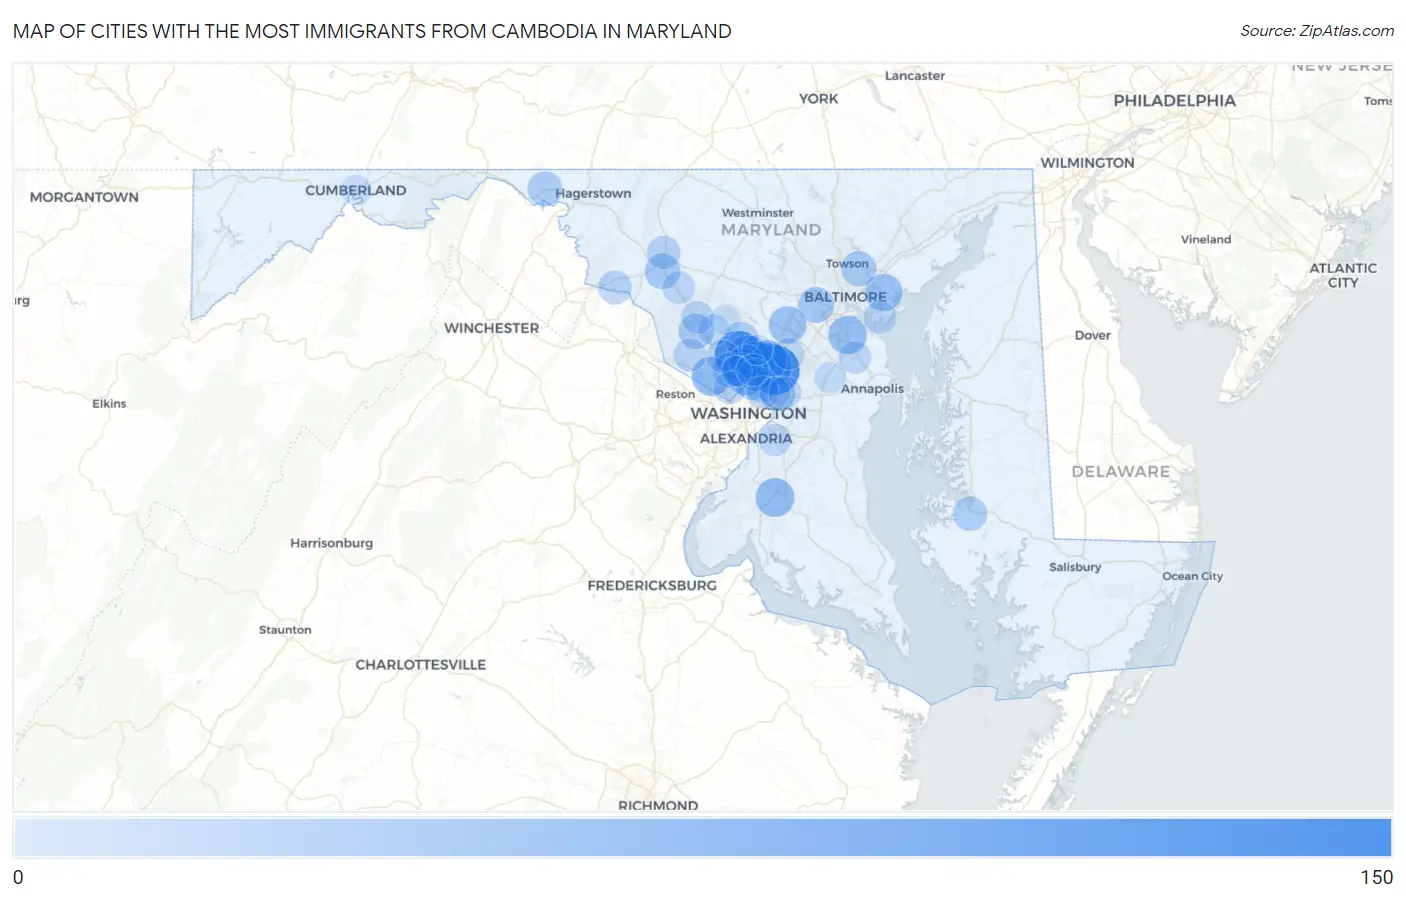
Map of Cities with the Most Immigrants from Cambodia in Maryland
0
150
Cities with the Most Immigrants from Cambodia in Maryland
| City | Cambodia | vs State | vs National | |
| 1. | Beltsville | 121 | 1,581(7.65%)#1 | 149,355(0.08%)#205 |
| 2. | Aspen Hill | 111 | 1,581(7.02%)#2 | 149,355(0.07%)#222 |
| 3. | Calverton | 99 | 1,581(6.26%)#3 | 149,355(0.07%)#241 |
| 4. | Layhill | 70 | 1,581(4.43%)#4 | 149,355(0.05%)#334 |
| 5. | Colesville | 60 | 1,581(3.80%)#5 | 149,355(0.04%)#383 |
| 6. | Fairland | 56 | 1,581(3.54%)#6 | 149,355(0.04%)#405 |
| 7. | Potomac | 55 | 1,581(3.48%)#7 | 149,355(0.04%)#408 |
| 8. | Wheaton | 54 | 1,581(3.42%)#8 | 149,355(0.04%)#413 |
| 9. | Waldorf | 53 | 1,581(3.35%)#9 | 149,355(0.04%)#425 |
| 10. | Glen Burnie | 51 | 1,581(3.23%)#10 | 149,355(0.03%)#444 |
| 11. | Forest Glen | 48 | 1,581(3.04%)#11 | 149,355(0.03%)#470 |
| 12. | Columbia | 45 | 1,581(2.85%)#12 | 149,355(0.03%)#480 |
| 13. | Essex | 44 | 1,581(2.78%)#13 | 149,355(0.03%)#491 |
| 14. | Catonsville | 35 | 1,581(2.21%)#14 | 149,355(0.02%)#571 |
| 15. | Ballenger Creek | 34 | 1,581(2.15%)#15 | 149,355(0.02%)#581 |
| 16. | Germantown | 32 | 1,581(2.02%)#16 | 149,355(0.02%)#600 |
| 17. | East Riverdale | 32 | 1,581(2.02%)#17 | 149,355(0.02%)#607 |
| 18. | Parkville | 31 | 1,581(1.96%)#18 | 149,355(0.02%)#618 |
| 19. | North Bethesda | 30 | 1,581(1.90%)#19 | 149,355(0.02%)#627 |
| 20. | Silver Spring | 29 | 1,581(1.83%)#20 | 149,355(0.02%)#646 |
| 21. | Clear Spring | 29 | 1,581(1.83%)#21 | 149,355(0.02%)#667 |
| 22. | Cambridge | 26 | 1,581(1.64%)#22 | 149,355(0.02%)#709 |
| 23. | North Kensington | 26 | 1,581(1.64%)#23 | 149,355(0.02%)#711 |
| 24. | Langley Park | 25 | 1,581(1.58%)#24 | 149,355(0.02%)#733 |
| 25. | Olney | 24 | 1,581(1.52%)#25 | 149,355(0.02%)#745 |
| 26. | Brunswick | 23 | 1,581(1.45%)#26 | 149,355(0.02%)#775 |
| 27. | Glenmont | 21 | 1,581(1.33%)#27 | 149,355(0.01%)#811 |
| 28. | Flower Hill | 21 | 1,581(1.33%)#28 | 149,355(0.01%)#812 |
| 29. | Frederick | 20 | 1,581(1.27%)#29 | 149,355(0.01%)#829 |
| 30. | Bethesda | 19 | 1,581(1.20%)#30 | 149,355(0.01%)#853 |
| 31. | Rockville | 17 | 1,581(1.08%)#31 | 149,355(0.01%)#902 |
| 32. | Four Corners | 17 | 1,581(1.08%)#32 | 149,355(0.01%)#922 |
| 33. | Darnestown | 17 | 1,581(1.08%)#33 | 149,355(0.01%)#924 |
| 34. | Clarksburg | 16 | 1,581(1.01%)#34 | 149,355(0.01%)#937 |
| 35. | Severna Park | 15 | 1,581(0.95%)#35 | 149,355(0.01%)#961 |
| 36. | Chillum | 15 | 1,581(0.95%)#36 | 149,355(0.01%)#962 |
| 37. | Urbana | 15 | 1,581(0.95%)#37 | 149,355(0.01%)#972 |
| 38. | Edgemere | 15 | 1,581(0.95%)#38 | 149,355(0.01%)#975 |
| 39. | New Carrollton | 14 | 1,581(0.89%)#39 | 149,355(0.01%)#1,003 |
| 40. | Camp Springs | 13 | 1,581(0.82%)#40 | 149,355(0.01%)#1,029 |
| 41. | Kemp Mill | 12 | 1,581(0.76%)#41 | 149,355(0.01%)#1,060 |
| 42. | Laurel | 10 | 1,581(0.63%)#42 | 149,355(0.01%)#1,118 |
| 43. | Montgomery Village | 9 | 1,581(0.57%)#43 | 149,355(0.01%)#1,152 |
| 44. | Crofton | 8 | 1,581(0.51%)#44 | 149,355(0.01%)#1,198 |
| 45. | Riverdale Park | 5 | 1,581(0.32%)#45 | 149,355(0.00%)#1,307 |
| 46. | Cumberland | 3 | 1,581(0.19%)#46 | 149,355(0.00%)#1,364 |
| 47. | Garrett Park | 3 | 1,581(0.19%)#47 | 149,355(0.00%)#1,380 |
| 48. | Cloverly | 2 | 1,581(0.13%)#48 | 149,355(0.00%)#1,394 |
| 49. | Laytonsville | 2 | 1,581(0.13%)#49 | 149,355(0.00%)#1,409 |
Common Questions
What are the Top 10 Cities with the Most Immigrants from Cambodia in Maryland?
Top 10 Cities with the Most Immigrants from Cambodia in Maryland are:
#1
121
#2
111
#3
99
#4
70
#5
60
#6
56
#7
55
#8
54
#9
53
#10
51
What city has the Most Immigrants from Cambodia in Maryland?
Beltsville has the Most Immigrants from Cambodia in Maryland with 121.
What is the Total Immigrants from Cambodia in the State of Maryland?
Total Immigrants from Cambodia in Maryland is 1,581.
What is the Total Immigrants from Cambodia in the United States?
Total Immigrants from Cambodia in the United States is 149,355.