Cities with the Highest Percentage of Immigrants from Northern Europe in Georgia
RELATED REPORTS & OPTIONS
Northern Europe
Georgia
Compare Cities
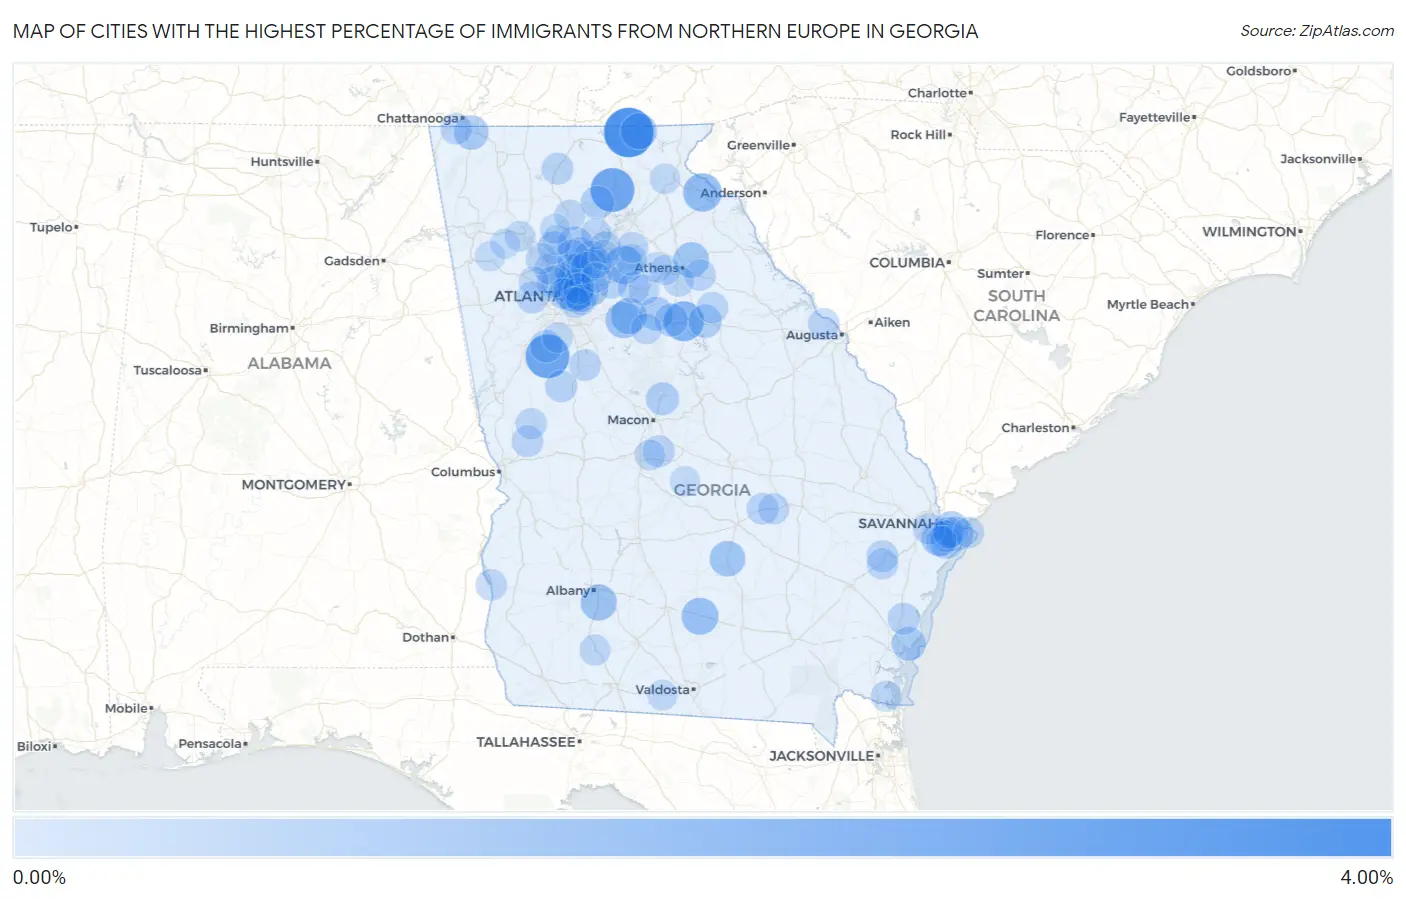
Map of Cities with the Highest Percentage of Immigrants from Northern Europe in Georgia
0.00%
4.00%
Cities with the Highest Percentage of Immigrants from Northern Europe in Georgia
| City | Northern Europe | vs State | vs National | |
| 1. | Young Harris | 3.10% | 0.21%(+2.88)#1 | 0.29%(+2.81)#261 |
| 2. | Senoia | 2.25% | 0.21%(+2.03)#2 | 0.29%(+1.96)#444 |
| 3. | Dahlonega | 2.23% | 0.21%(+2.02)#3 | 0.29%(+1.95)#448 |
| 4. | Druid Hills | 1.70% | 0.21%(+1.49)#4 | 0.29%(+1.42)#681 |
| 5. | Buckhead | 1.64% | 0.21%(+1.42)#5 | 0.29%(+1.35)#720 |
| 6. | Avalon | 1.40% | 0.21%(+1.19)#6 | 0.29%(+1.12)#905 |
| 7. | Dacula | 1.35% | 0.21%(+1.13)#7 | 0.29%(+1.06)#959 |
| 8. | Alapaha | 1.18% | 0.21%(+0.968)#8 | 0.29%(+0.897)#1,159 |
| 9. | Porterdale | 1.12% | 0.21%(+0.909)#9 | 0.29%(+0.838)#1,247 |
| 10. | Putney | 1.06% | 0.21%(+0.847)#10 | 0.29%(+0.777)#1,355 |
| 11. | Covington | 1.06% | 0.21%(+0.842)#11 | 0.29%(+0.772)#1,362 |
| 12. | Hiawassee | 1.05% | 0.21%(+0.838)#12 | 0.29%(+0.767)#1,368 |
| 13. | Avondale Estates | 1.03% | 0.21%(+0.812)#13 | 0.29%(+0.741)#1,426 |
| 14. | Hull | 0.98% | 0.21%(+0.761)#14 | 0.29%(+0.690)#1,517 |
| 15. | Jacksonville | 0.97% | 0.21%(+0.756)#15 | 0.29%(+0.685)#1,531 |
| 16. | Whitemarsh Island | 0.88% | 0.21%(+0.669)#16 | 0.29%(+0.598)#1,725 |
| 17. | Vernonburg | 0.86% | 0.21%(+0.647)#17 | 0.29%(+0.577)#1,785 |
| 18. | Wilmington Island | 0.83% | 0.21%(+0.612)#18 | 0.29%(+0.542)#1,883 |
| 19. | Fort Oglethorpe | 0.82% | 0.21%(+0.609)#19 | 0.29%(+0.538)#1,898 |
| 20. | Milton | 0.82% | 0.21%(+0.602)#20 | 0.29%(+0.531)#1,920 |
| 21. | Brookhaven | 0.79% | 0.21%(+0.575)#21 | 0.29%(+0.504)#1,993 |
| 22. | St Simons | 0.75% | 0.21%(+0.536)#22 | 0.29%(+0.465)#2,106 |
| 23. | Rutledge | 0.75% | 0.21%(+0.534)#23 | 0.29%(+0.463)#2,113 |
| 24. | Stone Mountain | 0.74% | 0.21%(+0.523)#24 | 0.29%(+0.453)#2,140 |
| 25. | North Druid Hills | 0.73% | 0.21%(+0.510)#25 | 0.29%(+0.440)#2,174 |
| 26. | Berkeley Lake | 0.67% | 0.21%(+0.458)#26 | 0.29%(+0.387)#2,357 |
| 27. | Greensboro | 0.67% | 0.21%(+0.457)#27 | 0.29%(+0.386)#2,359 |
| 28. | Dawsonville | 0.65% | 0.21%(+0.431)#28 | 0.29%(+0.360)#2,457 |
| 29. | Madison | 0.63% | 0.21%(+0.419)#29 | 0.29%(+0.349)#2,495 |
| 30. | Gray | 0.61% | 0.21%(+0.400)#30 | 0.29%(+0.330)#2,581 |
| 31. | Sandy Springs | 0.61% | 0.21%(+0.395)#31 | 0.29%(+0.325)#2,602 |
| 32. | Roswell | 0.61% | 0.21%(+0.392)#32 | 0.29%(+0.321)#2,618 |
| 33. | Johns Creek | 0.58% | 0.21%(+0.370)#33 | 0.29%(+0.300)#2,721 |
| 34. | Skidaway Island | 0.58% | 0.21%(+0.366)#34 | 0.29%(+0.296)#2,741 |
| 35. | Dunwoody | 0.58% | 0.21%(+0.362)#35 | 0.29%(+0.292)#2,755 |
| 36. | Decatur | 0.53% | 0.21%(+0.318)#36 | 0.29%(+0.247)#2,975 |
| 37. | Peachtree City | 0.52% | 0.21%(+0.308)#37 | 0.29%(+0.238)#3,028 |
| 38. | Vinings | 0.51% | 0.21%(+0.295)#38 | 0.29%(+0.224)#3,092 |
| 39. | Darien | 0.48% | 0.21%(+0.264)#39 | 0.29%(+0.193)#3,261 |
| 40. | Woodstock | 0.46% | 0.21%(+0.249)#40 | 0.29%(+0.178)#3,352 |
| 41. | Douglasville | 0.46% | 0.21%(+0.248)#41 | 0.29%(+0.177)#3,357 |
| 42. | Ellijay | 0.46% | 0.21%(+0.242)#42 | 0.29%(+0.172)#3,384 |
| 43. | Robins Afb | 0.46% | 0.21%(+0.241)#43 | 0.29%(+0.171)#3,391 |
| 44. | Kennesaw State University | 0.45% | 0.21%(+0.239)#44 | 0.29%(+0.169)#3,408 |
| 45. | Concord | 0.45% | 0.21%(+0.238)#45 | 0.29%(+0.167)#3,423 |
| 46. | Snellville | 0.45% | 0.21%(+0.230)#46 | 0.29%(+0.160)#3,472 |
| 47. | Hinesville | 0.43% | 0.21%(+0.217)#47 | 0.29%(+0.146)#3,556 |
| 48. | Sugar Hill | 0.43% | 0.21%(+0.214)#48 | 0.29%(+0.144)#3,572 |
| 49. | Waverly Hall | 0.43% | 0.21%(+0.214)#49 | 0.29%(+0.143)#3,575 |
| 50. | Smyrna | 0.43% | 0.21%(+0.213)#50 | 0.29%(+0.142)#3,584 |
| 51. | Isle Of Hope | 0.42% | 0.21%(+0.206)#51 | 0.29%(+0.136)#3,630 |
| 52. | East Griffin | 0.41% | 0.21%(+0.200)#52 | 0.29%(+0.129)#3,676 |
| 53. | Arnoldsville | 0.41% | 0.21%(+0.197)#53 | 0.29%(+0.126)#3,704 |
| 54. | Between | 0.41% | 0.21%(+0.193)#54 | 0.29%(+0.122)#3,741 |
| 55. | Glenwood | 0.41% | 0.21%(+0.191)#55 | 0.29%(+0.121)#3,754 |
| 56. | Evans | 0.41% | 0.21%(+0.191)#56 | 0.29%(+0.120)#3,756 |
| 57. | Marietta | 0.40% | 0.21%(+0.186)#57 | 0.29%(+0.115)#3,797 |
| 58. | Alpharetta | 0.40% | 0.21%(+0.186)#58 | 0.29%(+0.115)#3,798 |
| 59. | Savannah | 0.40% | 0.21%(+0.186)#59 | 0.29%(+0.115)#3,803 |
| 60. | Dutch Island | 0.39% | 0.21%(+0.180)#60 | 0.29%(+0.109)#3,848 |
| 61. | Lookout Mountain | 0.39% | 0.21%(+0.176)#61 | 0.29%(+0.105)#3,884 |
| 62. | Fort Gaines | 0.39% | 0.21%(+0.172)#62 | 0.29%(+0.101)#3,914 |
| 63. | Woodville | 0.38% | 0.21%(+0.168)#63 | 0.29%(+0.098)#3,949 |
| 64. | Duluth | 0.38% | 0.21%(+0.163)#64 | 0.29%(+0.093)#3,980 |
| 65. | Walthourville | 0.38% | 0.21%(+0.162)#65 | 0.29%(+0.091)#4,002 |
| 66. | Peachtree Corners | 0.37% | 0.21%(+0.151)#66 | 0.29%(+0.080)#4,092 |
| 67. | Shiloh | 0.35% | 0.21%(+0.139)#67 | 0.29%(+0.069)#4,186 |
| 68. | Athens-Clarke County Unified Government (Balance) | 0.35% | 0.21%(+0.139)#68 | 0.29%(+0.068)#4,189 |
| 69. | Auburn | 0.35% | 0.21%(+0.132)#69 | 0.29%(+0.061)#4,253 |
| 70. | Ailey | 0.34% | 0.21%(+0.128)#70 | 0.29%(+0.058)#4,280 |
| 71. | Braselton | 0.34% | 0.21%(+0.126)#71 | 0.29%(+0.055)#4,301 |
| 72. | Atlanta | 0.32% | 0.21%(+0.106)#72 | 0.29%(+0.035)#4,491 |
| 73. | North Decatur | 0.32% | 0.21%(+0.105)#73 | 0.29%(+0.035)#4,498 |
| 74. | Tybee Island | 0.32% | 0.21%(+0.105)#74 | 0.29%(+0.035)#4,500 |
| 75. | Gresham Park | 0.32% | 0.21%(+0.105)#75 | 0.29%(+0.034)#4,502 |
| 76. | Ball Ground | 0.32% | 0.21%(+0.102)#76 | 0.29%(+0.031)#4,537 |
| 77. | Pelham | 0.31% | 0.21%(+0.099)#77 | 0.29%(+0.029)#4,553 |
| 78. | Cumming | 0.31% | 0.21%(+0.097)#78 | 0.29%(+0.027)#4,568 |
| 79. | Newborn | 0.31% | 0.21%(+0.096)#79 | 0.29%(+0.026)#4,577 |
| 80. | Monroe | 0.31% | 0.21%(+0.091)#80 | 0.29%(+0.021)#4,627 |
| 81. | Montgomery | 0.30% | 0.21%(+0.089)#81 | 0.29%(+0.019)#4,643 |
| 82. | St Marys | 0.30% | 0.21%(+0.088)#82 | 0.29%(+0.017)#4,655 |
| 83. | Watkinsville | 0.30% | 0.21%(+0.085)#83 | 0.29%(+0.015)#4,683 |
| 84. | Kennesaw | 0.30% | 0.21%(+0.085)#84 | 0.29%(+0.014)#4,686 |
| 85. | Warner Robins | 0.29% | 0.21%(+0.076)#85 | 0.29%(+0.006)#4,783 |
| 86. | Statham | 0.28% | 0.21%(+0.068)#86 | 0.29%(-0.003)#4,878 |
| 87. | Quitman | 0.27% | 0.21%(+0.057)#87 | 0.29%(-0.014)#4,981 |
| 88. | Clarkesville | 0.27% | 0.21%(+0.050)#88 | 0.29%(-0.020)#5,061 |
| 89. | Fayetteville | 0.26% | 0.21%(+0.048)#89 | 0.29%(-0.022)#5,082 |
| 90. | Cartersville | 0.26% | 0.21%(+0.041)#90 | 0.29%(-0.030)#5,168 |
| 91. | Bogart | 0.24% | 0.21%(+0.020)#91 | 0.29%(-0.050)#5,411 |
| 92. | Aragon | 0.23% | 0.21%(+0.012)#92 | 0.29%(-0.059)#5,511 |
| 93. | Cochran | 0.23% | 0.21%(+0.011)#93 | 0.29%(-0.059)#5,525 |
| 94. | Candler Mcafee | 0.22% | 0.21%(+0.010)#94 | 0.29%(-0.061)#5,545 |
| 95. | Powder Springs | 0.22% | 0.21%(+0.010)#95 | 0.29%(-0.061)#5,548 |
| 96. | Suwanee | 0.22% | 0.21%(+0.007)#96 | 0.29%(-0.064)#5,596 |
| 97. | Euharlee | 0.21% | 0.21%(-0.003)#97 | 0.29%(-0.074)#5,728 |
| 98. | Lilburn | 0.21% | 0.21%(-0.004)#98 | 0.29%(-0.075)#5,743 |
| 99. | Holly Springs | 0.20% | 0.21%(-0.011)#99 | 0.29%(-0.081)#5,825 |
| 100. | Canton | 0.20% | 0.21%(-0.018)#100 | 0.29%(-0.088)#5,929 |
Common Questions
What are the Top 10 Cities with the Highest Percentage of Immigrants from Northern Europe in Georgia?
Top 10 Cities with the Highest Percentage of Immigrants from Northern Europe in Georgia are:
#1
3.10%
#2
2.25%
#3
2.23%
#4
1.70%
#5
1.64%
#6
1.40%
#7
1.35%
#8
1.18%
#9
1.12%
#10
1.06%
What city has the Highest Percentage of Immigrants from Northern Europe in Georgia?
Young Harris has the Highest Percentage of Immigrants from Northern Europe in Georgia with 3.10%.
What is the Percentage of Immigrants from Northern Europe in the State of Georgia?
Percentage of Immigrants from Northern Europe in Georgia is 0.21%.
What is the Percentage of Immigrants from Northern Europe in the United States?
Percentage of Immigrants from Northern Europe in the United States is 0.29%.