Cities with the Highest Percentage of Immigrants from Eastern Europe in Maryland
RELATED REPORTS & OPTIONS
Eastern Europe
Maryland
Compare Cities
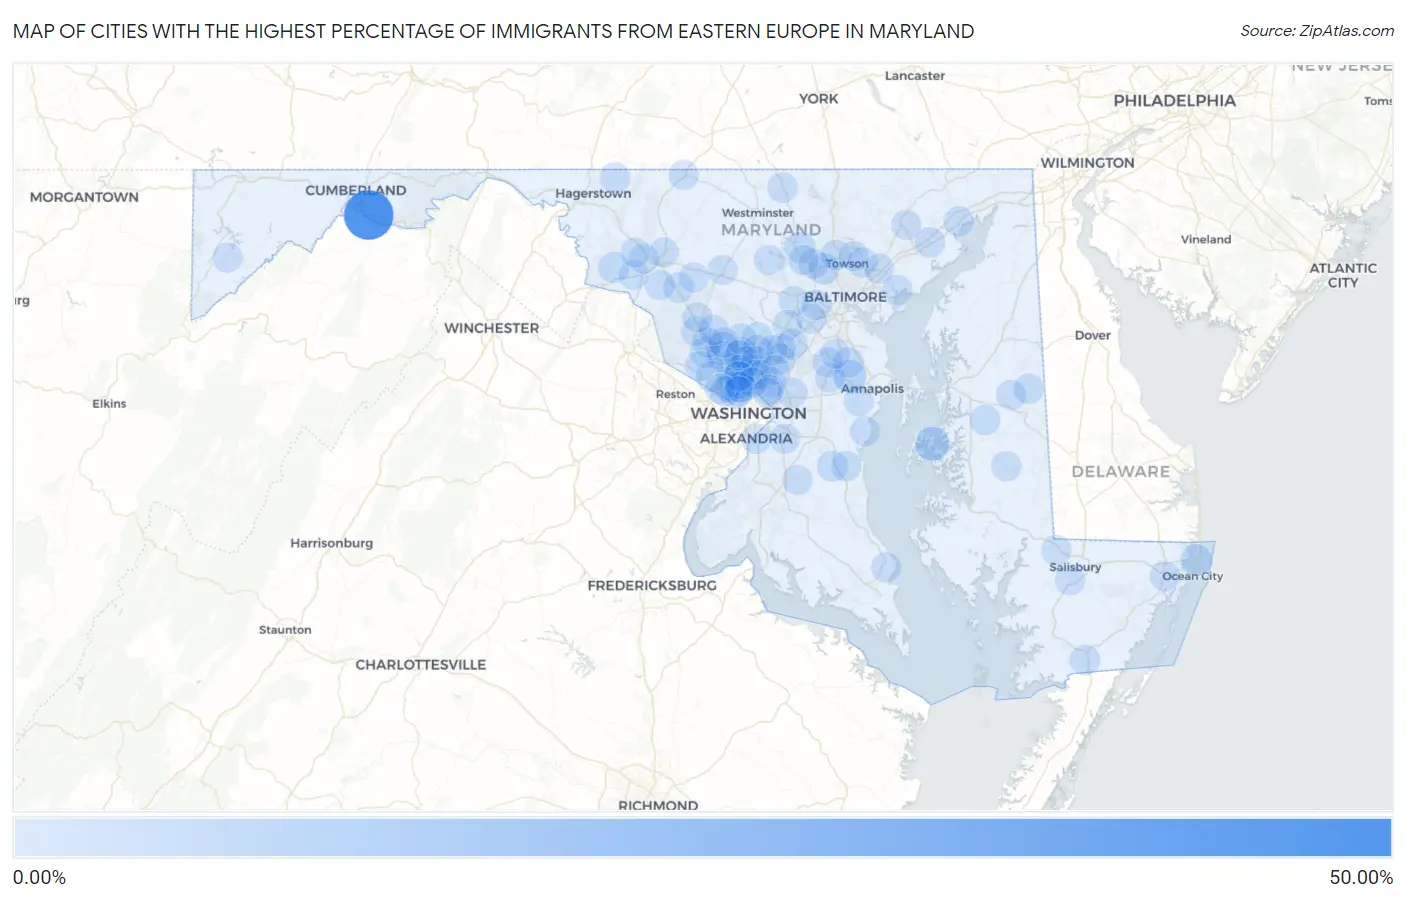
Map of Cities with the Highest Percentage of Immigrants from Eastern Europe in Maryland
0.00%
50.00%
Cities with the Highest Percentage of Immigrants from Eastern Europe in Maryland
| City | Eastern Europe | vs State | vs National | |
| 1. | Spring Gap | 50.00% | 0.56%(+49.4)#1 | 0.67%(+49.3)#2 |
| 2. | St Michaels | 10.05% | 0.56%(+9.48)#2 | 0.67%(+9.38)#74 |
| 3. | Derwood | 7.62% | 0.56%(+7.06)#3 | 0.67%(+6.95)#119 |
| 4. | Crownsville | 7.12% | 0.56%(+6.55)#4 | 0.67%(+6.45)#135 |
| 5. | Chevy Chase View | 5.34% | 0.56%(+4.78)#5 | 0.67%(+4.68)#234 |
| 6. | Ocean City | 4.33% | 0.56%(+3.77)#6 | 0.67%(+3.66)#339 |
| 7. | Friendship Heights Village | 4.29% | 0.56%(+3.73)#7 | 0.67%(+3.62)#345 |
| 8. | Pikesville | 4.16% | 0.56%(+3.60)#8 | 0.67%(+3.50)#361 |
| 9. | North Bethesda | 3.54% | 0.56%(+2.98)#9 | 0.67%(+2.87)#480 |
| 10. | Reisterstown | 3.31% | 0.56%(+2.75)#10 | 0.67%(+2.65)#519 |
| 11. | Burkittsville | 2.80% | 0.56%(+2.23)#11 | 0.67%(+2.13)#673 |
| 12. | Dunkirk | 2.59% | 0.56%(+2.03)#12 | 0.67%(+1.92)#762 |
| 13. | Rockville | 2.42% | 0.56%(+1.86)#13 | 0.67%(+1.76)#846 |
| 14. | North Laurel | 2.42% | 0.56%(+1.86)#14 | 0.67%(+1.75)#847 |
| 15. | Martin S Additions | 2.42% | 0.56%(+1.85)#15 | 0.67%(+1.75)#849 |
| 16. | Bethesda | 2.37% | 0.56%(+1.81)#16 | 0.67%(+1.70)#872 |
| 17. | North Potomac | 2.17% | 0.56%(+1.61)#17 | 0.67%(+1.51)#978 |
| 18. | Kensington | 2.14% | 0.56%(+1.58)#18 | 0.67%(+1.47)#997 |
| 19. | Ashton Sandy Spring | 2.13% | 0.56%(+1.57)#19 | 0.67%(+1.47)#1,007 |
| 20. | Potomac | 2.01% | 0.56%(+1.44)#20 | 0.67%(+1.34)#1,094 |
| 21. | Layhill | 1.98% | 0.56%(+1.42)#21 | 0.67%(+1.31)#1,111 |
| 22. | Leitersburg | 1.97% | 0.56%(+1.41)#22 | 0.67%(+1.30)#1,115 |
| 23. | Leisure World | 1.93% | 0.56%(+1.37)#23 | 0.67%(+1.26)#1,146 |
| 24. | Arden On The Severn | 1.91% | 0.56%(+1.35)#24 | 0.67%(+1.24)#1,163 |
| 25. | Urbana | 1.88% | 0.56%(+1.32)#25 | 0.67%(+1.22)#1,184 |
| 26. | Olney | 1.85% | 0.56%(+1.29)#26 | 0.67%(+1.19)#1,213 |
| 27. | Manchester | 1.72% | 0.56%(+1.16)#27 | 0.67%(+1.05)#1,341 |
| 28. | Kemp Mill | 1.70% | 0.56%(+1.14)#28 | 0.67%(+1.04)#1,367 |
| 29. | Mays Chapel | 1.67% | 0.56%(+1.10)#29 | 0.67%(+1.000)#1,398 |
| 30. | Cloverly | 1.66% | 0.56%(+1.10)#30 | 0.67%(+0.994)#1,403 |
| 31. | Gaithersburg | 1.66% | 0.56%(+1.10)#31 | 0.67%(+0.993)#1,404 |
| 32. | Redland | 1.62% | 0.56%(+1.06)#32 | 0.67%(+0.957)#1,452 |
| 33. | Garrison | 1.53% | 0.56%(+0.964)#33 | 0.67%(+0.859)#1,569 |
| 34. | Greensboro | 1.51% | 0.56%(+0.949)#34 | 0.67%(+0.844)#1,589 |
| 35. | Riverside | 1.50% | 0.56%(+0.940)#35 | 0.67%(+0.835)#1,598 |
| 36. | Konterra | 1.45% | 0.56%(+0.887)#36 | 0.67%(+0.783)#1,669 |
| 37. | Cordova | 1.38% | 0.56%(+0.813)#37 | 0.67%(+0.708)#1,770 |
| 38. | North Kensington | 1.37% | 0.56%(+0.807)#38 | 0.67%(+0.702)#1,777 |
| 39. | Glenmont | 1.33% | 0.56%(+0.773)#39 | 0.67%(+0.668)#1,825 |
| 40. | Bowleys Quarters | 1.25% | 0.56%(+0.683)#40 | 0.67%(+0.578)#1,971 |
| 41. | Travilah | 1.24% | 0.56%(+0.673)#41 | 0.67%(+0.568)#1,990 |
| 42. | Owings Mills | 1.23% | 0.56%(+0.663)#42 | 0.67%(+0.559)#2,010 |
| 43. | Ridgely | 1.22% | 0.56%(+0.654)#43 | 0.67%(+0.549)#2,038 |
| 44. | College Park | 1.18% | 0.56%(+0.620)#44 | 0.67%(+0.515)#2,082 |
| 45. | Chevy Chase Section Three | 1.17% | 0.56%(+0.607)#45 | 0.67%(+0.502)#2,105 |
| 46. | Ilchester | 1.15% | 0.56%(+0.592)#46 | 0.67%(+0.487)#2,130 |
| 47. | Hebron | 1.15% | 0.56%(+0.591)#47 | 0.67%(+0.486)#2,132 |
| 48. | Ellicott City | 1.15% | 0.56%(+0.590)#48 | 0.67%(+0.485)#2,136 |
| 49. | Berlin | 1.15% | 0.56%(+0.585)#49 | 0.67%(+0.480)#2,144 |
| 50. | Buckeystown | 1.13% | 0.56%(+0.571)#50 | 0.67%(+0.466)#2,168 |
| 51. | Four Corners | 1.13% | 0.56%(+0.571)#51 | 0.67%(+0.466)#2,170 |
| 52. | Forest Heights | 1.10% | 0.56%(+0.536)#52 | 0.67%(+0.431)#2,251 |
| 53. | Pocomoke City | 1.07% | 0.56%(+0.503)#53 | 0.67%(+0.398)#2,319 |
| 54. | Monrovia | 1.04% | 0.56%(+0.478)#54 | 0.67%(+0.373)#2,376 |
| 55. | Carney | 1.01% | 0.56%(+0.446)#55 | 0.67%(+0.341)#2,446 |
| 56. | Chevy Chase Section Five | 1.01% | 0.56%(+0.443)#56 | 0.67%(+0.338)#2,451 |
| 57. | Catonsville | 0.99% | 0.56%(+0.427)#57 | 0.67%(+0.322)#2,486 |
| 58. | Lusby | 0.98% | 0.56%(+0.416)#58 | 0.67%(+0.312)#2,510 |
| 59. | Owings | 0.97% | 0.56%(+0.406)#59 | 0.67%(+0.301)#2,537 |
| 60. | Emmitsburg | 0.96% | 0.56%(+0.396)#60 | 0.67%(+0.291)#2,569 |
| 61. | Columbia | 0.95% | 0.56%(+0.392)#61 | 0.67%(+0.287)#2,576 |
| 62. | Jefferson | 0.91% | 0.56%(+0.349)#62 | 0.67%(+0.245)#2,696 |
| 63. | Deer Park | 0.89% | 0.56%(+0.328)#63 | 0.67%(+0.223)#2,746 |
| 64. | Chevy Chase | 0.87% | 0.56%(+0.306)#64 | 0.67%(+0.201)#2,813 |
| 65. | Germantown | 0.86% | 0.56%(+0.299)#65 | 0.67%(+0.194)#2,840 |
| 66. | Hillandale | 0.86% | 0.56%(+0.297)#66 | 0.67%(+0.193)#2,848 |
| 67. | Preston | 0.86% | 0.56%(+0.296)#67 | 0.67%(+0.191)#2,856 |
| 68. | Aspen Hill | 0.85% | 0.56%(+0.285)#68 | 0.67%(+0.181)#2,885 |
| 69. | Colesville | 0.84% | 0.56%(+0.277)#69 | 0.67%(+0.172)#2,903 |
| 70. | Edgewater | 0.82% | 0.56%(+0.255)#70 | 0.67%(+0.151)#2,959 |
| 71. | West Laurel | 0.81% | 0.56%(+0.246)#71 | 0.67%(+0.141)#2,986 |
| 72. | Braddock Heights | 0.81% | 0.56%(+0.243)#72 | 0.67%(+0.138)#2,995 |
| 73. | Havre De Grace | 0.77% | 0.56%(+0.211)#73 | 0.67%(+0.106)#3,111 |
| 74. | Montgomery Village | 0.77% | 0.56%(+0.203)#74 | 0.67%(+0.098)#3,133 |
| 75. | Frederick | 0.76% | 0.56%(+0.201)#75 | 0.67%(+0.096)#3,140 |
| 76. | Hampton | 0.73% | 0.56%(+0.166)#76 | 0.67%(+0.061)#3,251 |
| 77. | University Park | 0.73% | 0.56%(+0.166)#77 | 0.67%(+0.061)#3,253 |
| 78. | Glen Echo | 0.71% | 0.56%(+0.147)#78 | 0.67%(+0.042)#3,331 |
| 79. | Shady Side | 0.71% | 0.56%(+0.144)#79 | 0.67%(+0.039)#3,342 |
| 80. | Silver Spring | 0.69% | 0.56%(+0.132)#80 | 0.67%(+0.027)#3,393 |
| 81. | Mount Airy | 0.68% | 0.56%(+0.120)#81 | 0.67%(+0.016)#3,437 |
| 82. | Lanham | 0.67% | 0.56%(+0.107)#82 | 0.67%(+0.002)#3,495 |
| 83. | South Kensington | 0.66% | 0.56%(+0.095)#83 | 0.67%(-0.010)#3,545 |
| 84. | Burtonsville | 0.65% | 0.56%(+0.087)#84 | 0.67%(-0.018)#3,574 |
| 85. | Cabin John | 0.64% | 0.56%(+0.075)#85 | 0.67%(-0.030)#3,627 |
| 86. | Crofton | 0.62% | 0.56%(+0.054)#86 | 0.67%(-0.051)#3,705 |
| 87. | Andrews Afb | 0.61% | 0.56%(+0.051)#87 | 0.67%(-0.054)#3,728 |
| 88. | Ten Mile Creek | 0.61% | 0.56%(+0.043)#88 | 0.67%(-0.062)#3,761 |
| 89. | Cedarville | 0.60% | 0.56%(+0.042)#89 | 0.67%(-0.063)#3,766 |
| 90. | Bel Air | 0.59% | 0.56%(+0.030)#90 | 0.67%(-0.074)#3,816 |
| 91. | Chevy Chase Village | 0.58% | 0.56%(+0.021)#91 | 0.67%(-0.084)#3,856 |
| 92. | Middletown | 0.58% | 0.56%(+0.020)#92 | 0.67%(-0.085)#3,861 |
| 93. | White Marsh | 0.58% | 0.56%(+0.018)#93 | 0.67%(-0.087)#3,871 |
| 94. | Fruitland | 0.57% | 0.56%(+0.009)#94 | 0.67%(-0.096)#3,913 |
| 95. | Odenton | 0.56% | 0.56%(-0.003)#95 | 0.67%(-0.107)#3,962 |
| 96. | Beltsville | 0.55% | 0.56%(-0.009)#96 | 0.67%(-0.114)#3,987 |
| 97. | Eldersburg | 0.55% | 0.56%(-0.012)#97 | 0.67%(-0.117)#4,003 |
| 98. | Hyattsville | 0.55% | 0.56%(-0.016)#98 | 0.67%(-0.120)#4,017 |
| 99. | Gambrills | 0.55% | 0.56%(-0.016)#99 | 0.67%(-0.121)#4,021 |
| 100. | Clarksburg | 0.54% | 0.56%(-0.022)#100 | 0.67%(-0.127)#4,052 |
Common Questions
What are the Top 10 Cities with the Highest Percentage of Immigrants from Eastern Europe in Maryland?
Top 10 Cities with the Highest Percentage of Immigrants from Eastern Europe in Maryland are:
#1
50.00%
#2
10.05%
#3
7.62%
#4
7.12%
#5
5.34%
#6
4.33%
#7
4.29%
#8
4.16%
#9
3.54%
#10
3.31%
What city has the Highest Percentage of Immigrants from Eastern Europe in Maryland?
Spring Gap has the Highest Percentage of Immigrants from Eastern Europe in Maryland with 50.00%.
What is the Percentage of Immigrants from Eastern Europe in the State of Maryland?
Percentage of Immigrants from Eastern Europe in Maryland is 0.56%.
What is the Percentage of Immigrants from Eastern Europe in the United States?
Percentage of Immigrants from Eastern Europe in the United States is 0.67%.