Cities with the Highest Percentage of Immigrants from Chile in Maryland
RELATED REPORTS & OPTIONS
Chile
Maryland
Compare Cities
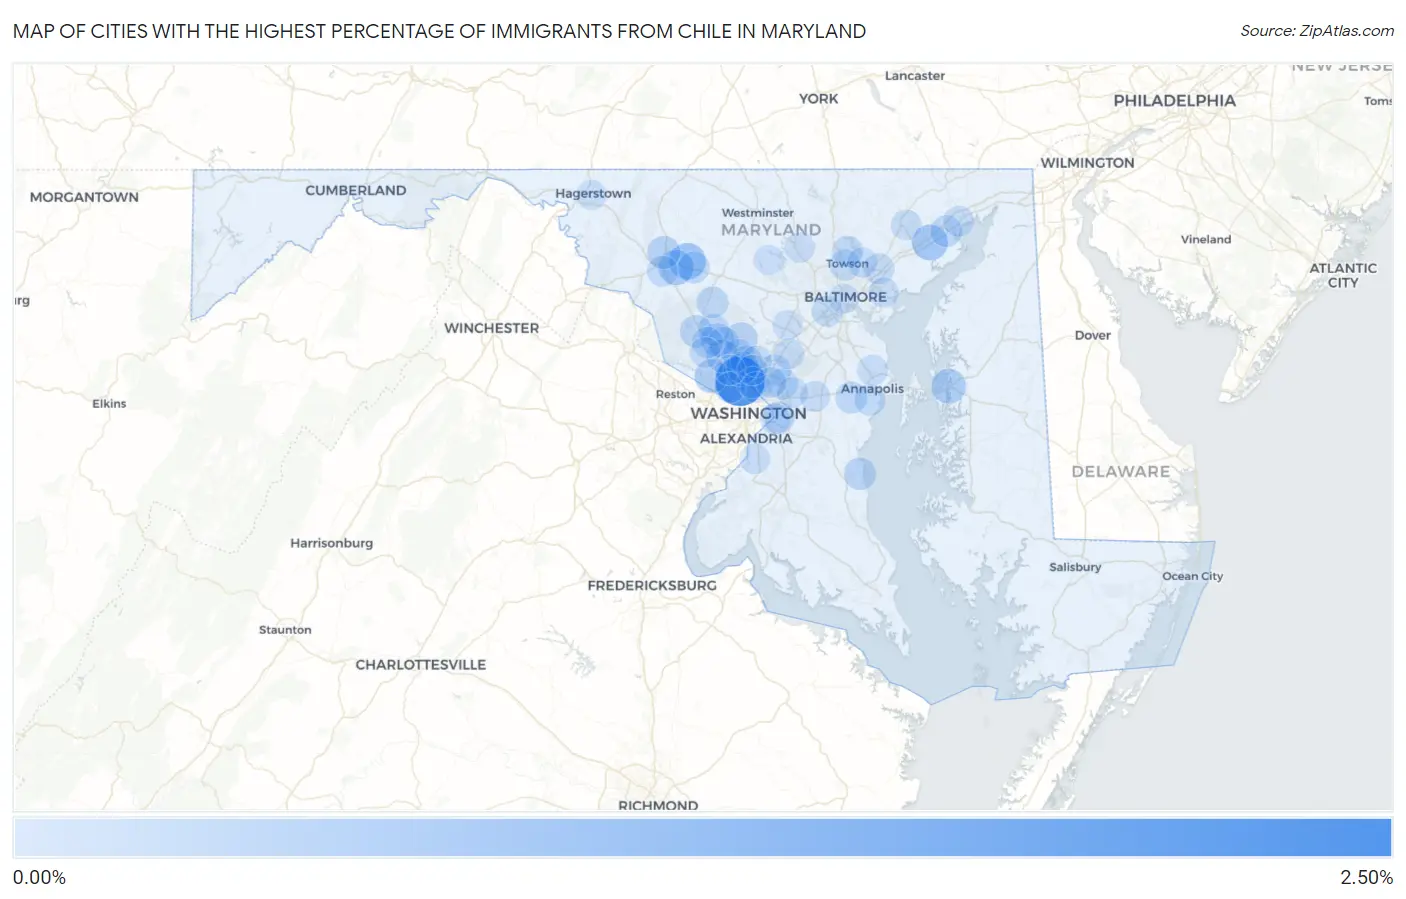
Map of Cities with the Highest Percentage of Immigrants from Chile in Maryland
0.00%
2.50%
Cities with the Highest Percentage of Immigrants from Chile in Maryland
| City | Chile | vs State | vs National | |
| 1. | North Chevy Chase | 2.20% | 0.040%(+2.16)#-1 | 0.032%(+2.17)#0 |
| 2. | Linganore | 0.70% | 0.040%(+0.659)#0 | 0.032%(+0.667)#1 |
| 3. | Riverside | 0.62% | 0.040%(+0.584)#1 | 0.032%(+0.592)#2 |
| 4. | Bartonsville | 0.55% | 0.040%(+0.508)#2 | 0.032%(+0.516)#3 |
| 5. | Queenstown | 0.49% | 0.040%(+0.451)#12 | 0.032%(+0.459)#182 |
| 6. | Potomac | 0.36% | 0.040%(+0.319)#156 | 0.032%(+0.327)#3,858 |
| 7. | Flower Hill | 0.34% | 0.040%(+0.302)#157 | 0.032%(+0.310)#3,859 |
| 8. | Washington Grove | 0.33% | 0.040%(+0.291)#158 | 0.032%(+0.299)#3,860 |
| 9. | Frederick | 0.33% | 0.040%(+0.289)#159 | 0.032%(+0.297)#3,861 |
| 10. | Olney | 0.30% | 0.040%(+0.255)#160 | 0.032%(+0.263)#3,862 |
| 11. | Rockville | 0.28% | 0.040%(+0.243)#161 | 0.032%(+0.251)#3,863 |
| 12. | Germantown | 0.26% | 0.040%(+0.218)#162 | 0.032%(+0.226)#3,864 |
| 13. | North Kensington | 0.24% | 0.040%(+0.196)#163 | 0.032%(+0.204)#3,865 |
| 14. | Chesapeake Beach | 0.24% | 0.040%(+0.196)#164 | 0.032%(+0.204)#3,866 |
| 15. | Capitol Heights | 0.20% | 0.040%(+0.158)#165 | 0.032%(+0.166)#3,867 |
| 16. | Aspen Hill | 0.20% | 0.040%(+0.157)#166 | 0.032%(+0.165)#3,868 |
| 17. | New Market | 0.20% | 0.040%(+0.155)#167 | 0.032%(+0.163)#3,869 |
| 18. | Wheaton | 0.20% | 0.040%(+0.155)#168 | 0.032%(+0.163)#3,870 |
| 19. | Riva | 0.19% | 0.040%(+0.148)#169 | 0.032%(+0.156)#3,871 |
| 20. | Montgomery Village | 0.18% | 0.040%(+0.141)#170 | 0.032%(+0.149)#3,872 |
| 21. | Aberdeen | 0.18% | 0.040%(+0.136)#171 | 0.032%(+0.144)#3,873 |
| 22. | Damascus | 0.17% | 0.040%(+0.132)#172 | 0.032%(+0.140)#3,874 |
| 23. | Redland | 0.17% | 0.040%(+0.129)#173 | 0.032%(+0.137)#3,875 |
| 24. | Beltsville | 0.16% | 0.040%(+0.122)#174 | 0.032%(+0.130)#3,876 |
| 25. | Glenmont | 0.14% | 0.040%(+0.104)#175 | 0.032%(+0.112)#3,877 |
| 26. | Greenbelt | 0.13% | 0.040%(+0.090)#176 | 0.032%(+0.098)#3,878 |
| 27. | Gaithersburg | 0.13% | 0.040%(+0.087)#177 | 0.032%(+0.095)#3,879 |
| 28. | Arbutus | 0.12% | 0.040%(+0.084)#178 | 0.032%(+0.092)#3,880 |
| 29. | Annapolis Neck | 0.12% | 0.040%(+0.078)#179 | 0.032%(+0.086)#3,881 |
| 30. | Silver Spring | 0.11% | 0.040%(+0.071)#180 | 0.032%(+0.079)#3,882 |
| 31. | Ballenger Creek | 0.10% | 0.040%(+0.063)#181 | 0.032%(+0.071)#3,883 |
| 32. | Towson | 0.10% | 0.040%(+0.062)#182 | 0.032%(+0.070)#3,980 |
| 33. | Colesville | 0.10% | 0.040%(+0.062)#183 | 0.032%(+0.070)#3,981 |
| 34. | Timonium | 0.10% | 0.040%(+0.062)#184 | 0.032%(+0.070)#3,982 |
| 35. | Havre De Grace | 0.088% | 0.040%(+0.048)#185 | 0.032%(+0.056)#3,983 |
| 36. | Arnold | 0.081% | 0.040%(+0.040)#186 | 0.032%(+0.048)#3,984 |
| 37. | Bethesda | 0.078% | 0.040%(+0.038)#187 | 0.032%(+0.046)#3,985 |
| 38. | Bel Air | 0.075% | 0.040%(+0.035)#188 | 0.032%(+0.043)#3,986 |
| 39. | Takoma Park | 0.074% | 0.040%(+0.034)#189 | 0.032%(+0.042)#3,987 |
| 40. | White Marsh | 0.068% | 0.040%(+0.028)#190 | 0.032%(+0.036)#3,988 |
| 41. | Laurel | 0.068% | 0.040%(+0.027)#191 | 0.032%(+0.035)#3,989 |
| 42. | Lanham | 0.060% | 0.040%(+0.020)#192 | 0.032%(+0.028)#3,990 |
| 43. | North Potomac | 0.057% | 0.040%(+0.017)#193 | 0.032%(+0.025)#3,991 |
| 44. | College Park | 0.055% | 0.040%(+0.015)#194 | 0.032%(+0.023)#3,992 |
| 45. | Coral Hills | 0.053% | 0.040%(+0.013)#195 | 0.032%(+0.021)#3,993 |
| 46. | Fort Washington | 0.050% | 0.040%(+0.010)#196 | 0.032%(+0.018)#3,994 |
| 47. | Carney | 0.034% | 0.040%(-0.006)#197 | 0.032%(+0.002)#4,254 |
| 48. | Reisterstown | 0.033% | 0.040%(-0.008)#198 | 0.032%(+0.000)#4,255 |
| 49. | North Bethesda | 0.032% | 0.040%(-0.008)#199 | 0.032%(-0.000)#4,256 |
| 50. | Bowie | 0.031% | 0.040%(-0.009)#200 | 0.032%(-0.001)#4,257 |
| 51. | Woodlawn Cdp Baltimore County | 0.028% | 0.040%(-0.012)#201 | 0.032%(-0.004)#4,258 |
| 52. | Kemp Mill | 0.028% | 0.040%(-0.012)#202 | 0.032%(-0.004)#4,259 |
| 53. | Essex | 0.024% | 0.040%(-0.016)#203 | 0.032%(-0.008)#4,260 |
| 54. | Eldersburg | 0.016% | 0.040%(-0.024)#204 | 0.032%(-0.016)#4,261 |
| 55. | Columbia | 0.015% | 0.040%(-0.025)#205 | 0.032%(-0.017)#4,262 |
| 56. | Baltimore | 0.0099% | 0.040%(-0.030)#206 | 0.032%(-0.022)#4,263 |
| 57. | Hagerstown | 0.0092% | 0.040%(-0.031)#207 | 0.032%(-0.023)#4,264 |
Common Questions
What are the Top 10 Cities with the Highest Percentage of Immigrants from Chile in Maryland?
Top 10 Cities with the Highest Percentage of Immigrants from Chile in Maryland are:
#1
2.20%
#2
0.70%
#3
0.62%
#4
0.55%
#5
0.49%
#6
0.36%
#7
0.33%
#8
0.33%
#9
0.30%
#10
0.28%
What city has the Highest Percentage of Immigrants from Chile in Maryland?
North Chevy Chase has the Highest Percentage of Immigrants from Chile in Maryland with 2.20%.
What is the Percentage of Immigrants from Chile in the State of Maryland?
Percentage of Immigrants from Chile in Maryland is 0.040%.
What is the Percentage of Immigrants from Chile in the United States?
Percentage of Immigrants from Chile in the United States is 0.032%.