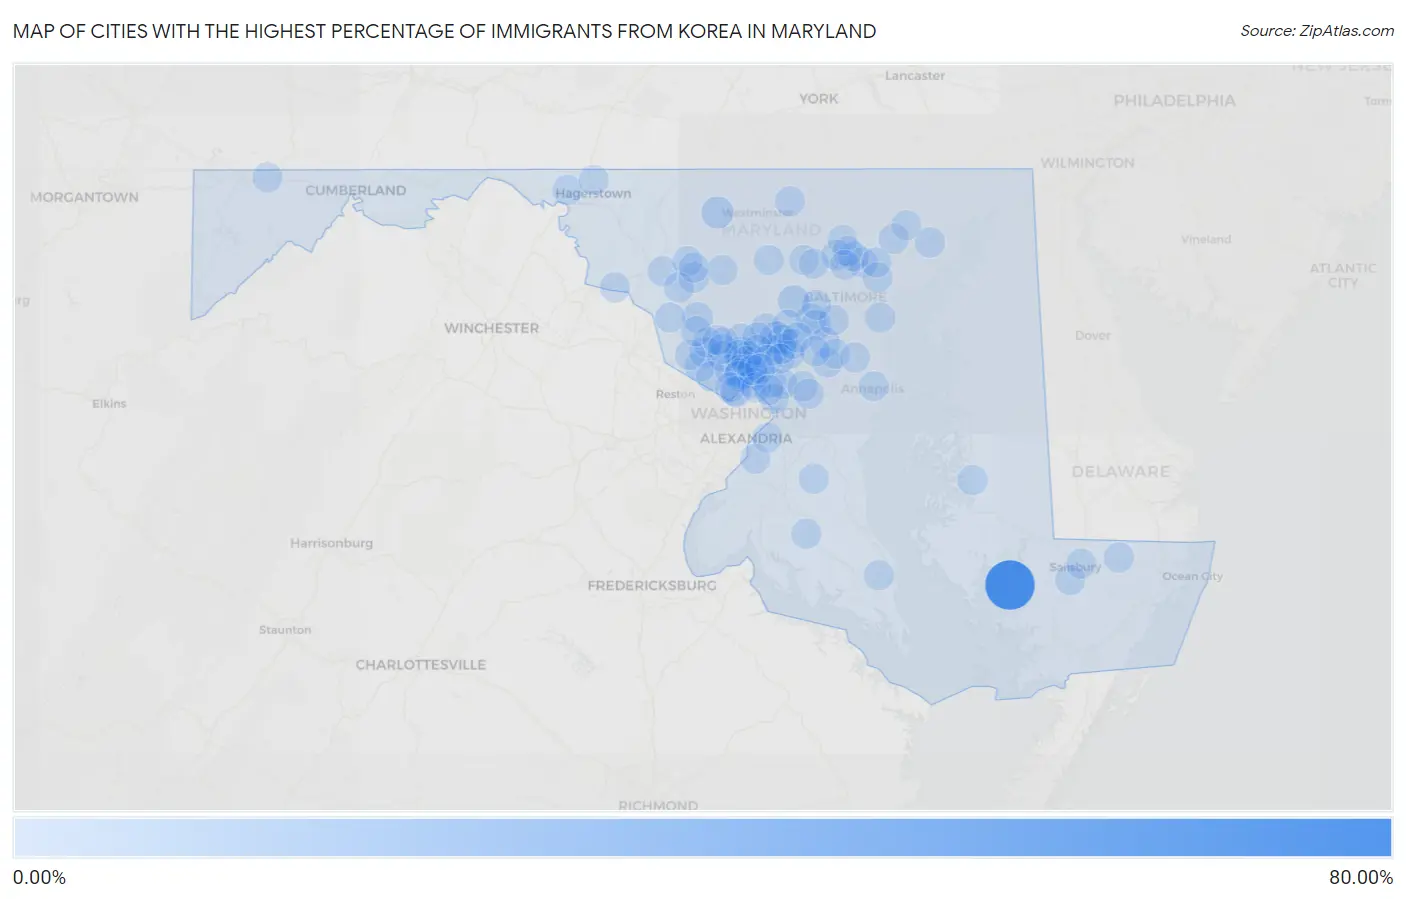
Cities with the Highest Percentage of Immigrants from Korea in Maryland
RELATED REPORTS & OPTIONS
Korea
Maryland
Compare Cities
Map of Cities with the Highest Percentage of Immigrants from Korea in Maryland
0.00%
80.00%
Cities with the Highest Percentage of Immigrants from Korea in Maryland
| City | Korea | vs State | vs National | |
| 1. | Bivalve | 62.26% | 0.53%(+61.7)#1 | 0.31%(+62.0)#1 |
| 2. | Fulton | 6.29% | 0.53%(+5.76)#2 | 0.31%(+5.98)#70 |
| 3. | Union Bridge | 6.18% | 0.53%(+5.65)#3 | 0.31%(+5.86)#75 |
| 4. | Ellicott City | 5.40% | 0.53%(+4.87)#4 | 0.31%(+5.09)#88 |
| 5. | Leisure World | 5.19% | 0.53%(+4.66)#5 | 0.31%(+4.88)#95 |
| 6. | Clarksburg | 3.20% | 0.53%(+2.67)#6 | 0.31%(+2.88)#171 |
| 7. | Ilchester | 2.65% | 0.53%(+2.12)#7 | 0.31%(+2.34)#228 |
| 8. | Travilah | 2.65% | 0.53%(+2.12)#8 | 0.31%(+2.33)#229 |
| 9. | North Potomac | 2.41% | 0.53%(+1.88)#9 | 0.31%(+2.10)#266 |
| 10. | Laurel | 2.38% | 0.53%(+1.85)#10 | 0.31%(+2.06)#273 |
| 11. | Elkridge | 2.35% | 0.53%(+1.82)#11 | 0.31%(+2.04)#279 |
| 12. | Burtonsville | 2.30% | 0.53%(+1.77)#12 | 0.31%(+1.99)#288 |
| 13. | Highland | 2.27% | 0.53%(+1.74)#13 | 0.31%(+1.95)#301 |
| 14. | Monrovia | 2.11% | 0.53%(+1.58)#14 | 0.31%(+1.80)#323 |
| 15. | Scaggsville | 2.01% | 0.53%(+1.48)#15 | 0.31%(+1.70)#349 |
| 16. | Rockville | 1.87% | 0.53%(+1.34)#16 | 0.31%(+1.56)#391 |
| 17. | Olney | 1.73% | 0.53%(+1.20)#17 | 0.31%(+1.42)#427 |
| 18. | West Laurel | 1.71% | 0.53%(+1.18)#18 | 0.31%(+1.40)#439 |
| 19. | Mays Chapel | 1.69% | 0.53%(+1.16)#19 | 0.31%(+1.38)#443 |
| 20. | Potomac | 1.55% | 0.53%(+1.02)#20 | 0.31%(+1.23)#496 |
| 21. | Columbia | 1.50% | 0.53%(+0.973)#21 | 0.31%(+1.19)#515 |
| 22. | Riverside | 1.50% | 0.53%(+0.973)#22 | 0.31%(+1.19)#517 |
| 23. | Redland | 1.44% | 0.53%(+0.909)#23 | 0.31%(+1.13)#549 |
| 24. | Colesville | 1.38% | 0.53%(+0.850)#24 | 0.31%(+1.07)#578 |
| 25. | Severn | 1.38% | 0.53%(+0.847)#25 | 0.31%(+1.06)#580 |
| 26. | North Bethesda | 1.33% | 0.53%(+0.805)#26 | 0.31%(+1.02)#605 |
| 27. | Wilson Conococheague | 1.24% | 0.53%(+0.710)#27 | 0.31%(+0.927)#664 |
| 28. | Pleasant Hills | 1.22% | 0.53%(+0.693)#28 | 0.31%(+0.911)#670 |
| 29. | Pittsville | 1.18% | 0.53%(+0.649)#29 | 0.31%(+0.867)#695 |
| 30. | Layhill | 1.16% | 0.53%(+0.634)#30 | 0.31%(+0.851)#707 |
| 31. | Carney | 1.15% | 0.53%(+0.618)#31 | 0.31%(+0.836)#724 |
| 32. | College Park | 1.10% | 0.53%(+0.572)#32 | 0.31%(+0.789)#758 |
| 33. | Trappe | 1.08% | 0.53%(+0.550)#33 | 0.31%(+0.767)#785 |
| 34. | North Kensington | 1.07% | 0.53%(+0.544)#34 | 0.31%(+0.762)#791 |
| 35. | North Laurel | 1.05% | 0.53%(+0.523)#35 | 0.31%(+0.740)#813 |
| 36. | Darnestown | 1.05% | 0.53%(+0.520)#36 | 0.31%(+0.737)#816 |
| 37. | Gaithersburg | 1.00% | 0.53%(+0.469)#37 | 0.31%(+0.686)#870 |
| 38. | Aspen Hill | 1.00% | 0.53%(+0.466)#38 | 0.31%(+0.683)#873 |
| 39. | Mount Airy | 0.99% | 0.53%(+0.463)#39 | 0.31%(+0.681)#874 |
| 40. | Odenton | 0.98% | 0.53%(+0.448)#40 | 0.31%(+0.665)#895 |
| 41. | Friendship Heights Village | 0.97% | 0.53%(+0.444)#41 | 0.31%(+0.661)#900 |
| 42. | Germantown | 0.94% | 0.53%(+0.413)#42 | 0.31%(+0.630)#941 |
| 43. | Greenbelt | 0.92% | 0.53%(+0.391)#43 | 0.31%(+0.609)#963 |
| 44. | Hampton | 0.91% | 0.53%(+0.376)#44 | 0.31%(+0.593)#983 |
| 45. | Kensington | 0.89% | 0.53%(+0.363)#45 | 0.31%(+0.580)#997 |
| 46. | Ballenger Creek | 0.88% | 0.53%(+0.354)#46 | 0.31%(+0.571)#1,011 |
| 47. | Glenn Dale | 0.88% | 0.53%(+0.349)#47 | 0.31%(+0.567)#1,018 |
| 48. | Four Corners | 0.85% | 0.53%(+0.320)#48 | 0.31%(+0.537)#1,055 |
| 49. | Linthicum | 0.82% | 0.53%(+0.290)#49 | 0.31%(+0.508)#1,098 |
| 50. | Woodlawn Cdp Baltimore County | 0.80% | 0.53%(+0.271)#50 | 0.31%(+0.488)#1,126 |
| 51. | Fruitland | 0.79% | 0.53%(+0.256)#51 | 0.31%(+0.473)#1,141 |
| 52. | Cloverly | 0.76% | 0.53%(+0.231)#52 | 0.31%(+0.448)#1,175 |
| 53. | South Kensington | 0.74% | 0.53%(+0.211)#53 | 0.31%(+0.428)#1,204 |
| 54. | Linganore | 0.73% | 0.53%(+0.203)#54 | 0.31%(+0.421)#1,215 |
| 55. | Grantsville | 0.73% | 0.53%(+0.203)#55 | 0.31%(+0.420)#1,217 |
| 56. | Salisbury | 0.71% | 0.53%(+0.183)#56 | 0.31%(+0.401)#1,246 |
| 57. | Charlotte Hall | 0.71% | 0.53%(+0.180)#57 | 0.31%(+0.397)#1,258 |
| 58. | Rossville | 0.68% | 0.53%(+0.148)#58 | 0.31%(+0.365)#1,304 |
| 59. | Urbana | 0.67% | 0.53%(+0.143)#59 | 0.31%(+0.361)#1,315 |
| 60. | New Market | 0.65% | 0.53%(+0.122)#60 | 0.31%(+0.340)#1,364 |
| 61. | Silver Spring | 0.65% | 0.53%(+0.121)#61 | 0.31%(+0.338)#1,367 |
| 62. | Perry Hall | 0.65% | 0.53%(+0.120)#62 | 0.31%(+0.337)#1,368 |
| 63. | Bethesda | 0.64% | 0.53%(+0.107)#63 | 0.31%(+0.324)#1,397 |
| 64. | Owings Mills | 0.61% | 0.53%(+0.082)#64 | 0.31%(+0.299)#1,454 |
| 65. | Derwood | 0.59% | 0.53%(+0.065)#65 | 0.31%(+0.282)#1,489 |
| 66. | Green Valley | 0.59% | 0.53%(+0.064)#66 | 0.31%(+0.281)#1,494 |
| 67. | Fort Washington | 0.59% | 0.53%(+0.063)#67 | 0.31%(+0.280)#1,500 |
| 68. | Brunswick | 0.59% | 0.53%(+0.062)#68 | 0.31%(+0.279)#1,502 |
| 69. | Hampstead | 0.59% | 0.53%(+0.060)#69 | 0.31%(+0.277)#1,505 |
| 70. | Somerset | 0.58% | 0.53%(+0.054)#70 | 0.31%(+0.271)#1,521 |
| 71. | Baden | 0.58% | 0.53%(+0.049)#71 | 0.31%(+0.266)#1,531 |
| 72. | Glenmont | 0.57% | 0.53%(+0.036)#72 | 0.31%(+0.253)#1,560 |
| 73. | Ashton Sandy Spring | 0.56% | 0.53%(+0.026)#73 | 0.31%(+0.243)#1,584 |
| 74. | Takoma Park | 0.55% | 0.53%(+0.023)#74 | 0.31%(+0.241)#1,588 |
| 75. | Fairwood | 0.55% | 0.53%(+0.019)#75 | 0.31%(+0.236)#1,599 |
| 76. | Eldersburg | 0.54% | 0.53%(+0.011)#76 | 0.31%(+0.228)#1,625 |
| 77. | Barnesville | 0.54% | 0.53%(+0.008)#77 | 0.31%(+0.225)#1,632 |
| 78. | Bladensburg | 0.52% | 0.53%(-0.007)#78 | 0.31%(+0.210)#1,681 |
| 79. | Gambrills | 0.51% | 0.53%(-0.015)#79 | 0.31%(+0.202)#1,705 |
| 80. | Edgemere | 0.51% | 0.53%(-0.023)#80 | 0.31%(+0.194)#1,731 |
| 81. | Washington Grove | 0.50% | 0.53%(-0.033)#81 | 0.31%(+0.184)#1,754 |
| 82. | Garrison | 0.49% | 0.53%(-0.038)#82 | 0.31%(+0.179)#1,769 |
| 83. | Konterra | 0.48% | 0.53%(-0.046)#83 | 0.31%(+0.171)#1,803 |
| 84. | Fairland | 0.47% | 0.53%(-0.060)#84 | 0.31%(+0.157)#1,855 |
| 85. | Cockeysville | 0.46% | 0.53%(-0.065)#85 | 0.31%(+0.152)#1,871 |
| 86. | Severna Park | 0.46% | 0.53%(-0.067)#86 | 0.31%(+0.150)#1,879 |
| 87. | Naval Academy | 0.45% | 0.53%(-0.083)#87 | 0.31%(+0.134)#1,933 |
| 88. | Kemp Mill | 0.44% | 0.53%(-0.090)#88 | 0.31%(+0.127)#1,956 |
| 89. | Savage | 0.44% | 0.53%(-0.091)#89 | 0.31%(+0.126)#1,959 |
| 90. | Timonium | 0.44% | 0.53%(-0.094)#90 | 0.31%(+0.123)#1,980 |
| 91. | Fountainhead Orchard Hills | 0.42% | 0.53%(-0.110)#91 | 0.31%(+0.107)#2,044 |
| 92. | Towson | 0.37% | 0.53%(-0.155)#92 | 0.31%(+0.063)#2,226 |
| 93. | Flower Hill | 0.36% | 0.53%(-0.167)#93 | 0.31%(+0.050)#2,272 |
| 94. | Solomons | 0.36% | 0.53%(-0.173)#94 | 0.31%(+0.044)#2,291 |
| 95. | White Oak | 0.36% | 0.53%(-0.175)#95 | 0.31%(+0.043)#2,298 |
| 96. | Catonsville | 0.35% | 0.53%(-0.177)#96 | 0.31%(+0.041)#2,307 |
| 97. | Fort Meade | 0.35% | 0.53%(-0.180)#97 | 0.31%(+0.037)#2,324 |
| 98. | Temple Hills | 0.35% | 0.53%(-0.181)#98 | 0.31%(+0.037)#2,326 |
| 99. | Bel Air | 0.35% | 0.53%(-0.182)#99 | 0.31%(+0.036)#2,334 |
| 100. | University Park | 0.34% | 0.53%(-0.185)#100 | 0.31%(+0.032)#2,350 |
Common Questions
What are the Top 10 Cities with the Highest Percentage of Immigrants from Korea in Maryland?
Top 10 Cities with the Highest Percentage of Immigrants from Korea in Maryland are:
#1
62.26%
#2
6.29%
#3
6.18%
#4
5.40%
#5
5.19%
#6
3.20%
#7
2.65%
#8
2.65%
#9
2.41%
#10
2.38%
What city has the Highest Percentage of Immigrants from Korea in Maryland?
Bivalve has the Highest Percentage of Immigrants from Korea in Maryland with 62.26%.
What is the Percentage of Immigrants from Korea in the State of Maryland?
Percentage of Immigrants from Korea in Maryland is 0.53%.
What is the Percentage of Immigrants from Korea in the United States?
Percentage of Immigrants from Korea in the United States is 0.31%.