Cities with the Most Immigrants from Mexico in Maryland
RELATED REPORTS & OPTIONS
Mexico
Maryland
Compare Cities
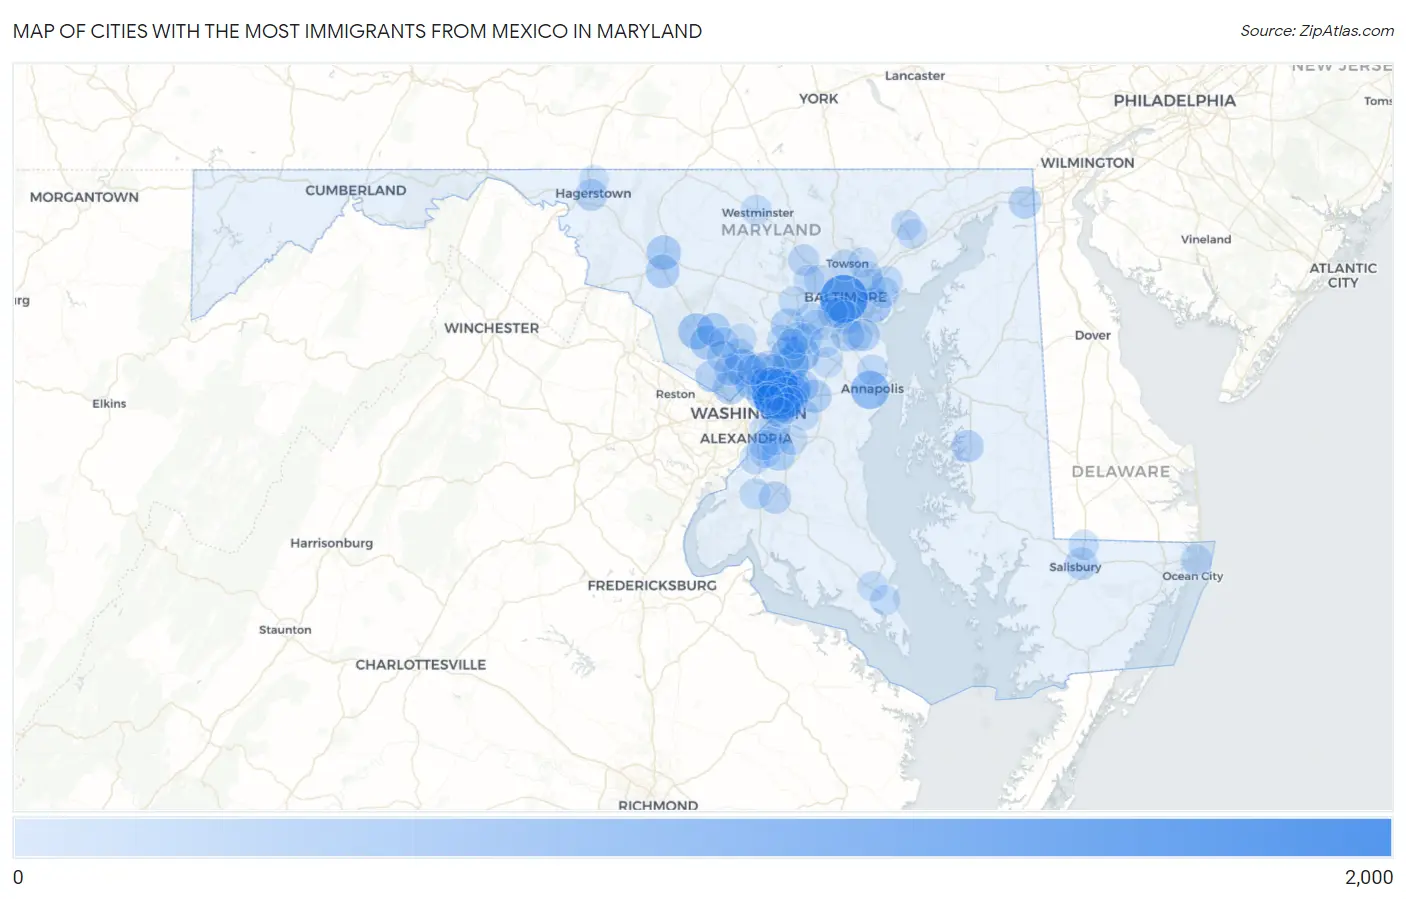
Map of Cities with the Most Immigrants from Mexico in Maryland
0
2,000
Cities with the Most Immigrants from Mexico in Maryland
| City | Mexico | vs State | vs National | |
| 1. | East Riverdale | 1,943 | 34,065(5.70%)#1 | 10,767,104(0.02%)#729 |
| 2. | Baltimore | 1,761 | 34,065(5.17%)#2 | 10,767,104(0.02%)#783 |
| 3. | Bladensburg | 883 | 34,065(2.59%)#3 | 10,767,104(0.01%)#1,284 |
| 4. | Annapolis | 819 | 34,065(2.40%)#4 | 10,767,104(0.01%)#1,357 |
| 5. | Riverdale Park | 759 | 34,065(2.23%)#5 | 10,767,104(0.01%)#1,448 |
| 6. | Seabrook | 695 | 34,065(2.04%)#6 | 10,767,104(0.01%)#1,533 |
| 7. | Wheaton | 686 | 34,065(2.01%)#7 | 10,767,104(0.01%)#1,548 |
| 8. | Maryland City | 615 | 34,065(1.81%)#8 | 10,767,104(0.01%)#1,675 |
| 9. | Germantown | 594 | 34,065(1.74%)#9 | 10,767,104(0.01%)#1,715 |
| 10. | South Laurel | 593 | 34,065(1.74%)#10 | 10,767,104(0.01%)#1,719 |
| 11. | Landover | 586 | 34,065(1.72%)#11 | 10,767,104(0.01%)#1,730 |
| 12. | Dundalk | 536 | 34,065(1.57%)#12 | 10,767,104(0.00%)#1,846 |
| 13. | Gaithersburg | 486 | 34,065(1.43%)#13 | 10,767,104(0.00%)#1,959 |
| 14. | Silver Spring | 479 | 34,065(1.41%)#14 | 10,767,104(0.00%)#1,980 |
| 15. | Laurel | 476 | 34,065(1.40%)#15 | 10,767,104(0.00%)#1,989 |
| 16. | Frederick | 462 | 34,065(1.36%)#16 | 10,767,104(0.00%)#2,018 |
| 17. | Lanham | 460 | 34,065(1.35%)#17 | 10,767,104(0.00%)#2,030 |
| 18. | Chillum | 435 | 34,065(1.28%)#18 | 10,767,104(0.00%)#2,103 |
| 19. | Bethesda | 413 | 34,065(1.21%)#19 | 10,767,104(0.00%)#2,173 |
| 20. | Montgomery Village | 407 | 34,065(1.19%)#20 | 10,767,104(0.00%)#2,197 |
| 21. | Clinton | 402 | 34,065(1.18%)#21 | 10,767,104(0.00%)#2,214 |
| 22. | Ballenger Creek | 397 | 34,065(1.17%)#22 | 10,767,104(0.00%)#2,237 |
| 23. | Columbia | 370 | 34,065(1.09%)#23 | 10,767,104(0.00%)#2,343 |
| 24. | Brooklyn Park | 358 | 34,065(1.05%)#24 | 10,767,104(0.00%)#2,384 |
| 25. | Bowie | 352 | 34,065(1.03%)#25 | 10,767,104(0.00%)#2,406 |
| 26. | Glen Burnie | 336 | 34,065(0.99%)#26 | 10,767,104(0.00%)#2,494 |
| 27. | Hyattsville | 310 | 34,065(0.91%)#27 | 10,767,104(0.00%)#2,610 |
| 28. | Salisbury | 289 | 34,065(0.85%)#28 | 10,767,104(0.00%)#2,739 |
| 29. | Elkton | 289 | 34,065(0.85%)#29 | 10,767,104(0.00%)#2,740 |
| 30. | Easton | 286 | 34,065(0.84%)#30 | 10,767,104(0.00%)#2,763 |
| 31. | Riviera Beach | 276 | 34,065(0.81%)#31 | 10,767,104(0.00%)#2,807 |
| 32. | Glenn Dale | 273 | 34,065(0.80%)#32 | 10,767,104(0.00%)#2,827 |
| 33. | Beltsville | 263 | 34,065(0.77%)#33 | 10,767,104(0.00%)#2,888 |
| 34. | Aspen Hill | 262 | 34,065(0.77%)#34 | 10,767,104(0.00%)#2,896 |
| 35. | Waldorf | 256 | 34,065(0.75%)#35 | 10,767,104(0.00%)#2,934 |
| 36. | Hagerstown | 243 | 34,065(0.71%)#36 | 10,767,104(0.00%)#3,014 |
| 37. | White Oak | 238 | 34,065(0.70%)#37 | 10,767,104(0.00%)#3,041 |
| 38. | Woodlawn Cdp Prince George S County | 231 | 34,065(0.68%)#38 | 10,767,104(0.00%)#3,086 |
| 39. | Ilchester | 227 | 34,065(0.67%)#39 | 10,767,104(0.00%)#3,112 |
| 40. | Potomac | 219 | 34,065(0.64%)#40 | 10,767,104(0.00%)#3,169 |
| 41. | Langley Park | 211 | 34,065(0.62%)#41 | 10,767,104(0.00%)#3,230 |
| 42. | North Bethesda | 209 | 34,065(0.61%)#42 | 10,767,104(0.00%)#3,239 |
| 43. | Rockville | 204 | 34,065(0.60%)#43 | 10,767,104(0.00%)#3,287 |
| 44. | Adelphi | 202 | 34,065(0.59%)#44 | 10,767,104(0.00%)#3,313 |
| 45. | Owings Mills | 188 | 34,065(0.55%)#45 | 10,767,104(0.00%)#3,448 |
| 46. | Calverton | 187 | 34,065(0.55%)#46 | 10,767,104(0.00%)#3,467 |
| 47. | Ocean City | 178 | 34,065(0.52%)#47 | 10,767,104(0.00%)#3,581 |
| 48. | Flower Hill | 177 | 34,065(0.52%)#48 | 10,767,104(0.00%)#3,594 |
| 49. | Essex | 175 | 34,065(0.51%)#49 | 10,767,104(0.00%)#3,612 |
| 50. | Baltimore Highlands | 174 | 34,065(0.51%)#50 | 10,767,104(0.00%)#3,623 |
| 51. | Towson | 173 | 34,065(0.51%)#51 | 10,767,104(0.00%)#3,633 |
| 52. | Greenbelt | 166 | 34,065(0.49%)#52 | 10,767,104(0.00%)#3,721 |
| 53. | Fort Washington | 161 | 34,065(0.47%)#53 | 10,767,104(0.00%)#3,789 |
| 54. | Friendly | 159 | 34,065(0.47%)#54 | 10,767,104(0.00%)#3,817 |
| 55. | Woodlawn Cdp Baltimore County | 155 | 34,065(0.46%)#55 | 10,767,104(0.00%)#3,852 |
| 56. | Rosedale | 155 | 34,065(0.46%)#56 | 10,767,104(0.00%)#3,857 |
| 57. | Kettering | 148 | 34,065(0.43%)#57 | 10,767,104(0.00%)#3,956 |
| 58. | Arnold | 147 | 34,065(0.43%)#58 | 10,767,104(0.00%)#3,972 |
| 59. | Edmonston | 147 | 34,065(0.43%)#59 | 10,767,104(0.00%)#3,980 |
| 60. | Suitland | 144 | 34,065(0.42%)#60 | 10,767,104(0.00%)#4,014 |
| 61. | New Carrollton | 144 | 34,065(0.42%)#61 | 10,767,104(0.00%)#4,017 |
| 62. | Middle River | 143 | 34,065(0.42%)#62 | 10,767,104(0.00%)#4,029 |
| 63. | Bensville | 143 | 34,065(0.42%)#63 | 10,767,104(0.00%)#4,034 |
| 64. | Savage | 141 | 34,065(0.41%)#64 | 10,767,104(0.00%)#4,063 |
| 65. | College Park | 139 | 34,065(0.41%)#65 | 10,767,104(0.00%)#4,085 |
| 66. | Scaggsville | 138 | 34,065(0.41%)#66 | 10,767,104(0.00%)#4,098 |
| 67. | Jessup | 135 | 34,065(0.40%)#67 | 10,767,104(0.00%)#4,129 |
| 68. | North Laurel | 125 | 34,065(0.37%)#68 | 10,767,104(0.00%)#4,279 |
| 69. | Camp Springs | 124 | 34,065(0.36%)#69 | 10,767,104(0.00%)#4,302 |
| 70. | Lansdowne | 124 | 34,065(0.36%)#70 | 10,767,104(0.00%)#4,304 |
| 71. | Hillcrest Heights | 122 | 34,065(0.36%)#71 | 10,767,104(0.00%)#4,339 |
| 72. | Brentwood | 114 | 34,065(0.33%)#72 | 10,767,104(0.00%)#4,477 |
| 73. | Westminster | 112 | 34,065(0.33%)#73 | 10,767,104(0.00%)#4,511 |
| 74. | Springdale | 111 | 34,065(0.33%)#74 | 10,767,104(0.00%)#4,541 |
| 75. | Milford Mill | 109 | 34,065(0.32%)#75 | 10,767,104(0.00%)#4,559 |
| 76. | Odenton | 108 | 34,065(0.32%)#76 | 10,767,104(0.00%)#4,575 |
| 77. | Olney | 107 | 34,065(0.31%)#77 | 10,767,104(0.00%)#4,602 |
| 78. | California | 106 | 34,065(0.31%)#78 | 10,767,104(0.00%)#4,621 |
| 79. | Delmar | 104 | 34,065(0.31%)#79 | 10,767,104(0.00%)#4,663 |
| 80. | Lexington Park | 102 | 34,065(0.30%)#80 | 10,767,104(0.00%)#4,696 |
| 81. | Glenarden | 101 | 34,065(0.30%)#81 | 10,767,104(0.00%)#4,723 |
| 82. | Elkridge | 100 | 34,065(0.29%)#82 | 10,767,104(0.00%)#4,737 |
| 83. | Oxon Hill | 93 | 34,065(0.27%)#83 | 10,767,104(0.00%)#4,882 |
| 84. | Kemp Mill | 92 | 34,065(0.27%)#84 | 10,767,104(0.00%)#4,906 |
| 85. | Severn | 91 | 34,065(0.27%)#85 | 10,767,104(0.00%)#4,924 |
| 86. | Redland | 91 | 34,065(0.27%)#86 | 10,767,104(0.00%)#4,927 |
| 87. | Bel Air | 89 | 34,065(0.26%)#87 | 10,767,104(0.00%)#4,981 |
| 88. | Fairmount Heights | 88 | 34,065(0.26%)#88 | 10,767,104(0.00%)#5,019 |
| 89. | Melwood | 86 | 34,065(0.25%)#89 | 10,767,104(0.00%)#5,061 |
| 90. | Ellicott City | 84 | 34,065(0.25%)#90 | 10,767,104(0.00%)#5,101 |
| 91. | Carney | 77 | 34,065(0.23%)#91 | 10,767,104(0.00%)#5,283 |
| 92. | Bel Air South | 76 | 34,065(0.22%)#92 | 10,767,104(0.00%)#5,307 |
| 93. | Lochearn | 75 | 34,065(0.22%)#93 | 10,767,104(0.00%)#5,337 |
| 94. | Landover Hills | 72 | 34,065(0.21%)#94 | 10,767,104(0.00%)#5,447 |
| 95. | Pasadena | 70 | 34,065(0.21%)#95 | 10,767,104(0.00%)#5,490 |
| 96. | Summerfield | 70 | 34,065(0.21%)#96 | 10,767,104(0.00%)#5,493 |
| 97. | Fountainhead Orchard Hills | 68 | 34,065(0.20%)#97 | 10,767,104(0.00%)#5,565 |
| 98. | Seat Pleasant | 68 | 34,065(0.20%)#98 | 10,767,104(0.00%)#5,569 |
| 99. | Cottage City | 66 | 34,065(0.19%)#99 | 10,767,104(0.00%)#5,648 |
| 100. | Overlea | 65 | 34,065(0.19%)#100 | 10,767,104(0.00%)#5,665 |
Common Questions
What are the Top 10 Cities with the Most Immigrants from Mexico in Maryland?
Top 10 Cities with the Most Immigrants from Mexico in Maryland are:
#1
1,943
#2
1,761
#3
883
#4
819
#5
759
#6
695
#7
686
#8
615
#9
594
#10
593
What city has the Most Immigrants from Mexico in Maryland?
East Riverdale has the Most Immigrants from Mexico in Maryland with 1,943.
What is the Total Immigrants from Mexico in the State of Maryland?
Total Immigrants from Mexico in Maryland is 34,065.
What is the Total Immigrants from Mexico in the United States?
Total Immigrants from Mexico in the United States is 10,767,104.