Cities with the Highest Percentage of Immigrants from Venezuela in Maryland
RELATED REPORTS & OPTIONS
Venezuela
Maryland
Compare Cities
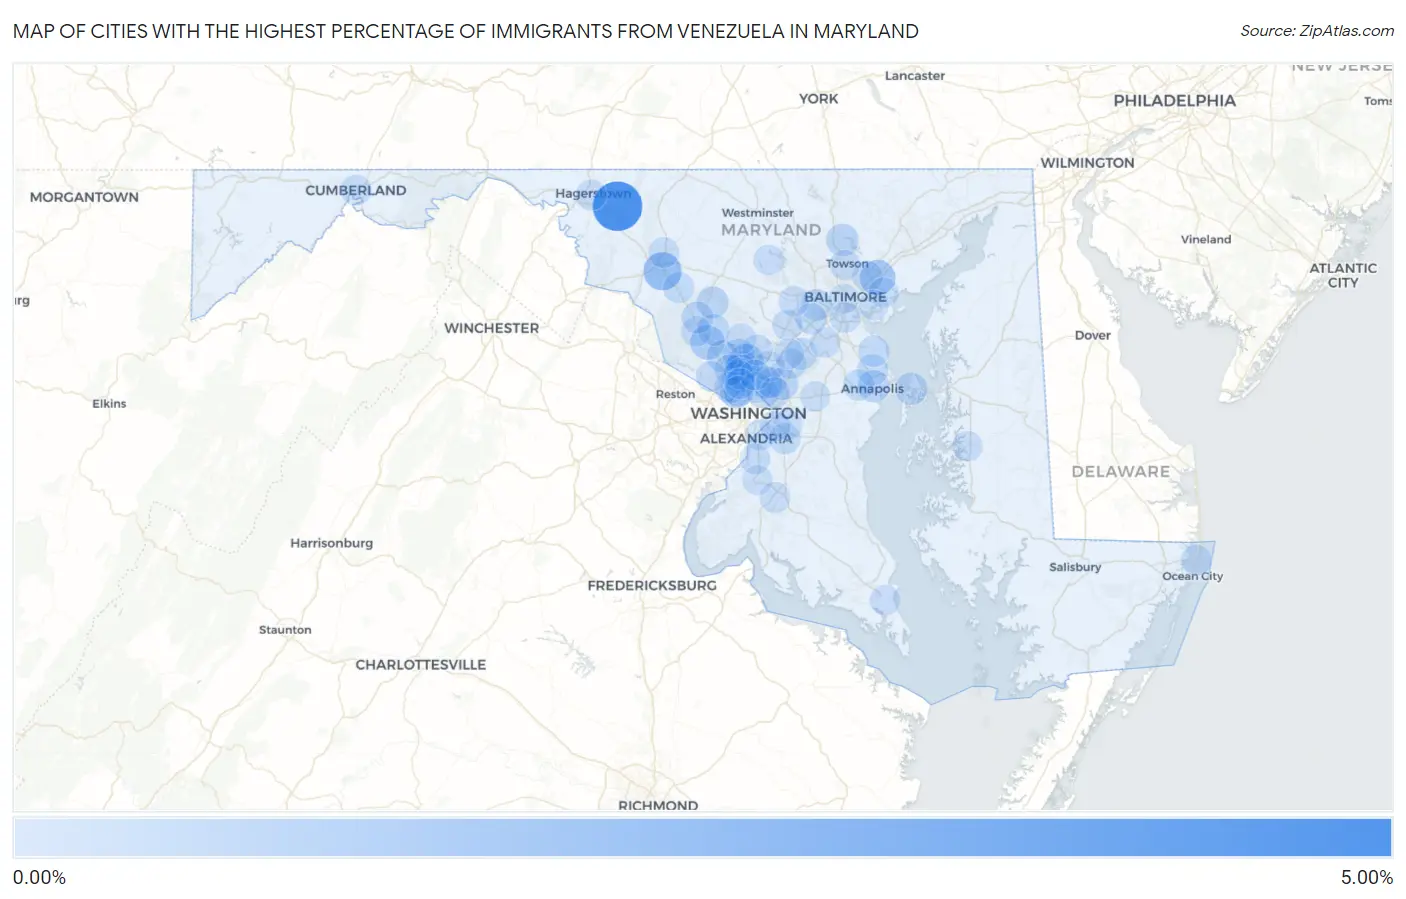
Map of Cities with the Highest Percentage of Immigrants from Venezuela in Maryland
0.00%
5.00%
Cities with the Highest Percentage of Immigrants from Venezuela in Maryland
| City | Venezuela | vs State | vs National | |
| 1. | Mount Aetna | 4.05% | 0.080%(+3.97)#22 | 0.16%(+3.90)#574 |
| 2. | Ballenger Creek | 1.62% | 0.080%(+1.54)#34 | 0.16%(+1.46)#812 |
| 3. | Rossville | 1.05% | 0.080%(+0.972)#107 | 0.16%(+0.895)#2,646 |
| 4. | Glenmont | 0.97% | 0.080%(+0.888)#108 | 0.16%(+0.811)#2,647 |
| 5. | Gaithersburg | 0.87% | 0.080%(+0.791)#109 | 0.16%(+0.714)#2,648 |
| 6. | Wheaton | 0.47% | 0.080%(+0.388)#110 | 0.16%(+0.311)#2,649 |
| 7. | Cockeysville | 0.46% | 0.080%(+0.385)#179 | 0.16%(+0.308)#4,383 |
| 8. | North Kensington | 0.45% | 0.080%(+0.369)#180 | 0.16%(+0.292)#4,384 |
| 9. | Stevensville | 0.41% | 0.080%(+0.333)#181 | 0.16%(+0.256)#4,385 |
| 10. | Damascus | 0.40% | 0.080%(+0.318)#182 | 0.16%(+0.241)#4,386 |
| 11. | Naval Academy | 0.40% | 0.080%(+0.317)#183 | 0.16%(+0.240)#4,387 |
| 12. | Aspen Hill | 0.39% | 0.080%(+0.315)#184 | 0.16%(+0.238)#4,388 |
| 13. | Flower Hill | 0.38% | 0.080%(+0.303)#185 | 0.16%(+0.226)#4,389 |
| 14. | Greenbelt | 0.38% | 0.080%(+0.298)#186 | 0.16%(+0.221)#4,390 |
| 15. | Maryland City | 0.37% | 0.080%(+0.286)#187 | 0.16%(+0.208)#4,391 |
| 16. | Chevy Chase View | 0.36% | 0.080%(+0.277)#188 | 0.16%(+0.199)#4,392 |
| 17. | Rockville | 0.34% | 0.080%(+0.259)#189 | 0.16%(+0.181)#4,393 |
| 18. | Montgomery Village | 0.33% | 0.080%(+0.251)#190 | 0.16%(+0.174)#4,394 |
| 19. | Catonsville | 0.33% | 0.080%(+0.248)#191 | 0.16%(+0.171)#4,395 |
| 20. | Adelphi | 0.32% | 0.080%(+0.239)#192 | 0.16%(+0.162)#4,396 |
| 21. | Clarksburg | 0.31% | 0.080%(+0.235)#193 | 0.16%(+0.157)#4,397 |
| 22. | Somerset | 0.29% | 0.080%(+0.212)#194 | 0.16%(+0.135)#4,398 |
| 23. | Friendship Heights Village | 0.28% | 0.080%(+0.199)#195 | 0.16%(+0.121)#4,399 |
| 24. | Chillum | 0.26% | 0.080%(+0.185)#196 | 0.16%(+0.108)#4,400 |
| 25. | Arnold | 0.26% | 0.080%(+0.178)#197 | 0.16%(+0.101)#4,401 |
| 26. | Bethesda | 0.25% | 0.080%(+0.168)#198 | 0.16%(+0.091)#4,402 |
| 27. | Lake Shore | 0.23% | 0.080%(+0.148)#216 | 0.16%(+0.071)#5,647 |
| 28. | Urbana | 0.22% | 0.080%(+0.145)#217 | 0.16%(+0.068)#5,648 |
| 29. | Kensington | 0.22% | 0.080%(+0.144)#218 | 0.16%(+0.066)#5,649 |
| 30. | Parole | 0.22% | 0.080%(+0.142)#219 | 0.16%(+0.065)#5,650 |
| 31. | Ilchester | 0.22% | 0.080%(+0.140)#220 | 0.16%(+0.063)#5,651 |
| 32. | Andrews Afb | 0.19% | 0.080%(+0.114)#221 | 0.16%(+0.037)#5,652 |
| 33. | North Bethesda | 0.18% | 0.080%(+0.097)#222 | 0.16%(+0.020)#5,653 |
| 34. | Takoma Park | 0.17% | 0.080%(+0.091)#223 | 0.16%(+0.014)#5,654 |
| 35. | College Park | 0.15% | 0.080%(+0.074)#224 | 0.16%(-0.003)#5,655 |
| 36. | Hagerstown | 0.15% | 0.080%(+0.070)#225 | 0.16%(-0.007)#5,656 |
| 37. | Glassmanor | 0.15% | 0.080%(+0.070)#226 | 0.16%(-0.007)#5,657 |
| 38. | Overlea | 0.15% | 0.080%(+0.069)#227 | 0.16%(-0.008)#5,658 |
| 39. | Ocean City | 0.13% | 0.080%(+0.051)#228 | 0.16%(-0.026)#5,659 |
| 40. | Frederick | 0.13% | 0.080%(+0.051)#229 | 0.16%(-0.027)#5,660 |
| 41. | Cumberland | 0.13% | 0.080%(+0.047)#236 | 0.16%(-0.031)#6,351 |
| 42. | Fort Washington | 0.12% | 0.080%(+0.037)#237 | 0.16%(-0.041)#6,352 |
| 43. | Calverton | 0.11% | 0.080%(+0.035)#238 | 0.16%(-0.042)#6,353 |
| 44. | Cloverly | 0.11% | 0.080%(+0.030)#239 | 0.16%(-0.047)#6,354 |
| 45. | Columbia | 0.11% | 0.080%(+0.027)#240 | 0.16%(-0.050)#6,355 |
| 46. | Brooklyn Park | 0.11% | 0.080%(+0.027)#241 | 0.16%(-0.050)#6,356 |
| 47. | Chevy Chase Village | 0.11% | 0.080%(+0.027)#242 | 0.16%(-0.051)#6,357 |
| 48. | Four Corners | 0.10% | 0.080%(+0.023)#243 | 0.16%(-0.054)#6,358 |
| 49. | Woodlawn Cdp Baltimore County | 0.099% | 0.080%(+0.020)#244 | 0.16%(-0.057)#6,359 |
| 50. | Waldorf | 0.088% | 0.080%(+0.008)#245 | 0.16%(-0.069)#6,360 |
| 51. | Potomac | 0.084% | 0.080%(+0.004)#246 | 0.16%(-0.073)#6,361 |
| 52. | Eldersburg | 0.082% | 0.080%(+0.003)#247 | 0.16%(-0.074)#6,362 |
| 53. | Chevy Chase | 0.082% | 0.080%(+0.002)#248 | 0.16%(-0.075)#6,363 |
| 54. | Severn | 0.067% | 0.080%(-0.012)#249 | 0.16%(-0.089)#6,364 |
| 55. | South Laurel | 0.067% | 0.080%(-0.013)#250 | 0.16%(-0.090)#6,365 |
| 56. | Ellicott City | 0.061% | 0.080%(-0.018)#251 | 0.16%(-0.096)#6,366 |
| 57. | Easton | 0.058% | 0.080%(-0.021)#252 | 0.16%(-0.098)#6,367 |
| 58. | Suitland | 0.058% | 0.080%(-0.021)#253 | 0.16%(-0.099)#6,368 |
| 59. | Towson | 0.057% | 0.080%(-0.022)#254 | 0.16%(-0.100)#6,369 |
| 60. | Germantown | 0.052% | 0.080%(-0.027)#255 | 0.16%(-0.105)#6,370 |
| 61. | Olney | 0.045% | 0.080%(-0.034)#256 | 0.16%(-0.112)#6,371 |
| 62. | Riverdale Park | 0.041% | 0.080%(-0.038)#257 | 0.16%(-0.116)#6,372 |
| 63. | Laurel | 0.041% | 0.080%(-0.039)#258 | 0.16%(-0.116)#6,373 |
| 64. | Lexington Park | 0.037% | 0.080%(-0.043)#259 | 0.16%(-0.120)#6,374 |
| 65. | Essex | 0.032% | 0.080%(-0.048)#260 | 0.16%(-0.125)#6,375 |
| 66. | Dundalk | 0.026% | 0.080%(-0.054)#261 | 0.16%(-0.131)#6,376 |
| 67. | Baltimore | 0.018% | 0.080%(-0.062)#262 | 0.16%(-0.139)#6,377 |
| 68. | Bowie | 0.014% | 0.080%(-0.066)#263 | 0.16%(-0.143)#6,378 |
| 69. | Forestville | 0.0097% | 0.080%(-0.070)#264 | 0.16%(-0.147)#8,003 |
| 70. | Accokeek | 0.0078% | 0.080%(-0.072)#265 | 0.16%(-0.149)#8,004 |
Common Questions
What are the Top 10 Cities with the Highest Percentage of Immigrants from Venezuela in Maryland?
Top 10 Cities with the Highest Percentage of Immigrants from Venezuela in Maryland are:
#1
4.05%
#2
1.62%
#3
1.05%
#4
0.97%
#5
0.87%
#6
0.47%
#7
0.46%
#8
0.45%
#9
0.41%
#10
0.40%
What city has the Highest Percentage of Immigrants from Venezuela in Maryland?
Mount Aetna has the Highest Percentage of Immigrants from Venezuela in Maryland with 4.05%.
What is the Percentage of Immigrants from Venezuela in the State of Maryland?
Percentage of Immigrants from Venezuela in Maryland is 0.080%.
What is the Percentage of Immigrants from Venezuela in the United States?
Percentage of Immigrants from Venezuela in the United States is 0.16%.