Cities with the Most Immigrants from Nepal in Maryland
RELATED REPORTS & OPTIONS
Nepal
Maryland
Compare Cities
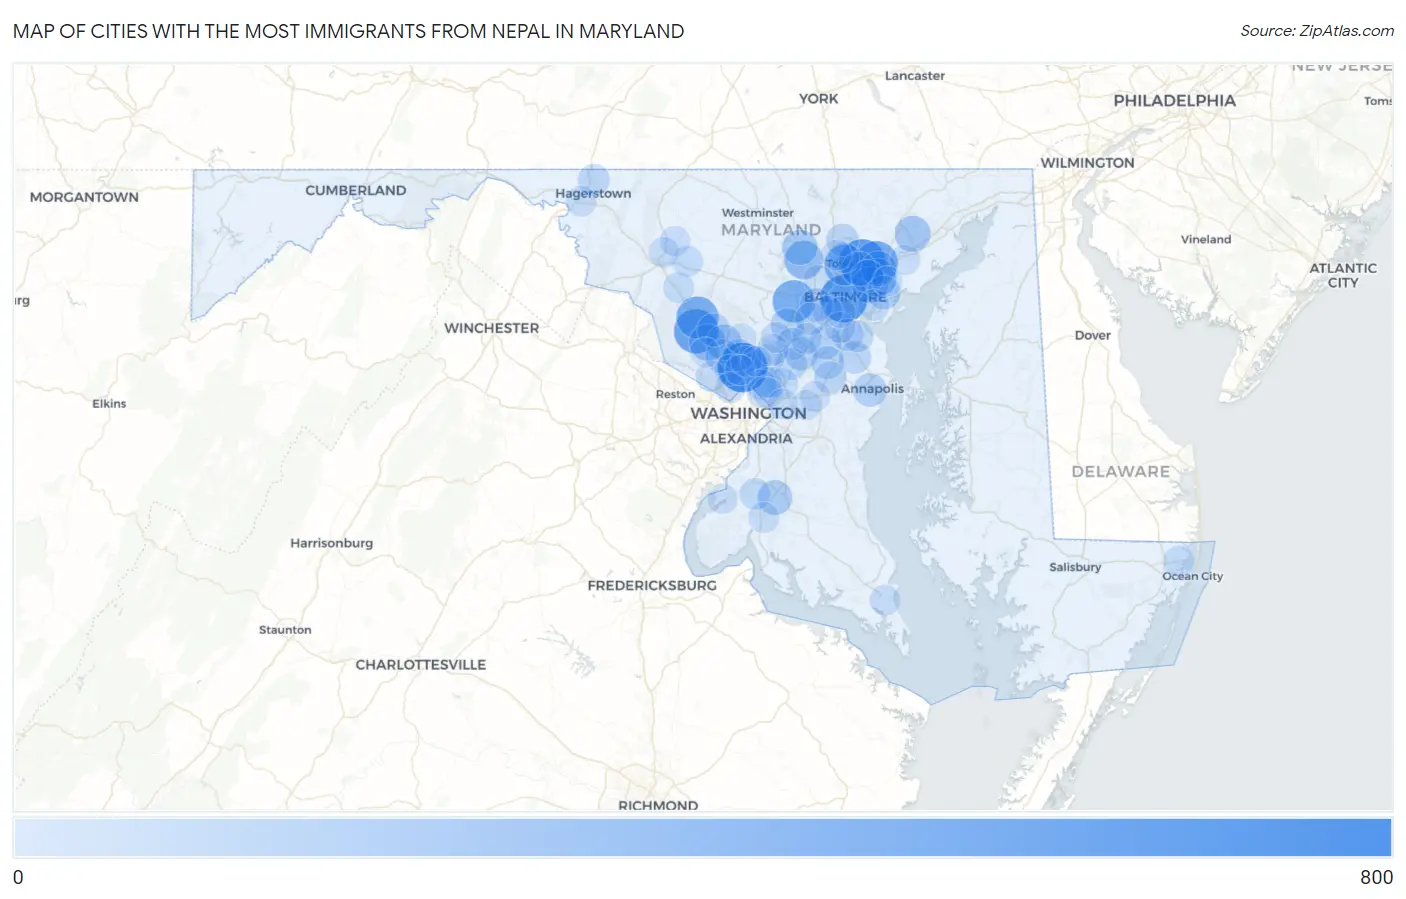
Map of Cities with the Most Immigrants from Nepal in Maryland
0
800
Cities with the Most Immigrants from Nepal in Maryland
| City | Nepal | vs State | vs National | |
| 1. | Wheaton | 752 | 10,205(7.37%)#1 | 165,080(0.46%)#20 |
| 2. | Baltimore | 665 | 10,205(6.52%)#2 | 165,080(0.40%)#25 |
| 3. | Carney | 636 | 10,205(6.23%)#3 | 165,080(0.39%)#28 |
| 4. | Germantown | 551 | 10,205(5.40%)#4 | 165,080(0.33%)#37 |
| 5. | Perry Hall | 488 | 10,205(4.78%)#5 | 165,080(0.30%)#47 |
| 6. | Ellicott City | 466 | 10,205(4.57%)#6 | 165,080(0.28%)#52 |
| 7. | Clarksburg | 461 | 10,205(4.52%)#7 | 165,080(0.28%)#54 |
| 8. | Towson | 423 | 10,205(4.15%)#8 | 165,080(0.26%)#63 |
| 9. | Woodlawn Cdp Baltimore County | 389 | 10,205(3.81%)#9 | 165,080(0.24%)#72 |
| 10. | Owings Mills | 324 | 10,205(3.17%)#10 | 165,080(0.20%)#88 |
| 11. | Rossville | 305 | 10,205(2.99%)#11 | 165,080(0.18%)#95 |
| 12. | Gaithersburg | 245 | 10,205(2.40%)#12 | 165,080(0.15%)#125 |
| 13. | Rosedale | 230 | 10,205(2.25%)#13 | 165,080(0.14%)#141 |
| 14. | Bel Air South | 223 | 10,205(2.19%)#14 | 165,080(0.14%)#146 |
| 15. | Redland | 201 | 10,205(1.97%)#15 | 165,080(0.12%)#165 |
| 16. | Reisterstown | 189 | 10,205(1.85%)#16 | 165,080(0.11%)#183 |
| 17. | White Marsh | 189 | 10,205(1.85%)#17 | 165,080(0.11%)#184 |
| 18. | Waldorf | 173 | 10,205(1.70%)#18 | 165,080(0.10%)#196 |
| 19. | Parkville | 152 | 10,205(1.49%)#19 | 165,080(0.09%)#228 |
| 20. | Rockville | 144 | 10,205(1.41%)#20 | 165,080(0.09%)#240 |
| 21. | Columbia | 135 | 10,205(1.32%)#21 | 165,080(0.08%)#250 |
| 22. | Essex | 135 | 10,205(1.32%)#22 | 165,080(0.08%)#251 |
| 23. | Severn | 133 | 10,205(1.30%)#23 | 165,080(0.08%)#255 |
| 24. | Annapolis | 131 | 10,205(1.28%)#24 | 165,080(0.08%)#259 |
| 25. | Maryland City | 118 | 10,205(1.16%)#25 | 165,080(0.07%)#278 |
| 26. | Montgomery Village | 117 | 10,205(1.15%)#26 | 165,080(0.07%)#280 |
| 27. | Catonsville | 108 | 10,205(1.06%)#27 | 165,080(0.07%)#306 |
| 28. | Odenton | 104 | 10,205(1.02%)#28 | 165,080(0.06%)#315 |
| 29. | Overlea | 98 | 10,205(0.96%)#29 | 165,080(0.06%)#331 |
| 30. | Cockeysville | 88 | 10,205(0.86%)#30 | 165,080(0.05%)#367 |
| 31. | Severna Park | 83 | 10,205(0.81%)#31 | 165,080(0.05%)#383 |
| 32. | Ilchester | 82 | 10,205(0.80%)#32 | 165,080(0.05%)#391 |
| 33. | Crofton | 74 | 10,205(0.73%)#33 | 165,080(0.04%)#424 |
| 34. | Glen Burnie | 72 | 10,205(0.71%)#34 | 165,080(0.04%)#436 |
| 35. | Aspen Hill | 70 | 10,205(0.69%)#35 | 165,080(0.04%)#447 |
| 36. | North Laurel | 70 | 10,205(0.69%)#36 | 165,080(0.04%)#448 |
| 37. | Fountainhead Orchard Hills | 69 | 10,205(0.68%)#37 | 165,080(0.04%)#452 |
| 38. | South Laurel | 68 | 10,205(0.67%)#38 | 165,080(0.04%)#455 |
| 39. | Fairland | 64 | 10,205(0.63%)#39 | 165,080(0.04%)#478 |
| 40. | Pasadena | 58 | 10,205(0.57%)#40 | 165,080(0.04%)#512 |
| 41. | Burtonsville | 58 | 10,205(0.57%)#41 | 165,080(0.04%)#518 |
| 42. | Bensville | 45 | 10,205(0.44%)#42 | 165,080(0.03%)#594 |
| 43. | Greenbelt | 43 | 10,205(0.42%)#43 | 165,080(0.03%)#607 |
| 44. | Dundalk | 41 | 10,205(0.40%)#44 | 165,080(0.02%)#620 |
| 45. | Chillum | 41 | 10,205(0.40%)#45 | 165,080(0.02%)#623 |
| 46. | Jessup | 41 | 10,205(0.40%)#46 | 165,080(0.02%)#628 |
| 47. | Ocean Pines | 40 | 10,205(0.39%)#47 | 165,080(0.02%)#632 |
| 48. | Ferndale | 37 | 10,205(0.36%)#48 | 165,080(0.02%)#660 |
| 49. | Linganore | 36 | 10,205(0.35%)#49 | 165,080(0.02%)#667 |
| 50. | Flower Hill | 35 | 10,205(0.34%)#50 | 165,080(0.02%)#679 |
| 51. | Urbana | 33 | 10,205(0.32%)#51 | 165,080(0.02%)#700 |
| 52. | College Park | 32 | 10,205(0.31%)#52 | 165,080(0.02%)#710 |
| 53. | Potomac | 31 | 10,205(0.30%)#53 | 165,080(0.02%)#716 |
| 54. | Fulton | 31 | 10,205(0.30%)#54 | 165,080(0.02%)#724 |
| 55. | North Bethesda | 29 | 10,205(0.28%)#55 | 165,080(0.02%)#742 |
| 56. | Bethesda | 28 | 10,205(0.27%)#56 | 165,080(0.02%)#754 |
| 57. | Halfway | 25 | 10,205(0.24%)#57 | 165,080(0.02%)#804 |
| 58. | Glenmont | 24 | 10,205(0.24%)#58 | 165,080(0.01%)#816 |
| 59. | Lutherville | 24 | 10,205(0.24%)#59 | 165,080(0.01%)#822 |
| 60. | Baltimore Highlands | 23 | 10,205(0.23%)#60 | 165,080(0.01%)#838 |
| 61. | Mays Chapel | 22 | 10,205(0.22%)#61 | 165,080(0.01%)#855 |
| 62. | Frederick | 21 | 10,205(0.21%)#62 | 165,080(0.01%)#859 |
| 63. | Langley Park | 21 | 10,205(0.21%)#63 | 165,080(0.01%)#861 |
| 64. | Lexington Park | 21 | 10,205(0.21%)#64 | 165,080(0.01%)#862 |
| 65. | La Plata | 21 | 10,205(0.21%)#65 | 165,080(0.01%)#863 |
| 66. | Arbutus | 18 | 10,205(0.18%)#66 | 165,080(0.01%)#910 |
| 67. | Adelphi | 18 | 10,205(0.18%)#67 | 165,080(0.01%)#914 |
| 68. | Olney | 17 | 10,205(0.17%)#68 | 165,080(0.01%)#928 |
| 69. | Walkersville | 16 | 10,205(0.16%)#69 | 165,080(0.01%)#956 |
| 70. | Hyattsville | 14 | 10,205(0.14%)#70 | 165,080(0.01%)#986 |
| 71. | Colesville | 12 | 10,205(0.12%)#71 | 165,080(0.01%)#1,032 |
| 72. | Honeygo | 12 | 10,205(0.12%)#72 | 165,080(0.01%)#1,033 |
| 73. | Joppatowne | 10 | 10,205(0.10%)#73 | 165,080(0.01%)#1,080 |
| 74. | Bowie | 9 | 10,205(0.09%)#74 | 165,080(0.01%)#1,093 |
| 75. | Indian Head | 8 | 10,205(0.08%)#75 | 165,080(0.00%)#1,125 |
| 76. | North Kensington | 7 | 10,205(0.07%)#76 | 165,080(0.00%)#1,151 |
| 77. | Woodmore | 7 | 10,205(0.07%)#77 | 165,080(0.00%)#1,153 |
| 78. | North Potomac | 6 | 10,205(0.06%)#78 | 165,080(0.00%)#1,167 |
| 79. | Landover | 5 | 10,205(0.05%)#79 | 165,080(0.00%)#1,184 |
| 80. | Middle River | 3 | 10,205(0.03%)#80 | 165,080(0.00%)#1,224 |
| 81. | Lochearn | 2 | 10,205(0.02%)#81 | 165,080(0.00%)#1,242 |
Common Questions
What are the Top 10 Cities with the Most Immigrants from Nepal in Maryland?
Top 10 Cities with the Most Immigrants from Nepal in Maryland are:
#1
752
#2
665
#3
636
#4
551
#5
488
#6
466
#7
461
#8
423
#9
324
#10
305
What city has the Most Immigrants from Nepal in Maryland?
Wheaton has the Most Immigrants from Nepal in Maryland with 752.
What is the Total Immigrants from Nepal in the State of Maryland?
Total Immigrants from Nepal in Maryland is 10,205.
What is the Total Immigrants from Nepal in the United States?
Total Immigrants from Nepal in the United States is 165,080.