Cities with the Most Immigrants from Ghana in Maryland
RELATED REPORTS & OPTIONS
Ghana
Maryland
Compare Cities
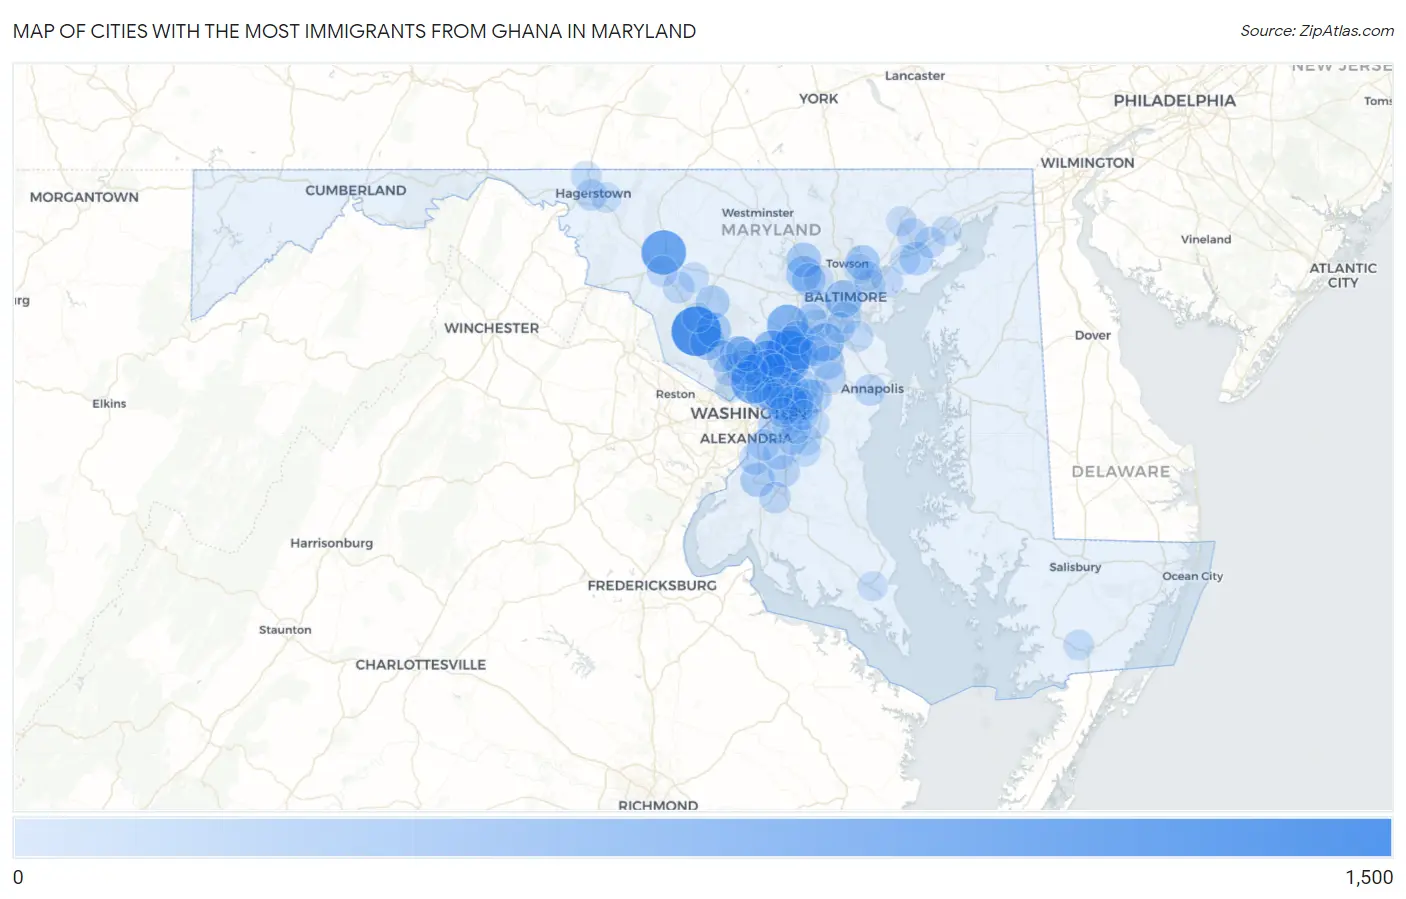
Map of Cities with the Most Immigrants from Ghana in Maryland
0
1,500
Cities with the Most Immigrants from Ghana in Maryland
| City | Ghana | vs State | vs National | |
| 1. | Germantown | 1,030 | 17,774(5.79%)#1 | 201,796(0.51%)#17 |
| 2. | Laurel | 841 | 17,774(4.73%)#2 | 201,796(0.42%)#21 |
| 3. | Frederick | 768 | 17,774(4.32%)#3 | 201,796(0.38%)#25 |
| 4. | Silver Spring | 667 | 17,774(3.75%)#4 | 201,796(0.33%)#31 |
| 5. | Columbia | 566 | 17,774(3.18%)#5 | 201,796(0.28%)#37 |
| 6. | Burtonsville | 499 | 17,774(2.81%)#6 | 201,796(0.25%)#47 |
| 7. | Fairland | 481 | 17,774(2.71%)#7 | 201,796(0.24%)#55 |
| 8. | Severn | 443 | 17,774(2.49%)#8 | 201,796(0.22%)#59 |
| 9. | Aspen Hill | 416 | 17,774(2.34%)#9 | 201,796(0.21%)#63 |
| 10. | Baltimore | 392 | 17,774(2.21%)#10 | 201,796(0.19%)#66 |
| 11. | North Laurel | 313 | 17,774(1.76%)#11 | 201,796(0.16%)#79 |
| 12. | South Laurel | 312 | 17,774(1.76%)#12 | 201,796(0.15%)#80 |
| 13. | New Carrollton | 309 | 17,774(1.74%)#13 | 201,796(0.15%)#82 |
| 14. | White Oak | 302 | 17,774(1.70%)#14 | 201,796(0.15%)#84 |
| 15. | Randallstown | 291 | 17,774(1.64%)#15 | 201,796(0.14%)#88 |
| 16. | Gaithersburg | 272 | 17,774(1.53%)#16 | 201,796(0.13%)#95 |
| 17. | Owings Mills | 258 | 17,774(1.45%)#17 | 201,796(0.13%)#101 |
| 18. | Montgomery Village | 256 | 17,774(1.44%)#18 | 201,796(0.13%)#103 |
| 19. | Carney | 249 | 17,774(1.40%)#19 | 201,796(0.12%)#105 |
| 20. | Greenbelt | 246 | 17,774(1.38%)#20 | 201,796(0.12%)#107 |
| 21. | Maryland City | 239 | 17,774(1.34%)#21 | 201,796(0.12%)#114 |
| 22. | Chillum | 238 | 17,774(1.34%)#22 | 201,796(0.12%)#115 |
| 23. | Wheaton | 237 | 17,774(1.33%)#23 | 201,796(0.12%)#116 |
| 24. | Suitland | 229 | 17,774(1.29%)#24 | 201,796(0.11%)#123 |
| 25. | Damascus | 227 | 17,774(1.28%)#25 | 201,796(0.11%)#126 |
| 26. | Accokeek | 227 | 17,774(1.28%)#26 | 201,796(0.11%)#127 |
| 27. | Odenton | 214 | 17,774(1.20%)#27 | 201,796(0.11%)#143 |
| 28. | Milford Mill | 209 | 17,774(1.18%)#28 | 201,796(0.10%)#144 |
| 29. | Landover | 188 | 17,774(1.06%)#29 | 201,796(0.09%)#162 |
| 30. | Glenn Dale | 187 | 17,774(1.05%)#30 | 201,796(0.09%)#164 |
| 31. | Edgewood | 185 | 17,774(1.04%)#31 | 201,796(0.09%)#165 |
| 32. | Bowie | 183 | 17,774(1.03%)#32 | 201,796(0.09%)#167 |
| 33. | Savage | 182 | 17,774(1.02%)#33 | 201,796(0.09%)#170 |
| 34. | Lake Arbor | 177 | 17,774(1.00%)#34 | 201,796(0.09%)#173 |
| 35. | Seabrook | 176 | 17,774(0.99%)#35 | 201,796(0.09%)#176 |
| 36. | Calverton | 154 | 17,774(0.87%)#36 | 201,796(0.08%)#204 |
| 37. | Honeygo | 153 | 17,774(0.86%)#37 | 201,796(0.08%)#205 |
| 38. | North Bethesda | 144 | 17,774(0.81%)#38 | 201,796(0.07%)#217 |
| 39. | Fort Washington | 137 | 17,774(0.77%)#39 | 201,796(0.07%)#229 |
| 40. | Beltsville | 135 | 17,774(0.76%)#40 | 201,796(0.07%)#235 |
| 41. | Brandywine | 130 | 17,774(0.73%)#41 | 201,796(0.06%)#246 |
| 42. | Hyattsville | 126 | 17,774(0.71%)#42 | 201,796(0.06%)#257 |
| 43. | Largo | 124 | 17,774(0.70%)#43 | 201,796(0.06%)#262 |
| 44. | Clinton | 122 | 17,774(0.69%)#44 | 201,796(0.06%)#266 |
| 45. | Rockville | 120 | 17,774(0.68%)#45 | 201,796(0.06%)#270 |
| 46. | Brooklyn Park | 116 | 17,774(0.65%)#46 | 201,796(0.06%)#275 |
| 47. | Urbana | 108 | 17,774(0.61%)#47 | 201,796(0.05%)#295 |
| 48. | Crofton | 106 | 17,774(0.60%)#48 | 201,796(0.05%)#301 |
| 49. | Bel Air South | 104 | 17,774(0.59%)#49 | 201,796(0.05%)#304 |
| 50. | Waldorf | 101 | 17,774(0.57%)#50 | 201,796(0.05%)#314 |
| 51. | Hagerstown | 99 | 17,774(0.56%)#51 | 201,796(0.05%)#322 |
| 52. | Annapolis | 99 | 17,774(0.56%)#52 | 201,796(0.05%)#323 |
| 53. | Leisure World | 95 | 17,774(0.53%)#53 | 201,796(0.05%)#333 |
| 54. | Oxon Hill | 93 | 17,774(0.52%)#54 | 201,796(0.05%)#342 |
| 55. | Ballenger Creek | 91 | 17,774(0.51%)#55 | 201,796(0.05%)#348 |
| 56. | Summerfield | 88 | 17,774(0.50%)#56 | 201,796(0.04%)#359 |
| 57. | Middle River | 85 | 17,774(0.48%)#57 | 201,796(0.04%)#369 |
| 58. | Riverside | 83 | 17,774(0.47%)#58 | 201,796(0.04%)#379 |
| 59. | Bladensburg | 78 | 17,774(0.44%)#59 | 201,796(0.04%)#401 |
| 60. | Pasadena | 76 | 17,774(0.43%)#60 | 201,796(0.04%)#407 |
| 61. | Woodlawn Cdp Baltimore County | 75 | 17,774(0.42%)#61 | 201,796(0.04%)#410 |
| 62. | Elkridge | 73 | 17,774(0.41%)#62 | 201,796(0.04%)#416 |
| 63. | Brock Hall | 71 | 17,774(0.40%)#63 | 201,796(0.04%)#426 |
| 64. | Takoma Park | 68 | 17,774(0.38%)#64 | 201,796(0.03%)#451 |
| 65. | Queensland | 67 | 17,774(0.38%)#65 | 201,796(0.03%)#458 |
| 66. | Kemp Mill | 66 | 17,774(0.37%)#66 | 201,796(0.03%)#468 |
| 67. | Marlton | 61 | 17,774(0.34%)#67 | 201,796(0.03%)#502 |
| 68. | Melwood | 60 | 17,774(0.34%)#68 | 201,796(0.03%)#507 |
| 69. | Robinwood | 59 | 17,774(0.33%)#69 | 201,796(0.03%)#513 |
| 70. | Rosedale | 58 | 17,774(0.33%)#70 | 201,796(0.03%)#516 |
| 71. | Woodmore | 57 | 17,774(0.32%)#71 | 201,796(0.03%)#525 |
| 72. | Catonsville | 56 | 17,774(0.32%)#72 | 201,796(0.03%)#530 |
| 73. | Ferndale | 55 | 17,774(0.31%)#73 | 201,796(0.03%)#541 |
| 74. | Maugansville | 53 | 17,774(0.30%)#74 | 201,796(0.03%)#556 |
| 75. | Abingdon | 52 | 17,774(0.29%)#75 | 201,796(0.03%)#558 |
| 76. | Monrovia | 49 | 17,774(0.28%)#76 | 201,796(0.02%)#581 |
| 77. | West Pocomoke | 49 | 17,774(0.28%)#77 | 201,796(0.02%)#582 |
| 78. | Bethesda | 46 | 17,774(0.26%)#78 | 201,796(0.02%)#596 |
| 79. | Fairwood | 45 | 17,774(0.25%)#79 | 201,796(0.02%)#609 |
| 80. | Springdale | 43 | 17,774(0.24%)#80 | 201,796(0.02%)#628 |
| 81. | Forestville | 40 | 17,774(0.23%)#81 | 201,796(0.02%)#663 |
| 82. | Wildewood | 40 | 17,774(0.23%)#82 | 201,796(0.02%)#664 |
| 83. | Bel Air North | 39 | 17,774(0.22%)#83 | 201,796(0.02%)#672 |
| 84. | Ilchester | 39 | 17,774(0.22%)#84 | 201,796(0.02%)#673 |
| 85. | Clarksburg | 38 | 17,774(0.21%)#85 | 201,796(0.02%)#685 |
| 86. | Forest Glen | 36 | 17,774(0.20%)#86 | 201,796(0.02%)#709 |
| 87. | Westphalia | 35 | 17,774(0.20%)#87 | 201,796(0.02%)#718 |
| 88. | Lochearn | 34 | 17,774(0.19%)#88 | 201,796(0.02%)#731 |
| 89. | California | 34 | 17,774(0.19%)#89 | 201,796(0.02%)#734 |
| 90. | Mitchellville | 34 | 17,774(0.19%)#90 | 201,796(0.02%)#735 |
| 91. | Peppermill Village | 34 | 17,774(0.19%)#91 | 201,796(0.02%)#736 |
| 92. | Parkville | 33 | 17,774(0.19%)#92 | 201,796(0.02%)#745 |
| 93. | Aberdeen | 33 | 17,774(0.19%)#93 | 201,796(0.02%)#749 |
| 94. | East Riverdale | 31 | 17,774(0.17%)#94 | 201,796(0.02%)#781 |
| 95. | Overlea | 31 | 17,774(0.17%)#95 | 201,796(0.02%)#783 |
| 96. | Burnt Mills | 31 | 17,774(0.17%)#96 | 201,796(0.02%)#784 |
| 97. | Joppatowne | 28 | 17,774(0.16%)#97 | 201,796(0.01%)#822 |
| 98. | Kettering | 27 | 17,774(0.15%)#98 | 201,796(0.01%)#831 |
| 99. | Layhill | 27 | 17,774(0.15%)#99 | 201,796(0.01%)#835 |
| 100. | Fort Meade | 25 | 17,774(0.14%)#100 | 201,796(0.01%)#861 |
Common Questions
What are the Top 10 Cities with the Most Immigrants from Ghana in Maryland?
Top 10 Cities with the Most Immigrants from Ghana in Maryland are:
#1
1,030
#2
841
#3
768
#4
667
#5
566
#6
499
#7
481
#8
443
#9
416
#10
392
What city has the Most Immigrants from Ghana in Maryland?
Germantown has the Most Immigrants from Ghana in Maryland with 1,030.
What is the Total Immigrants from Ghana in the State of Maryland?
Total Immigrants from Ghana in Maryland is 17,774.
What is the Total Immigrants from Ghana in the United States?
Total Immigrants from Ghana in the United States is 201,796.