Cities with the Most Immigrants from Western Asia in Maryland
RELATED REPORTS & OPTIONS
Western Asia
Maryland
Compare Cities
Map of Cities with the Most Immigrants from Western Asia in Maryland
0
2,500
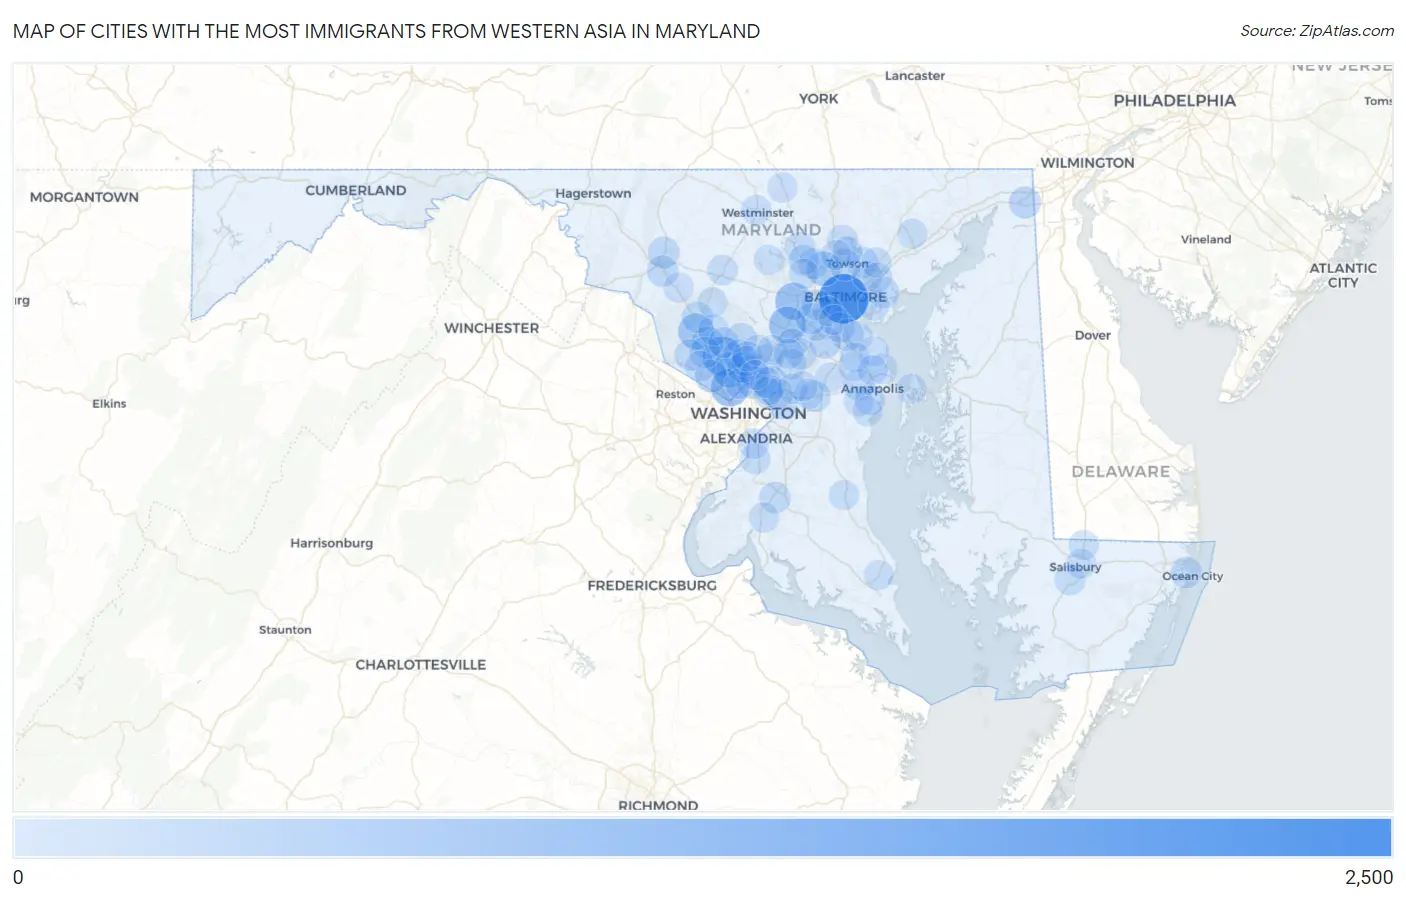
Cities with the Most Immigrants from Western Asia in Maryland
| City | Western Asia | vs State | vs National | |
| 1. | Baltimore | 2,478 | 19,614(12.63%)#1 | 1,204,112(0.21%)#47 |
| 2. | Rockville | 1,185 | 19,614(6.04%)#2 | 1,204,112(0.10%)#119 |
| 3. | Bethesda | 994 | 19,614(5.07%)#3 | 1,204,112(0.08%)#150 |
| 4. | Ellicott City | 878 | 19,614(4.48%)#4 | 1,204,112(0.07%)#174 |
| 5. | Columbia | 849 | 19,614(4.33%)#5 | 1,204,112(0.07%)#184 |
| 6. | Germantown | 725 | 19,614(3.70%)#6 | 1,204,112(0.06%)#224 |
| 7. | North Bethesda | 693 | 19,614(3.53%)#7 | 1,204,112(0.06%)#233 |
| 8. | Pikesville | 569 | 19,614(2.90%)#8 | 1,204,112(0.05%)#296 |
| 9. | College Park | 304 | 19,614(1.55%)#9 | 1,204,112(0.03%)#566 |
| 10. | Potomac | 303 | 19,614(1.54%)#10 | 1,204,112(0.03%)#569 |
| 11. | Glen Burnie | 285 | 19,614(1.45%)#11 | 1,204,112(0.02%)#607 |
| 12. | Elkton | 268 | 19,614(1.37%)#12 | 1,204,112(0.02%)#646 |
| 13. | Silver Spring | 267 | 19,614(1.36%)#13 | 1,204,112(0.02%)#649 |
| 14. | Gaithersburg | 261 | 19,614(1.33%)#14 | 1,204,112(0.02%)#667 |
| 15. | Severn | 234 | 19,614(1.19%)#15 | 1,204,112(0.02%)#740 |
| 16. | Frederick | 225 | 19,614(1.15%)#16 | 1,204,112(0.02%)#759 |
| 17. | Olney | 217 | 19,614(1.11%)#17 | 1,204,112(0.02%)#788 |
| 18. | Elkridge | 216 | 19,614(1.10%)#18 | 1,204,112(0.02%)#793 |
| 19. | Carney | 214 | 19,614(1.09%)#19 | 1,204,112(0.02%)#800 |
| 20. | Towson | 213 | 19,614(1.09%)#20 | 1,204,112(0.02%)#802 |
| 21. | Kemp Mill | 201 | 19,614(1.02%)#21 | 1,204,112(0.02%)#836 |
| 22. | Ballenger Creek | 188 | 19,614(0.96%)#22 | 1,204,112(0.02%)#879 |
| 23. | Clarksburg | 173 | 19,614(0.88%)#23 | 1,204,112(0.01%)#934 |
| 24. | Waldorf | 166 | 19,614(0.85%)#24 | 1,204,112(0.01%)#955 |
| 25. | Parole | 164 | 19,614(0.84%)#25 | 1,204,112(0.01%)#972 |
| 26. | Essex | 163 | 19,614(0.83%)#26 | 1,204,112(0.01%)#977 |
| 27. | Aspen Hill | 160 | 19,614(0.82%)#27 | 1,204,112(0.01%)#995 |
| 28. | Ilchester | 159 | 19,614(0.81%)#28 | 1,204,112(0.01%)#1,002 |
| 29. | North Potomac | 158 | 19,614(0.81%)#29 | 1,204,112(0.01%)#1,005 |
| 30. | Darnestown | 152 | 19,614(0.77%)#30 | 1,204,112(0.01%)#1,033 |
| 31. | West Ocean City | 147 | 19,614(0.75%)#31 | 1,204,112(0.01%)#1,053 |
| 32. | Bowie | 145 | 19,614(0.74%)#32 | 1,204,112(0.01%)#1,063 |
| 33. | Maryland City | 144 | 19,614(0.73%)#33 | 1,204,112(0.01%)#1,072 |
| 34. | Dundalk | 139 | 19,614(0.71%)#34 | 1,204,112(0.01%)#1,091 |
| 35. | Fort Washington | 136 | 19,614(0.69%)#35 | 1,204,112(0.01%)#1,115 |
| 36. | Fairland | 128 | 19,614(0.65%)#36 | 1,204,112(0.01%)#1,170 |
| 37. | Montgomery Village | 126 | 19,614(0.64%)#37 | 1,204,112(0.01%)#1,185 |
| 38. | Reisterstown | 120 | 19,614(0.61%)#38 | 1,204,112(0.01%)#1,236 |
| 39. | Fruitland | 118 | 19,614(0.60%)#39 | 1,204,112(0.01%)#1,245 |
| 40. | East Riverdale | 117 | 19,614(0.60%)#40 | 1,204,112(0.01%)#1,248 |
| 41. | Garrison | 116 | 19,614(0.59%)#41 | 1,204,112(0.01%)#1,256 |
| 42. | Owings Mills | 111 | 19,614(0.57%)#42 | 1,204,112(0.01%)#1,293 |
| 43. | Woodlawn Cdp Baltimore County | 107 | 19,614(0.55%)#43 | 1,204,112(0.01%)#1,333 |
| 44. | North Laurel | 100 | 19,614(0.51%)#44 | 1,204,112(0.01%)#1,377 |
| 45. | Mount Airy | 95 | 19,614(0.48%)#45 | 1,204,112(0.01%)#1,424 |
| 46. | Travilah | 94 | 19,614(0.48%)#46 | 1,204,112(0.01%)#1,434 |
| 47. | Redland | 91 | 19,614(0.46%)#47 | 1,204,112(0.01%)#1,458 |
| 48. | National Harbor | 90 | 19,614(0.46%)#48 | 1,204,112(0.01%)#1,480 |
| 49. | South Laurel | 86 | 19,614(0.44%)#49 | 1,204,112(0.01%)#1,516 |
| 50. | Wheaton | 81 | 19,614(0.41%)#50 | 1,204,112(0.01%)#1,567 |
| 51. | Cloverly | 76 | 19,614(0.39%)#51 | 1,204,112(0.01%)#1,641 |
| 52. | Honeygo | 76 | 19,614(0.39%)#52 | 1,204,112(0.01%)#1,642 |
| 53. | Landover | 73 | 19,614(0.37%)#53 | 1,204,112(0.01%)#1,674 |
| 54. | Adelphi | 73 | 19,614(0.37%)#54 | 1,204,112(0.01%)#1,677 |
| 55. | Hyattsville | 69 | 19,614(0.35%)#55 | 1,204,112(0.01%)#1,724 |
| 56. | Cockeysville | 68 | 19,614(0.35%)#56 | 1,204,112(0.01%)#1,738 |
| 57. | Flower Hill | 67 | 19,614(0.34%)#57 | 1,204,112(0.01%)#1,755 |
| 58. | Seabrook | 59 | 19,614(0.30%)#58 | 1,204,112(0.00%)#1,901 |
| 59. | Glenmont | 59 | 19,614(0.30%)#59 | 1,204,112(0.00%)#1,902 |
| 60. | Chevy Chase | 57 | 19,614(0.29%)#60 | 1,204,112(0.00%)#1,934 |
| 61. | Damascus | 55 | 19,614(0.28%)#61 | 1,204,112(0.00%)#1,961 |
| 62. | Ferndale | 54 | 19,614(0.28%)#62 | 1,204,112(0.00%)#1,981 |
| 63. | Urbana | 53 | 19,614(0.27%)#63 | 1,204,112(0.00%)#2,002 |
| 64. | Huntingtown | 52 | 19,614(0.27%)#64 | 1,204,112(0.00%)#2,031 |
| 65. | Layhill | 51 | 19,614(0.26%)#65 | 1,204,112(0.00%)#2,048 |
| 66. | Mays Chapel | 49 | 19,614(0.25%)#66 | 1,204,112(0.00%)#2,082 |
| 67. | Catonsville | 47 | 19,614(0.24%)#67 | 1,204,112(0.00%)#2,113 |
| 68. | Overlea | 46 | 19,614(0.23%)#68 | 1,204,112(0.00%)#2,153 |
| 69. | Burtonsville | 43 | 19,614(0.22%)#69 | 1,204,112(0.00%)#2,222 |
| 70. | Timonium | 42 | 19,614(0.21%)#70 | 1,204,112(0.00%)#2,240 |
| 71. | Fairwood | 36 | 19,614(0.18%)#71 | 1,204,112(0.00%)#2,405 |
| 72. | Delmar | 36 | 19,614(0.18%)#72 | 1,204,112(0.00%)#2,410 |
| 73. | Bel Air South | 35 | 19,614(0.18%)#73 | 1,204,112(0.00%)#2,413 |
| 74. | Salisbury | 34 | 19,614(0.17%)#74 | 1,204,112(0.00%)#2,442 |
| 75. | Westminster | 34 | 19,614(0.17%)#75 | 1,204,112(0.00%)#2,447 |
| 76. | Perry Hall | 31 | 19,614(0.16%)#76 | 1,204,112(0.00%)#2,550 |
| 77. | Wildewood | 31 | 19,614(0.16%)#77 | 1,204,112(0.00%)#2,565 |
| 78. | Eldersburg | 29 | 19,614(0.15%)#78 | 1,204,112(0.00%)#2,616 |
| 79. | Cape St Claire | 29 | 19,614(0.15%)#79 | 1,204,112(0.00%)#2,639 |
| 80. | Herald Harbor | 29 | 19,614(0.15%)#80 | 1,204,112(0.00%)#2,649 |
| 81. | Arbutus | 28 | 19,614(0.14%)#81 | 1,204,112(0.00%)#2,670 |
| 82. | Annapolis Neck | 28 | 19,614(0.14%)#82 | 1,204,112(0.00%)#2,679 |
| 83. | Linthicum | 28 | 19,614(0.14%)#83 | 1,204,112(0.00%)#2,683 |
| 84. | La Plata | 28 | 19,614(0.14%)#84 | 1,204,112(0.00%)#2,685 |
| 85. | University Park | 27 | 19,614(0.14%)#85 | 1,204,112(0.00%)#2,746 |
| 86. | Solomons | 27 | 19,614(0.14%)#86 | 1,204,112(0.00%)#2,747 |
| 87. | Randallstown | 26 | 19,614(0.13%)#87 | 1,204,112(0.00%)#2,758 |
| 88. | Pasadena | 26 | 19,614(0.13%)#88 | 1,204,112(0.00%)#2,760 |
| 89. | Laurel | 26 | 19,614(0.13%)#89 | 1,204,112(0.00%)#2,761 |
| 90. | Crofton | 26 | 19,614(0.13%)#90 | 1,204,112(0.00%)#2,762 |
| 91. | Lake Shore | 26 | 19,614(0.13%)#91 | 1,204,112(0.00%)#2,765 |
| 92. | Stevensville | 26 | 19,614(0.13%)#92 | 1,204,112(0.00%)#2,779 |
| 93. | Edgewater | 25 | 19,614(0.13%)#93 | 1,204,112(0.00%)#2,825 |
| 94. | Mayo | 25 | 19,614(0.13%)#94 | 1,204,112(0.00%)#2,827 |
| 95. | Manchester | 25 | 19,614(0.13%)#95 | 1,204,112(0.00%)#2,832 |
| 96. | Glenn Dale | 24 | 19,614(0.12%)#96 | 1,204,112(0.00%)#2,863 |
| 97. | Four Corners | 24 | 19,614(0.12%)#97 | 1,204,112(0.00%)#2,873 |
| 98. | Rossville | 23 | 19,614(0.12%)#98 | 1,204,112(0.00%)#2,916 |
| 99. | Severna Park | 21 | 19,614(0.11%)#99 | 1,204,112(0.00%)#3,015 |
| 100. | Arnold | 21 | 19,614(0.11%)#100 | 1,204,112(0.00%)#3,021 |
Common Questions
What are the Top 10 Cities with the Most Immigrants from Western Asia in Maryland?
Top 10 Cities with the Most Immigrants from Western Asia in Maryland are:
#1
2,478
#2
1,185
#3
994
#4
878
#5
849
#6
725
#7
693
#8
569
#9
304
#10
303
What city has the Most Immigrants from Western Asia in Maryland?
Baltimore has the Most Immigrants from Western Asia in Maryland with 2,478.
What is the Total Immigrants from Western Asia in the State of Maryland?
Total Immigrants from Western Asia in Maryland is 19,614.
What is the Total Immigrants from Western Asia in the United States?
Total Immigrants from Western Asia in the United States is 1,204,112.