Cities with the Highest Percentage of Egyptian Population in Maryland
RELATED REPORTS & OPTIONS
Egyptian
Maryland
Compare Cities
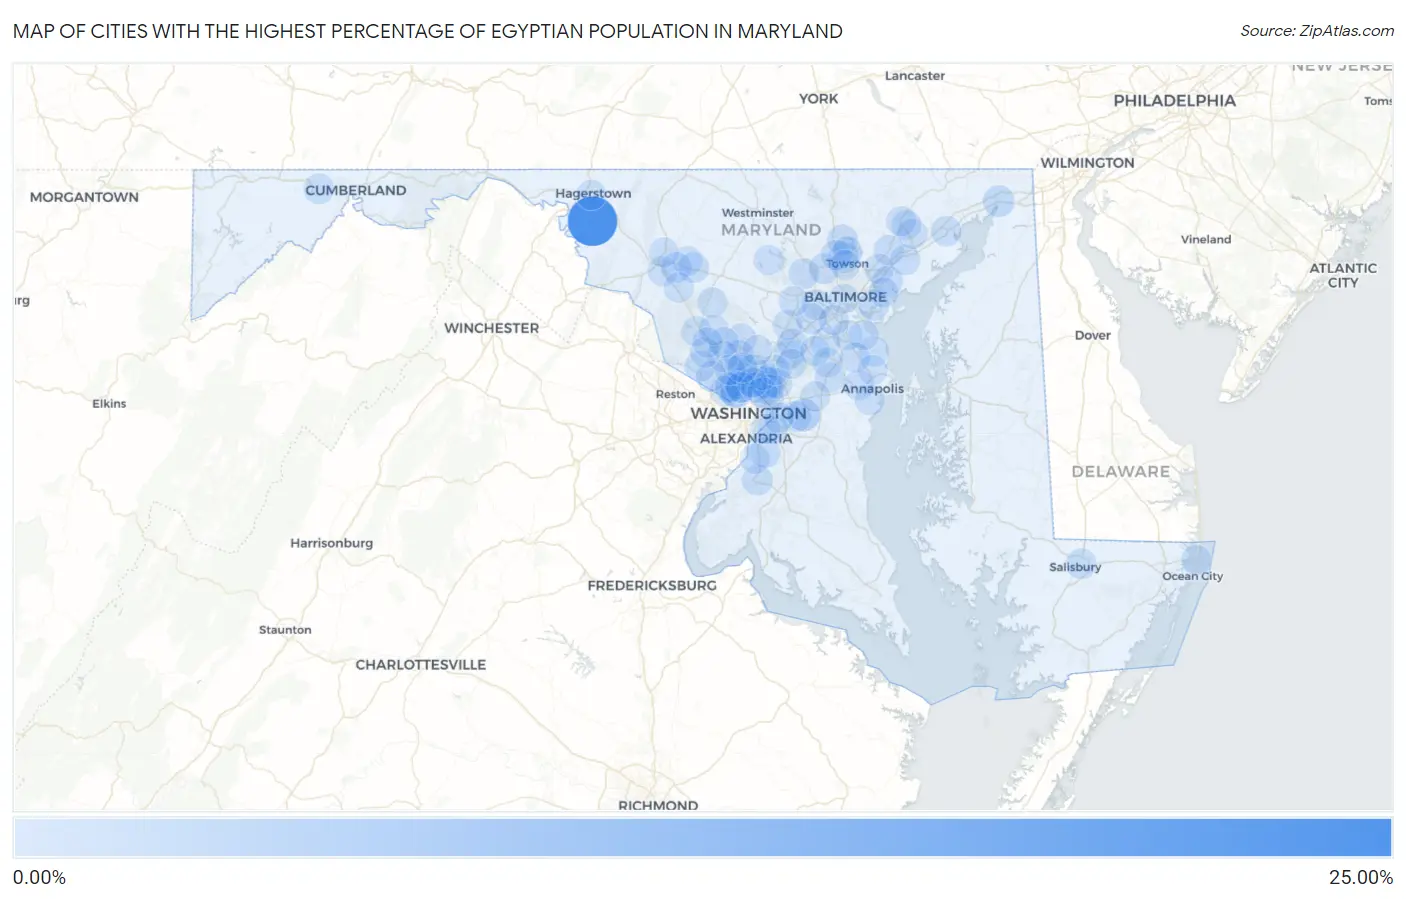
Map of Cities with the Highest Percentage of Egyptian Population in Maryland
0.00%
25.00%
Cities with the Highest Percentage of Egyptian Population in Maryland
| City | Egyptian | vs State | vs National | |
| 1. | Breathedsville | 20.38% | 0.11%(+20.3)#1 | 0.093%(+20.3)#2 |
| 2. | Kettering | 2.62% | 0.11%(+2.51)#2 | 0.093%(+2.53)#59 |
| 3. | Adelphi | 1.99% | 0.11%(+1.88)#3 | 0.093%(+1.90)#85 |
| 4. | Somerset | 1.46% | 0.11%(+1.35)#4 | 0.093%(+1.37)#140 |
| 5. | North East | 1.40% | 0.11%(+1.29)#5 | 0.093%(+1.31)#145 |
| 6. | Friendship Heights Village | 1.32% | 0.11%(+1.21)#6 | 0.093%(+1.23)#159 |
| 7. | Laurel | 0.91% | 0.11%(+0.795)#7 | 0.093%(+0.813)#260 |
| 8. | Chevy Chase | 0.79% | 0.11%(+0.675)#8 | 0.093%(+0.693)#303 |
| 9. | Middle River | 0.71% | 0.11%(+0.595)#9 | 0.093%(+0.613)#335 |
| 10. | Lutherville | 0.67% | 0.11%(+0.556)#10 | 0.093%(+0.574)#361 |
| 11. | Ilchester | 0.66% | 0.11%(+0.548)#11 | 0.093%(+0.566)#367 |
| 12. | Largo | 0.65% | 0.11%(+0.544)#12 | 0.093%(+0.561)#371 |
| 13. | Accokeek | 0.65% | 0.11%(+0.540)#13 | 0.093%(+0.558)#374 |
| 14. | Cockeysville | 0.65% | 0.11%(+0.538)#14 | 0.093%(+0.556)#375 |
| 15. | Dundalk | 0.64% | 0.11%(+0.525)#15 | 0.093%(+0.543)#387 |
| 16. | New Market | 0.59% | 0.11%(+0.476)#16 | 0.093%(+0.493)#423 |
| 17. | Chevy Chase Section Three | 0.58% | 0.11%(+0.474)#17 | 0.093%(+0.491)#424 |
| 18. | Friendly | 0.54% | 0.11%(+0.425)#18 | 0.093%(+0.442)#467 |
| 19. | Randallstown | 0.52% | 0.11%(+0.405)#19 | 0.093%(+0.423)#480 |
| 20. | Kingsville | 0.49% | 0.11%(+0.383)#20 | 0.093%(+0.401)#498 |
| 21. | Pikesville | 0.48% | 0.11%(+0.373)#21 | 0.093%(+0.390)#508 |
| 22. | College Park | 0.48% | 0.11%(+0.365)#22 | 0.093%(+0.383)#512 |
| 23. | Bartonsville | 0.46% | 0.11%(+0.352)#23 | 0.093%(+0.370)#524 |
| 24. | Travilah | 0.45% | 0.11%(+0.341)#24 | 0.093%(+0.358)#541 |
| 25. | Mays Chapel | 0.41% | 0.11%(+0.295)#25 | 0.093%(+0.313)#596 |
| 26. | Cottage City | 0.36% | 0.11%(+0.248)#26 | 0.093%(+0.265)#665 |
| 27. | Glen Echo | 0.35% | 0.11%(+0.244)#27 | 0.093%(+0.261)#676 |
| 28. | Green Valley | 0.35% | 0.11%(+0.236)#28 | 0.093%(+0.253)#693 |
| 29. | North Kensington | 0.34% | 0.11%(+0.231)#29 | 0.093%(+0.249)#703 |
| 30. | Crofton | 0.33% | 0.11%(+0.223)#30 | 0.093%(+0.240)#714 |
| 31. | Rockville | 0.33% | 0.11%(+0.218)#31 | 0.093%(+0.236)#719 |
| 32. | Joppatowne | 0.33% | 0.11%(+0.217)#32 | 0.093%(+0.235)#720 |
| 33. | Kemp Mill | 0.32% | 0.11%(+0.208)#33 | 0.093%(+0.226)#739 |
| 34. | Potomac | 0.31% | 0.11%(+0.199)#34 | 0.093%(+0.216)#754 |
| 35. | Olney | 0.30% | 0.11%(+0.193)#35 | 0.093%(+0.211)#764 |
| 36. | Aspen Hill | 0.30% | 0.11%(+0.191)#36 | 0.093%(+0.209)#768 |
| 37. | Martin S Additions | 0.30% | 0.11%(+0.191)#37 | 0.093%(+0.209)#770 |
| 38. | North Laurel | 0.26% | 0.11%(+0.151)#38 | 0.093%(+0.169)#853 |
| 39. | Parole | 0.26% | 0.11%(+0.148)#39 | 0.093%(+0.166)#868 |
| 40. | Bethesda | 0.26% | 0.11%(+0.147)#40 | 0.093%(+0.164)#874 |
| 41. | Salisbury | 0.25% | 0.11%(+0.141)#41 | 0.093%(+0.158)#885 |
| 42. | Lake Shore | 0.24% | 0.11%(+0.133)#42 | 0.093%(+0.150)#905 |
| 43. | Aberdeen | 0.24% | 0.11%(+0.132)#43 | 0.093%(+0.150)#906 |
| 44. | Glen Burnie | 0.24% | 0.11%(+0.131)#44 | 0.093%(+0.149)#914 |
| 45. | North Bethesda | 0.23% | 0.11%(+0.114)#45 | 0.093%(+0.132)#954 |
| 46. | Frostburg | 0.22% | 0.11%(+0.114)#46 | 0.093%(+0.131)#955 |
| 47. | Redland | 0.21% | 0.11%(+0.096)#47 | 0.093%(+0.114)#1,006 |
| 48. | Silver Hill | 0.20% | 0.11%(+0.091)#48 | 0.093%(+0.108)#1,023 |
| 49. | Catonsville | 0.19% | 0.11%(+0.083)#49 | 0.093%(+0.101)#1,053 |
| 50. | Severna Park | 0.19% | 0.11%(+0.079)#50 | 0.093%(+0.097)#1,069 |
| 51. | Damascus | 0.18% | 0.11%(+0.067)#51 | 0.093%(+0.085)#1,102 |
| 52. | Arnold | 0.18% | 0.11%(+0.066)#52 | 0.093%(+0.084)#1,108 |
| 53. | North Potomac | 0.17% | 0.11%(+0.059)#53 | 0.093%(+0.077)#1,133 |
| 54. | University Park | 0.15% | 0.11%(+0.042)#54 | 0.093%(+0.060)#1,187 |
| 55. | Severn | 0.15% | 0.11%(+0.041)#55 | 0.093%(+0.059)#1,195 |
| 56. | Annapolis Neck | 0.15% | 0.11%(+0.038)#56 | 0.093%(+0.056)#1,201 |
| 57. | Capitol Heights | 0.15% | 0.11%(+0.038)#57 | 0.093%(+0.055)#1,206 |
| 58. | Takoma Park | 0.15% | 0.11%(+0.037)#58 | 0.093%(+0.055)#1,209 |
| 59. | Columbia | 0.14% | 0.11%(+0.031)#59 | 0.093%(+0.048)#1,242 |
| 60. | Bowie | 0.13% | 0.11%(+0.017)#60 | 0.093%(+0.034)#1,318 |
| 61. | White Marsh | 0.13% | 0.11%(+0.015)#61 | 0.093%(+0.032)#1,325 |
| 62. | Odenton | 0.12% | 0.11%(+0.013)#62 | 0.093%(+0.031)#1,333 |
| 63. | Ballenger Creek | 0.12% | 0.11%(+0.012)#63 | 0.093%(+0.030)#1,338 |
| 64. | Timonium | 0.12% | 0.11%(+0.009)#64 | 0.093%(+0.027)#1,353 |
| 65. | Linganore | 0.12% | 0.11%(+0.007)#65 | 0.093%(+0.025)#1,366 |
| 66. | Bel Air South | 0.12% | 0.11%(+0.006)#66 | 0.093%(+0.024)#1,369 |
| 67. | Fort Washington | 0.12% | 0.11%(+0.005)#67 | 0.093%(+0.023)#1,380 |
| 68. | Germantown | 0.10% | 0.11%(-0.007)#68 | 0.093%(+0.011)#1,444 |
| 69. | Linthicum | 0.10% | 0.11%(-0.009)#69 | 0.093%(+0.009)#1,450 |
| 70. | Berwyn Heights | 0.091% | 0.11%(-0.021)#70 | 0.093%(-0.003)#1,530 |
| 71. | Ellicott City | 0.084% | 0.11%(-0.027)#71 | 0.093%(-0.009)#1,567 |
| 72. | Hillandale | 0.080% | 0.11%(-0.031)#72 | 0.093%(-0.013)#1,597 |
| 73. | Beltsville | 0.071% | 0.11%(-0.040)#73 | 0.093%(-0.022)#1,664 |
| 74. | South Laurel | 0.063% | 0.11%(-0.048)#74 | 0.093%(-0.030)#1,725 |
| 75. | Fort Meade | 0.060% | 0.11%(-0.051)#75 | 0.093%(-0.033)#1,751 |
| 76. | Urbana | 0.060% | 0.11%(-0.051)#76 | 0.093%(-0.034)#1,753 |
| 77. | Baltimore | 0.056% | 0.11%(-0.055)#77 | 0.093%(-0.037)#1,768 |
| 78. | Chillum | 0.056% | 0.11%(-0.055)#78 | 0.093%(-0.038)#1,777 |
| 79. | Frederick | 0.055% | 0.11%(-0.056)#79 | 0.093%(-0.039)#1,784 |
| 80. | Silver Spring | 0.050% | 0.11%(-0.061)#80 | 0.093%(-0.043)#1,833 |
| 81. | Riviera Beach | 0.049% | 0.11%(-0.062)#81 | 0.093%(-0.044)#1,837 |
| 82. | Bel Air | 0.047% | 0.11%(-0.064)#82 | 0.093%(-0.046)#1,851 |
| 83. | Bel Air North | 0.045% | 0.11%(-0.066)#83 | 0.093%(-0.049)#1,871 |
| 84. | Montgomery Village | 0.040% | 0.11%(-0.071)#84 | 0.093%(-0.053)#1,921 |
| 85. | Towson | 0.040% | 0.11%(-0.071)#85 | 0.093%(-0.054)#1,924 |
| 86. | Hillcrest Heights | 0.036% | 0.11%(-0.075)#86 | 0.093%(-0.057)#1,965 |
| 87. | Woodlawn Cdp Baltimore County | 0.036% | 0.11%(-0.076)#87 | 0.093%(-0.058)#1,970 |
| 88. | Gaithersburg | 0.033% | 0.11%(-0.078)#88 | 0.093%(-0.060)#2,000 |
| 89. | Eldersburg | 0.030% | 0.11%(-0.081)#89 | 0.093%(-0.064)#2,034 |
| 90. | Essex | 0.024% | 0.11%(-0.087)#90 | 0.093%(-0.069)#2,092 |
| 91. | Hagerstown | 0.018% | 0.11%(-0.093)#91 | 0.093%(-0.075)#2,155 |
| 92. | Cloverly | 0.018% | 0.11%(-0.093)#92 | 0.093%(-0.075)#2,158 |
| 93. | Ocean City | 0.015% | 0.11%(-0.097)#93 | 0.093%(-0.079)#2,206 |
| 94. | Wheaton | 0.013% | 0.11%(-0.098)#94 | 0.093%(-0.080)#2,224 |
Common Questions
What are the Top 10 Cities with the Highest Percentage of Egyptian Population in Maryland?
Top 10 Cities with the Highest Percentage of Egyptian Population in Maryland are:
#1
20.38%
#2
2.62%
#3
1.99%
#4
1.46%
#5
1.40%
#6
1.32%
#7
0.91%
#8
0.79%
#9
0.71%
#10
0.67%
What city has the Highest Percentage of Egyptian Population in Maryland?
Breathedsville has the Highest Percentage of Egyptian Population in Maryland with 20.38%.
What is the Percentage of Egyptian Population in the State of Maryland?
Percentage of Egyptian Population in Maryland is 0.11%.
What is the Percentage of Egyptian Population in the United States?
Percentage of Egyptian Population in the United States is 0.093%.