Cities with the Highest Percentage of Immigrants from Peru in Maryland
RELATED REPORTS & OPTIONS
Peru
Maryland
Compare Cities
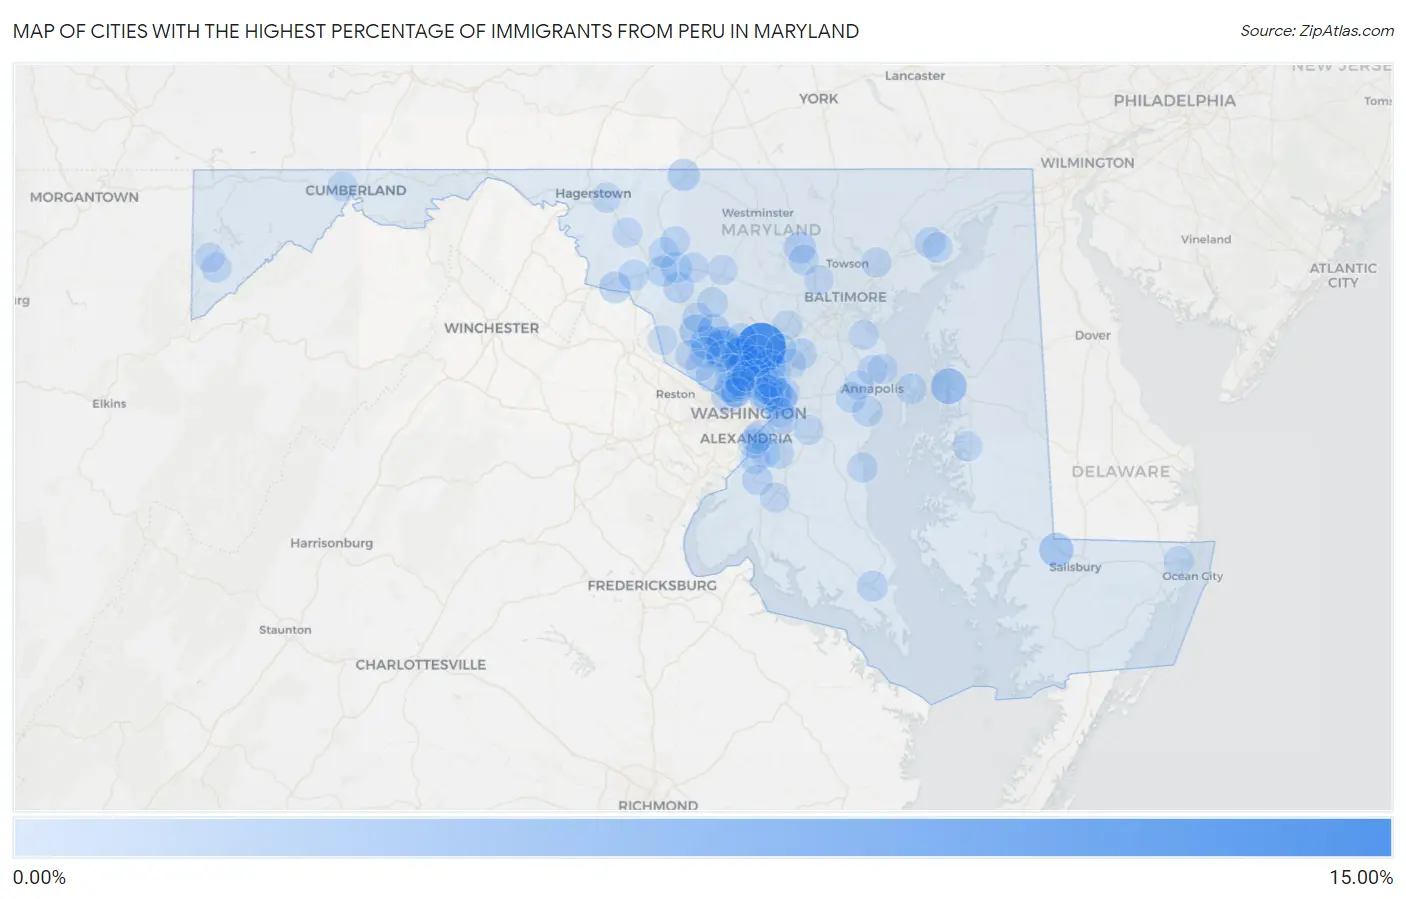
Map of Cities with the Highest Percentage of Immigrants from Peru in Maryland
0.00%
15.00%
Cities with the Highest Percentage of Immigrants from Peru in Maryland
| City | Peru | vs State | vs National | |
| 1. | Spencerville | 10.26% | 0.28%(+9.98)#-1 | 0.14%(+10.1)#0 |
| 2. | Crumpton | 6.39% | 0.28%(+6.11)#0 | 0.14%(+6.25)#1 |
| 3. | Flower Hill | 4.10% | 0.28%(+3.82)#1 | 0.14%(+3.96)#2 |
| 4. | Derwood | 3.51% | 0.28%(+3.24)#2 | 0.14%(+3.37)#3 |
| 5. | Queenstown | 2.94% | 0.28%(+2.67)#3 | 0.14%(+2.81)#4 |
| 6. | Hebron | 2.22% | 0.28%(+1.94)#4 | 0.14%(+2.08)#5 |
| 7. | Woodlawn Cdp Prince George S County | 2.21% | 0.28%(+1.93)#5 | 0.14%(+2.07)#6 |
| 8. | Landover Hills | 2.17% | 0.28%(+1.89)#6 | 0.14%(+2.03)#7 |
| 9. | Aspen Hill | 2.09% | 0.28%(+1.81)#27 | 0.14%(+1.95)#642 |
| 10. | Gaithersburg | 2.08% | 0.28%(+1.80)#60 | 0.14%(+1.94)#1,286 |
| 11. | Calverton | 1.89% | 0.28%(+1.61)#61 | 0.14%(+1.75)#1,287 |
| 12. | Germantown | 1.84% | 0.28%(+1.56)#62 | 0.14%(+1.70)#1,288 |
| 13. | Glenmont | 1.66% | 0.28%(+1.38)#63 | 0.14%(+1.52)#1,289 |
| 14. | Leisure World | 1.52% | 0.28%(+1.24)#64 | 0.14%(+1.38)#1,290 |
| 15. | Redland | 1.50% | 0.28%(+1.22)#65 | 0.14%(+1.36)#1,291 |
| 16. | Brookmont | 1.39% | 0.28%(+1.11)#66 | 0.14%(+1.25)#1,292 |
| 17. | Wheaton | 1.38% | 0.28%(+1.10)#67 | 0.14%(+1.24)#1,293 |
| 18. | North Kensington | 1.37% | 0.28%(+1.09)#68 | 0.14%(+1.23)#1,294 |
| 19. | Emmitsburg | 1.28% | 0.28%(+0.999)#69 | 0.14%(+1.14)#1,295 |
| 20. | Montgomery Village | 1.26% | 0.28%(+0.979)#70 | 0.14%(+1.12)#1,296 |
| 21. | Somerset | 1.17% | 0.28%(+0.889)#71 | 0.14%(+1.03)#1,297 |
| 22. | Reisterstown | 1.11% | 0.28%(+0.833)#72 | 0.14%(+0.972)#1,298 |
| 23. | Burnt Mills | 1.04% | 0.28%(+0.761)#73 | 0.14%(+0.900)#1,299 |
| 24. | Riverdale Park | 1.03% | 0.28%(+0.751)#74 | 0.14%(+0.890)#1,300 |
| 25. | Rockville | 1.00% | 0.28%(+0.721)#75 | 0.14%(+0.860)#1,301 |
| 26. | Brunswick | 0.99% | 0.28%(+0.711)#76 | 0.14%(+0.850)#1,302 |
| 27. | North Bethesda | 0.93% | 0.28%(+0.648)#77 | 0.14%(+0.787)#1,303 |
| 28. | Hillandale | 0.92% | 0.28%(+0.641)#78 | 0.14%(+0.780)#1,304 |
| 29. | Urbana | 0.83% | 0.28%(+0.552)#79 | 0.14%(+0.691)#1,305 |
| 30. | Walker Mill | 0.81% | 0.28%(+0.534)#80 | 0.14%(+0.673)#1,306 |
| 31. | Olney | 0.79% | 0.28%(+0.510)#81 | 0.14%(+0.649)#1,307 |
| 32. | Bartonsville | 0.76% | 0.28%(+0.480)#82 | 0.14%(+0.619)#1,308 |
| 33. | East Riverdale | 0.72% | 0.28%(+0.446)#83 | 0.14%(+0.585)#1,309 |
| 34. | Langley Park | 0.70% | 0.28%(+0.419)#84 | 0.14%(+0.559)#1,310 |
| 35. | North Potomac | 0.68% | 0.28%(+0.402)#85 | 0.14%(+0.541)#1,311 |
| 36. | Maryland City | 0.68% | 0.28%(+0.397)#86 | 0.14%(+0.537)#1,312 |
| 37. | Ballenger Creek | 0.67% | 0.28%(+0.387)#87 | 0.14%(+0.527)#1,313 |
| 38. | North Brentwood | 0.65% | 0.28%(+0.374)#88 | 0.14%(+0.513)#1,314 |
| 39. | California | 0.65% | 0.28%(+0.374)#89 | 0.14%(+0.513)#1,315 |
| 40. | Riverside | 0.64% | 0.28%(+0.363)#90 | 0.14%(+0.502)#1,316 |
| 41. | Silver Spring | 0.62% | 0.28%(+0.342)#91 | 0.14%(+0.482)#1,317 |
| 42. | Colesville | 0.62% | 0.28%(+0.342)#92 | 0.14%(+0.481)#1,318 |
| 43. | Mayo | 0.58% | 0.28%(+0.303)#93 | 0.14%(+0.442)#1,319 |
| 44. | Bethesda | 0.57% | 0.28%(+0.295)#94 | 0.14%(+0.434)#1,320 |
| 45. | Chevy Chase | 0.57% | 0.28%(+0.294)#95 | 0.14%(+0.433)#1,321 |
| 46. | Jefferson | 0.55% | 0.28%(+0.269)#96 | 0.14%(+0.408)#1,322 |
| 47. | Frederick | 0.54% | 0.28%(+0.265)#97 | 0.14%(+0.404)#1,454 |
| 48. | Stevensville | 0.51% | 0.28%(+0.228)#98 | 0.14%(+0.367)#1,455 |
| 49. | Fort Washington | 0.50% | 0.28%(+0.225)#99 | 0.14%(+0.364)#1,456 |
| 50. | Glassmanor | 0.48% | 0.28%(+0.206)#100 | 0.14%(+0.345)#1,457 |
| 51. | Beltsville | 0.47% | 0.28%(+0.193)#101 | 0.14%(+0.333)#1,458 |
| 52. | Friendly | 0.45% | 0.28%(+0.173)#102 | 0.14%(+0.312)#1,459 |
| 53. | Owings Mills | 0.45% | 0.28%(+0.167)#103 | 0.14%(+0.306)#1,460 |
| 54. | Accokeek | 0.44% | 0.28%(+0.161)#104 | 0.14%(+0.300)#1,461 |
| 55. | Riva | 0.44% | 0.28%(+0.160)#105 | 0.14%(+0.300)#1,462 |
| 56. | Potomac | 0.43% | 0.28%(+0.149)#106 | 0.14%(+0.289)#1,463 |
| 57. | Damascus | 0.43% | 0.28%(+0.149)#107 | 0.14%(+0.288)#1,464 |
| 58. | Loch Lynn Heights | 0.42% | 0.28%(+0.142)#108 | 0.14%(+0.281)#1,465 |
| 59. | Perryman | 0.42% | 0.28%(+0.138)#109 | 0.14%(+0.277)#1,466 |
| 60. | Robinwood | 0.41% | 0.28%(+0.134)#110 | 0.14%(+0.273)#1,467 |
| 61. | Clinton | 0.40% | 0.28%(+0.124)#111 | 0.14%(+0.263)#1,468 |
| 62. | National Harbor | 0.40% | 0.28%(+0.120)#112 | 0.14%(+0.259)#1,469 |
| 63. | Chevy Chase Section Five | 0.38% | 0.28%(+0.098)#113 | 0.14%(+0.238)#1,470 |
| 64. | Four Corners | 0.37% | 0.28%(+0.095)#114 | 0.14%(+0.234)#1,471 |
| 65. | Ocean Pines | 0.35% | 0.28%(+0.071)#115 | 0.14%(+0.210)#1,472 |
| 66. | Walkersville | 0.34% | 0.28%(+0.058)#116 | 0.14%(+0.197)#1,473 |
| 67. | Perry Hall | 0.32% | 0.28%(+0.046)#117 | 0.14%(+0.185)#1,474 |
| 68. | Woodlawn Cdp Baltimore County | 0.32% | 0.28%(+0.046)#118 | 0.14%(+0.185)#1,475 |
| 69. | Arnold | 0.30% | 0.28%(+0.024)#119 | 0.14%(+0.163)#1,476 |
| 70. | North Chevy Chase | 0.29% | 0.28%(+0.015)#120 | 0.14%(+0.154)#1,477 |
| 71. | Chillum | 0.29% | 0.28%(+0.008)#121 | 0.14%(+0.148)#1,478 |
| 72. | Travilah | 0.29% | 0.28%(+0.007)#122 | 0.14%(+0.146)#1,479 |
| 73. | Clarksburg | 0.28% | 0.28%(-0.003)#123 | 0.14%(+0.136)#1,480 |
| 74. | Darnestown | 0.27% | 0.28%(-0.009)#124 | 0.14%(+0.130)#1,481 |
| 75. | North Beach | 0.26% | 0.28%(-0.014)#125 | 0.14%(+0.125)#1,482 |
| 76. | Friendship Heights Village | 0.25% | 0.28%(-0.024)#126 | 0.14%(+0.116)#1,483 |
| 77. | Cape St Claire | 0.24% | 0.28%(-0.040)#127 | 0.14%(+0.099)#1,484 |
| 78. | Forest Glen | 0.23% | 0.28%(-0.045)#128 | 0.14%(+0.094)#1,485 |
| 79. | Cloverly | 0.23% | 0.28%(-0.047)#129 | 0.14%(+0.092)#1,486 |
| 80. | Riviera Beach | 0.23% | 0.28%(-0.048)#130 | 0.14%(+0.092)#1,487 |
| 81. | Forest Heights | 0.23% | 0.28%(-0.051)#131 | 0.14%(+0.088)#1,488 |
| 82. | Waldorf | 0.22% | 0.28%(-0.056)#132 | 0.14%(+0.083)#1,489 |
| 83. | Lochearn | 0.21% | 0.28%(-0.068)#133 | 0.14%(+0.071)#1,490 |
| 84. | Mount Airy | 0.21% | 0.28%(-0.072)#134 | 0.14%(+0.068)#1,491 |
| 85. | Myersville | 0.20% | 0.28%(-0.078)#135 | 0.14%(+0.061)#1,492 |
| 86. | South Laurel | 0.20% | 0.28%(-0.082)#136 | 0.14%(+0.058)#1,493 |
| 87. | New Market | 0.20% | 0.28%(-0.083)#137 | 0.14%(+0.056)#1,494 |
| 88. | Mount Rainier | 0.19% | 0.28%(-0.085)#138 | 0.14%(+0.054)#1,495 |
| 89. | University Park | 0.19% | 0.28%(-0.087)#139 | 0.14%(+0.052)#1,496 |
| 90. | New Carrollton | 0.19% | 0.28%(-0.087)#140 | 0.14%(+0.052)#1,497 |
| 91. | Columbia | 0.19% | 0.28%(-0.091)#141 | 0.14%(+0.048)#1,498 |
| 92. | Easton | 0.19% | 0.28%(-0.092)#142 | 0.14%(+0.048)#1,499 |
| 93. | West Laurel | 0.18% | 0.28%(-0.094)#143 | 0.14%(+0.045)#1,500 |
| 94. | Seat Pleasant | 0.18% | 0.28%(-0.102)#144 | 0.14%(+0.037)#1,501 |
| 95. | La Vale | 0.16% | 0.28%(-0.118)#145 | 0.14%(+0.022)#1,502 |
| 96. | Marlboro Village | 0.15% | 0.28%(-0.125)#146 | 0.14%(+0.014)#1,503 |
| 97. | College Park | 0.15% | 0.28%(-0.127)#147 | 0.14%(+0.012)#1,504 |
| 98. | Oakland | 0.15% | 0.28%(-0.128)#148 | 0.14%(+0.011)#1,505 |
| 99. | Parole | 0.15% | 0.28%(-0.133)#149 | 0.14%(+0.006)#1,506 |
| 100. | Poolesville | 0.14% | 0.28%(-0.138)#150 | 0.14%(+0.001)#1,507 |
Common Questions
What are the Top 10 Cities with the Highest Percentage of Immigrants from Peru in Maryland?
Top 10 Cities with the Highest Percentage of Immigrants from Peru in Maryland are:
#1
10.26%
#2
3.51%
#3
2.94%
#4
2.22%
#5
2.17%
#6
2.09%
#7
2.08%
#8
1.89%
#9
1.84%
#10
1.66%
What city has the Highest Percentage of Immigrants from Peru in Maryland?
Spencerville has the Highest Percentage of Immigrants from Peru in Maryland with 10.26%.
What is the Percentage of Immigrants from Peru in the State of Maryland?
Percentage of Immigrants from Peru in Maryland is 0.28%.
What is the Percentage of Immigrants from Peru in the United States?
Percentage of Immigrants from Peru in the United States is 0.14%.