Cities with the Highest Percentage of Population Employed in Business & Financial in Maryland
RELATED REPORTS & OPTIONS
Business & Financial
Maryland
Compare Cities
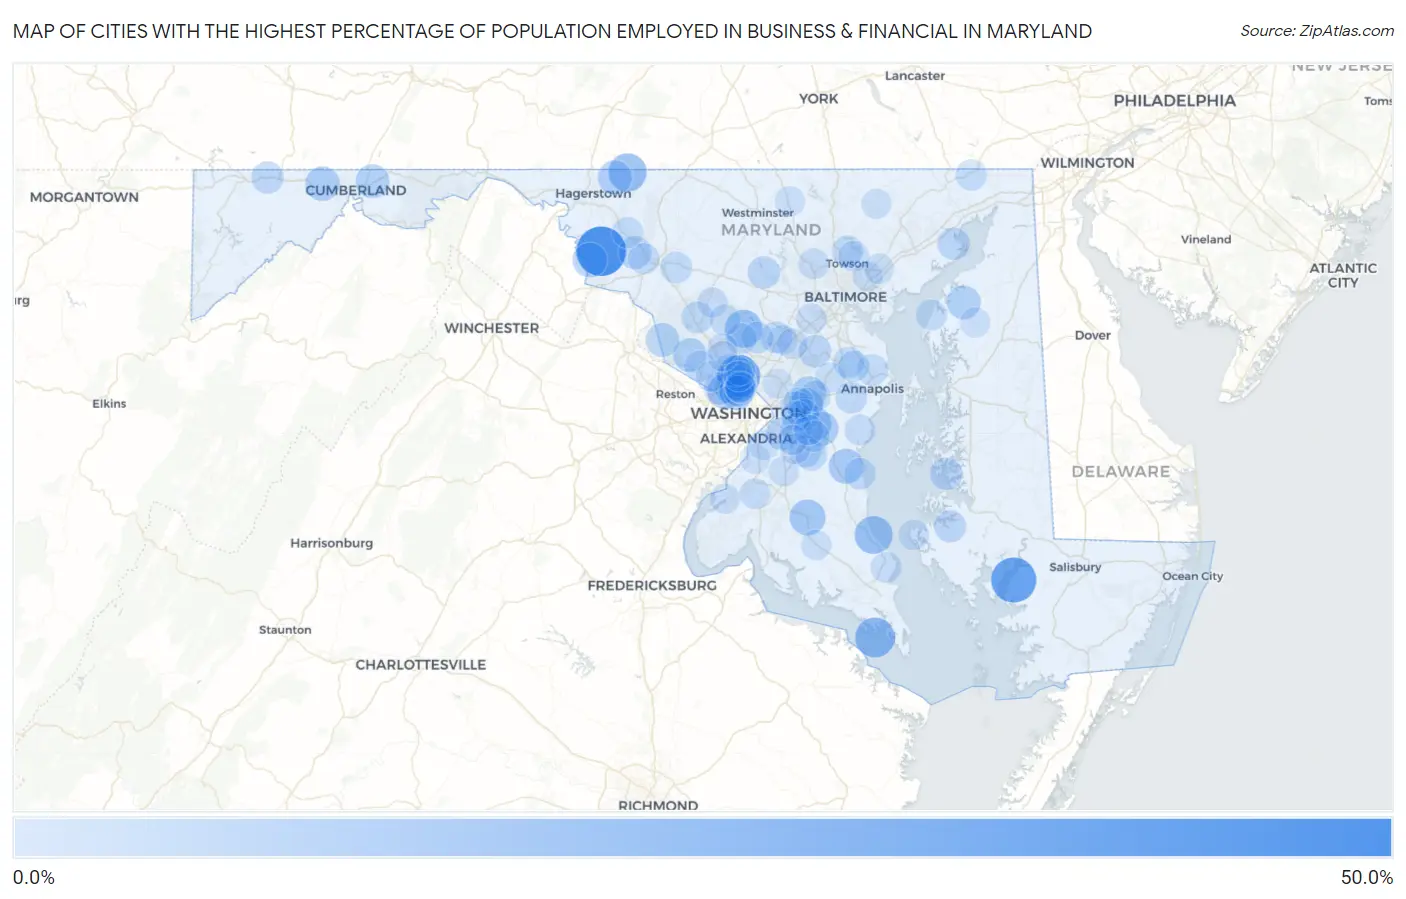
Map of Cities with the Highest Percentage of Population Employed in Business & Financial in Maryland
0.0%
50.0%
Cities with the Highest Percentage of Population Employed in Business & Financial in Maryland
| City | % Employed | vs State | vs National | |
| 1. | Mount Briar | 40.5% | 7.3%(+33.2)#1 | 5.8%(+34.8)#83 |
| 2. | Tyaskin | 33.3% | 7.3%(+26.0)#2 | 5.8%(+27.6)#134 |
| 3. | Chevy Chase View | 29.5% | 7.3%(+22.2)#3 | 5.8%(+23.8)#178 |
| 4. | St George Island | 24.7% | 7.3%(+17.4)#4 | 5.8%(+19.0)#250 |
| 5. | Ringgold | 22.0% | 7.3%(+14.6)#5 | 5.8%(+16.2)#323 |
| 6. | Calvert Beach | 21.8% | 7.3%(+14.5)#6 | 5.8%(+16.0)#326 |
| 7. | Brookeville | 21.2% | 7.3%(+13.9)#7 | 5.8%(+15.4)#345 |
| 8. | Hughesville | 18.6% | 7.3%(+11.3)#8 | 5.8%(+12.8)#464 |
| 9. | Brock Hall | 17.7% | 7.3%(+10.4)#9 | 5.8%(+11.9)#510 |
| 10. | Glen Echo | 17.5% | 7.3%(+10.2)#10 | 5.8%(+11.8)#521 |
| 11. | Owings | 17.3% | 7.3%(+10.0)#11 | 5.8%(+11.6)#536 |
| 12. | Friendship Heights Village | 17.0% | 7.3%(+9.67)#12 | 5.8%(+11.2)#565 |
| 13. | Fairwood | 16.8% | 7.3%(+9.52)#13 | 5.8%(+11.1)#577 |
| 14. | Antietam | 16.7% | 7.3%(+9.36)#14 | 5.8%(+10.9)#594 |
| 15. | Marlboro Meadows | 16.4% | 7.3%(+9.11)#15 | 5.8%(+10.7)#612 |
| 16. | Zihlman | 16.3% | 7.3%(+8.95)#16 | 5.8%(+10.5)#636 |
| 17. | Leitersburg | 15.9% | 7.3%(+8.62)#17 | 5.8%(+10.2)#671 |
| 18. | Worton | 15.5% | 7.3%(+8.16)#18 | 5.8%(+9.70)#734 |
| 19. | Pleasant Grove | 15.4% | 7.3%(+8.13)#19 | 5.8%(+9.68)#737 |
| 20. | Woodmore | 15.4% | 7.3%(+8.10)#20 | 5.8%(+9.64)#743 |
| 21. | Darnestown | 15.3% | 7.3%(+8.03)#21 | 5.8%(+9.58)#760 |
| 22. | Poolesville | 15.2% | 7.3%(+7.92)#22 | 5.8%(+9.47)#777 |
| 23. | Brown Station | 14.9% | 7.3%(+7.61)#23 | 5.8%(+9.15)#815 |
| 24. | Morningside | 14.3% | 7.3%(+6.98)#24 | 5.8%(+8.52)#904 |
| 25. | Middletown | 14.1% | 7.3%(+6.75)#25 | 5.8%(+8.29)#950 |
| 26. | Chevy Chase | 13.6% | 7.3%(+6.29)#26 | 5.8%(+7.83)#1,033 |
| 27. | Oxford | 13.3% | 7.3%(+6.02)#27 | 5.8%(+7.57)#1,103 |
| 28. | Fort Meade | 13.3% | 7.3%(+5.95)#28 | 5.8%(+7.49)#1,125 |
| 29. | Sykesville | 13.3% | 7.3%(+5.94)#29 | 5.8%(+7.49)#1,126 |
| 30. | Aberdeen Proving Ground | 13.2% | 7.3%(+5.91)#30 | 5.8%(+7.46)#1,137 |
| 31. | Grantsville | 12.8% | 7.3%(+5.46)#31 | 5.8%(+7.00)#1,266 |
| 32. | Church Creek | 12.8% | 7.3%(+5.46)#32 | 5.8%(+7.00)#1,269 |
| 33. | Lake Arbor | 12.8% | 7.3%(+5.44)#33 | 5.8%(+6.99)#1,271 |
| 34. | Bethesda | 12.7% | 7.3%(+5.36)#34 | 5.8%(+6.90)#1,284 |
| 35. | Marlton | 12.6% | 7.3%(+5.28)#35 | 5.8%(+6.82)#1,305 |
| 36. | Cabin John | 12.6% | 7.3%(+5.25)#36 | 5.8%(+6.79)#1,310 |
| 37. | Riva | 12.4% | 7.3%(+5.08)#37 | 5.8%(+6.63)#1,364 |
| 38. | Clarksburg | 12.3% | 7.3%(+4.96)#38 | 5.8%(+6.51)#1,393 |
| 39. | Kettering | 12.2% | 7.3%(+4.91)#39 | 5.8%(+6.46)#1,408 |
| 40. | Kensington | 12.1% | 7.3%(+4.83)#40 | 5.8%(+6.38)#1,438 |
| 41. | Fulton | 12.1% | 7.3%(+4.83)#41 | 5.8%(+6.38)#1,439 |
| 42. | Somerset | 12.1% | 7.3%(+4.77)#42 | 5.8%(+6.32)#1,465 |
| 43. | Bartonsville | 12.0% | 7.3%(+4.72)#43 | 5.8%(+6.27)#1,483 |
| 44. | Ashton Sandy Spring | 12.0% | 7.3%(+4.71)#44 | 5.8%(+6.26)#1,486 |
| 45. | North Chevy Chase | 11.9% | 7.3%(+4.59)#45 | 5.8%(+6.13)#1,520 |
| 46. | Chesapeake Beach | 11.9% | 7.3%(+4.57)#46 | 5.8%(+6.11)#1,532 |
| 47. | Graceham | 11.7% | 7.3%(+4.41)#47 | 5.8%(+5.96)#1,591 |
| 48. | Arnold | 11.7% | 7.3%(+4.36)#48 | 5.8%(+5.90)#1,620 |
| 49. | Arden On The Severn | 11.7% | 7.3%(+4.35)#49 | 5.8%(+5.89)#1,624 |
| 50. | Croom | 11.7% | 7.3%(+4.34)#50 | 5.8%(+5.89)#1,630 |
| 51. | Westphalia | 11.6% | 7.3%(+4.34)#51 | 5.8%(+5.88)#1,634 |
| 52. | Timonium | 11.6% | 7.3%(+4.28)#52 | 5.8%(+5.82)#1,651 |
| 53. | Upper Marlboro | 11.5% | 7.3%(+4.24)#53 | 5.8%(+5.78)#1,668 |
| 54. | Braddock Heights | 11.5% | 7.3%(+4.22)#54 | 5.8%(+5.77)#1,675 |
| 55. | Herald Harbor | 11.4% | 7.3%(+4.11)#55 | 5.8%(+5.66)#1,721 |
| 56. | North Bethesda | 11.4% | 7.3%(+4.11)#56 | 5.8%(+5.65)#1,722 |
| 57. | Rising Sun | 11.4% | 7.3%(+4.09)#57 | 5.8%(+5.63)#1,726 |
| 58. | Martin S Additions | 11.4% | 7.3%(+4.05)#58 | 5.8%(+5.59)#1,748 |
| 59. | Bowie | 11.3% | 7.3%(+4.04)#59 | 5.8%(+5.59)#1,751 |
| 60. | Travilah | 11.3% | 7.3%(+4.00)#60 | 5.8%(+5.55)#1,764 |
| 61. | Myersville | 11.2% | 7.3%(+3.94)#61 | 5.8%(+5.48)#1,790 |
| 62. | Tolchester | 11.2% | 7.3%(+3.84)#62 | 5.8%(+5.39)#1,826 |
| 63. | Garrett Park | 11.1% | 7.3%(+3.83)#63 | 5.8%(+5.38)#1,829 |
| 64. | Galesville | 11.0% | 7.3%(+3.66)#64 | 5.8%(+5.21)#1,924 |
| 65. | Garrison | 10.9% | 7.3%(+3.63)#65 | 5.8%(+5.17)#1,935 |
| 66. | Olney | 10.9% | 7.3%(+3.60)#66 | 5.8%(+5.14)#1,946 |
| 67. | North Laurel | 10.9% | 7.3%(+3.58)#67 | 5.8%(+5.13)#1,958 |
| 68. | Chevy Chase Section Five | 10.9% | 7.3%(+3.56)#68 | 5.8%(+5.10)#1,967 |
| 69. | Lusby | 10.9% | 7.3%(+3.55)#69 | 5.8%(+5.10)#1,968 |
| 70. | Bensville | 10.8% | 7.3%(+3.48)#70 | 5.8%(+5.03)#2,000 |
| 71. | Chevy Chase Village | 10.8% | 7.3%(+3.46)#71 | 5.8%(+5.00)#2,018 |
| 72. | Laytonsville | 10.7% | 7.3%(+3.43)#72 | 5.8%(+4.98)#2,026 |
| 73. | North Kensington | 10.7% | 7.3%(+3.42)#73 | 5.8%(+4.97)#2,034 |
| 74. | Potomac | 10.5% | 7.3%(+3.17)#74 | 5.8%(+4.72)#2,162 |
| 75. | Derwood | 10.5% | 7.3%(+3.15)#75 | 5.8%(+4.70)#2,171 |
| 76. | Taylors Island | 10.4% | 7.3%(+3.11)#76 | 5.8%(+4.65)#2,196 |
| 77. | Largo | 10.4% | 7.3%(+3.09)#77 | 5.8%(+4.64)#2,208 |
| 78. | Ilchester | 10.4% | 7.3%(+3.08)#78 | 5.8%(+4.63)#2,210 |
| 79. | Hampton | 10.3% | 7.3%(+3.03)#79 | 5.8%(+4.57)#2,238 |
| 80. | Rosaryville | 10.3% | 7.3%(+2.98)#80 | 5.8%(+4.52)#2,268 |
| 81. | Chevy Chase Section Three | 10.1% | 7.3%(+2.83)#81 | 5.8%(+4.37)#2,353 |
| 82. | Rockville | 10.1% | 7.3%(+2.75)#82 | 5.8%(+4.30)#2,393 |
| 83. | Overlea | 10.1% | 7.3%(+2.74)#83 | 5.8%(+4.29)#2,399 |
| 84. | Mechanicsville | 10.0% | 7.3%(+2.73)#84 | 5.8%(+4.28)#2,401 |
| 85. | Melwood | 10.0% | 7.3%(+2.73)#85 | 5.8%(+4.28)#2,404 |
| 86. | Damascus | 10.0% | 7.3%(+2.72)#86 | 5.8%(+4.27)#2,410 |
| 87. | Potomac Heights | 10.0% | 7.3%(+2.71)#87 | 5.8%(+4.26)#2,417 |
| 88. | Marlboro Village | 10.0% | 7.3%(+2.70)#88 | 5.8%(+4.24)#2,425 |
| 89. | Berwyn Heights | 10.0% | 7.3%(+2.69)#89 | 5.8%(+4.24)#2,426 |
| 90. | South Kensington | 10.0% | 7.3%(+2.68)#90 | 5.8%(+4.23)#2,449 |
| 91. | Mitchellville | 10.0% | 7.3%(+2.67)#91 | 5.8%(+4.21)#2,455 |
| 92. | Scaggsville | 10.0% | 7.3%(+2.66)#92 | 5.8%(+4.21)#2,459 |
| 93. | Brandywine | 9.9% | 7.3%(+2.62)#93 | 5.8%(+4.16)#2,489 |
| 94. | Fort Washington | 9.9% | 7.3%(+2.61)#94 | 5.8%(+4.16)#2,492 |
| 95. | Crofton | 9.8% | 7.3%(+2.51)#95 | 5.8%(+4.06)#2,558 |
| 96. | Kingstown | 9.8% | 7.3%(+2.47)#96 | 5.8%(+4.02)#2,578 |
| 97. | Hampstead | 9.8% | 7.3%(+2.46)#97 | 5.8%(+4.01)#2,583 |
| 98. | White Marsh | 9.8% | 7.3%(+2.45)#98 | 5.8%(+4.00)#2,588 |
| 99. | Oxon Hill | 9.8% | 7.3%(+2.45)#99 | 5.8%(+3.99)#2,598 |
| 100. | Jarrettsville | 9.7% | 7.3%(+2.44)#100 | 5.8%(+3.99)#2,601 |
Common Questions
What are the Top 10 Cities with the Highest Percentage of Population Employed in Business & Financial in Maryland?
Top 10 Cities with the Highest Percentage of Population Employed in Business & Financial in Maryland are:
#1
40.5%
#2
33.3%
#3
29.5%
#4
24.7%
#5
22.0%
#6
21.8%
#7
21.2%
#8
18.6%
#9
17.7%
#10
17.5%
What city has the Highest Percentage of Population Employed in Business & Financial in Maryland?
Mount Briar has the Highest Percentage of Population Employed in Business & Financial in Maryland with 40.5%.
What is the Percentage of Population Employed in Business & Financial in the State of Maryland?
Percentage of Population Employed in Business & Financial in Maryland is 7.3%.
What is the Percentage of Population Employed in Business & Financial in the United States?
Percentage of Population Employed in Business & Financial in the United States is 5.8%.