Cities with the Highest Percentage of Immigrants from England in Maryland
RELATED REPORTS & OPTIONS
England
Maryland
Compare Cities
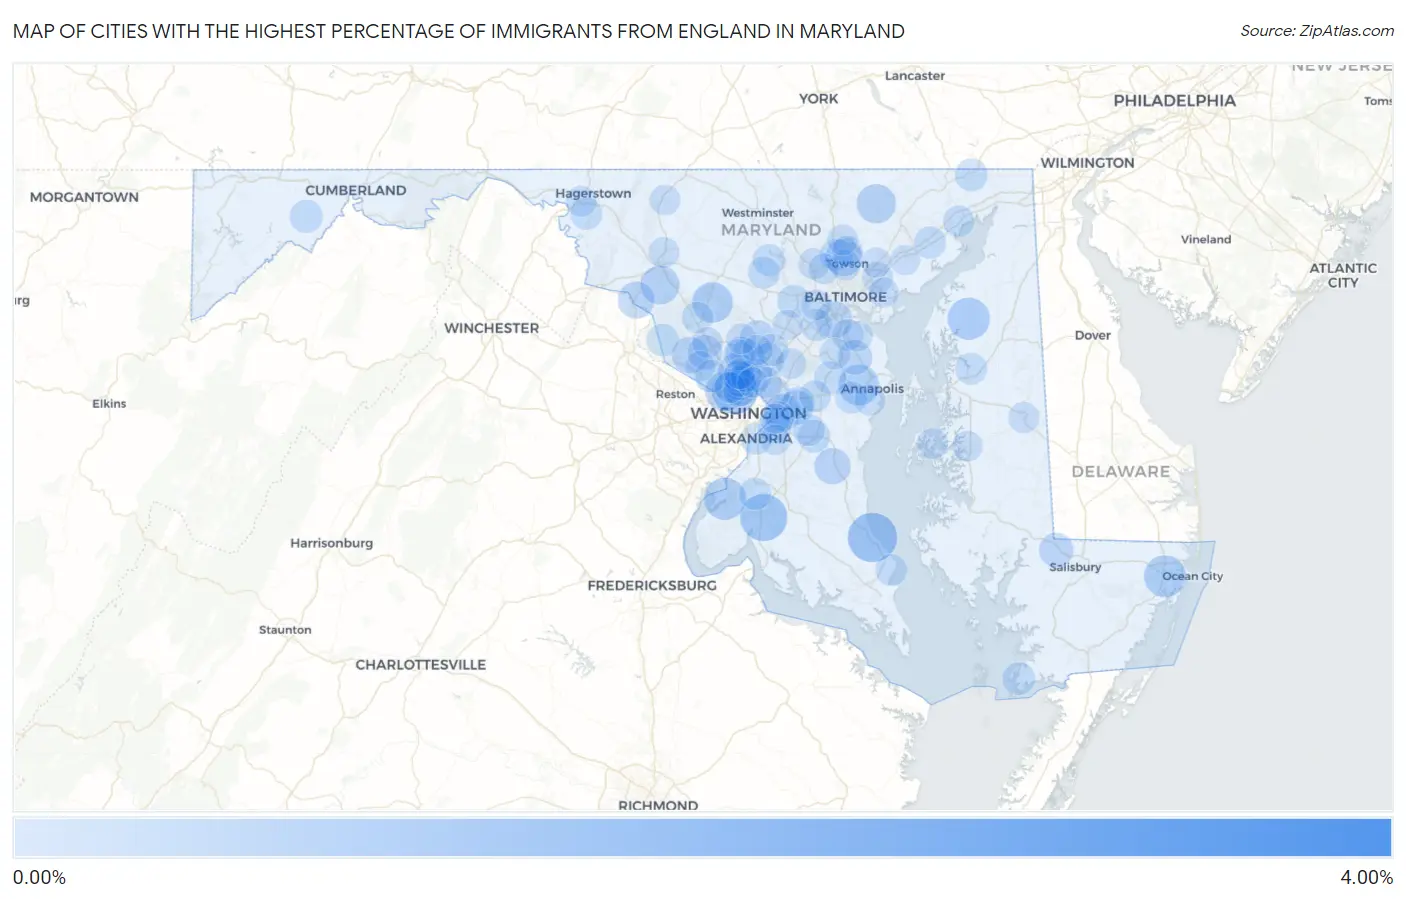
Map of Cities with the Highest Percentage of Immigrants from England in Maryland
0.00%
4.00%
Cities with the Highest Percentage of Immigrants from England in Maryland
| City | England | vs State | vs National | |
| 1. | Callaway | 3.87% | 0.095%(+3.77)#1 | 0.096%(+3.77)#60 |
| 2. | St Leonard | 1.32% | 0.095%(+1.23)#2 | 0.096%(+1.23)#277 |
| 3. | La Plata | 1.18% | 0.095%(+1.08)#3 | 0.096%(+1.08)#324 |
| 4. | Somerset | 1.07% | 0.095%(+0.975)#4 | 0.096%(+0.974)#362 |
| 5. | Potomac Heights | 0.86% | 0.095%(+0.763)#5 | 0.096%(+0.761)#509 |
| 6. | Chestertown | 0.85% | 0.095%(+0.757)#6 | 0.096%(+0.755)#518 |
| 7. | Berlin | 0.83% | 0.095%(+0.736)#7 | 0.096%(+0.734)#541 |
| 8. | Parole | 0.76% | 0.095%(+0.666)#8 | 0.096%(+0.665)#611 |
| 9. | Damascus | 0.75% | 0.095%(+0.659)#9 | 0.096%(+0.658)#616 |
| 10. | Glen Echo | 0.71% | 0.095%(+0.615)#10 | 0.096%(+0.613)#661 |
| 11. | Jarrettsville | 0.67% | 0.095%(+0.578)#11 | 0.096%(+0.576)#707 |
| 12. | Buckeystown | 0.65% | 0.095%(+0.553)#12 | 0.096%(+0.551)#739 |
| 13. | Linthicum | 0.53% | 0.095%(+0.437)#13 | 0.096%(+0.435)#938 |
| 14. | Lutherville | 0.53% | 0.095%(+0.436)#14 | 0.096%(+0.434)#939 |
| 15. | Peppermill Village | 0.51% | 0.095%(+0.420)#15 | 0.096%(+0.419)#974 |
| 16. | Point Of Rocks | 0.51% | 0.095%(+0.414)#16 | 0.096%(+0.412)#988 |
| 17. | Martin S Additions | 0.50% | 0.095%(+0.409)#17 | 0.096%(+0.407)#996 |
| 18. | Darnestown | 0.49% | 0.095%(+0.400)#18 | 0.096%(+0.398)#1,009 |
| 19. | Garrett Park | 0.49% | 0.095%(+0.396)#19 | 0.096%(+0.394)#1,019 |
| 20. | Dunkirk | 0.48% | 0.095%(+0.389)#20 | 0.096%(+0.387)#1,037 |
| 21. | Ashton Sandy Spring | 0.38% | 0.095%(+0.282)#21 | 0.096%(+0.280)#1,390 |
| 22. | North Potomac | 0.37% | 0.095%(+0.278)#22 | 0.096%(+0.276)#1,412 |
| 23. | Lake Arbor | 0.37% | 0.095%(+0.275)#23 | 0.096%(+0.273)#1,423 |
| 24. | Severna Park | 0.36% | 0.095%(+0.266)#24 | 0.096%(+0.265)#1,456 |
| 25. | Woodlawn Cdp Prince George S County | 0.36% | 0.095%(+0.265)#25 | 0.096%(+0.263)#1,465 |
| 26. | Hebron | 0.35% | 0.095%(+0.260)#26 | 0.096%(+0.259)#1,474 |
| 27. | Layhill | 0.35% | 0.095%(+0.254)#27 | 0.096%(+0.253)#1,498 |
| 28. | Four Corners | 0.33% | 0.095%(+0.240)#28 | 0.096%(+0.238)#1,556 |
| 29. | Fairland | 0.31% | 0.095%(+0.213)#29 | 0.096%(+0.212)#1,682 |
| 30. | Suitland | 0.30% | 0.095%(+0.207)#30 | 0.096%(+0.206)#1,715 |
| 31. | Honeygo | 0.29% | 0.095%(+0.196)#31 | 0.096%(+0.194)#1,787 |
| 32. | Lonaconing | 0.28% | 0.095%(+0.186)#32 | 0.096%(+0.184)#1,846 |
| 33. | Chevy Chase | 0.28% | 0.095%(+0.181)#33 | 0.096%(+0.180)#1,867 |
| 34. | Ellicott City | 0.27% | 0.095%(+0.174)#34 | 0.096%(+0.173)#1,906 |
| 35. | Upper Marlboro | 0.26% | 0.095%(+0.169)#35 | 0.096%(+0.167)#1,947 |
| 36. | Rising Sun | 0.25% | 0.095%(+0.159)#36 | 0.096%(+0.158)#2,024 |
| 37. | Poolesville | 0.25% | 0.095%(+0.152)#37 | 0.096%(+0.150)#2,073 |
| 38. | Crisfield | 0.25% | 0.095%(+0.151)#38 | 0.096%(+0.149)#2,076 |
| 39. | Potomac | 0.23% | 0.095%(+0.138)#39 | 0.096%(+0.136)#2,161 |
| 40. | Mays Chapel | 0.23% | 0.095%(+0.138)#40 | 0.096%(+0.136)#2,162 |
| 41. | Burtonsville | 0.22% | 0.095%(+0.128)#41 | 0.096%(+0.127)#2,230 |
| 42. | Riverside | 0.22% | 0.095%(+0.125)#42 | 0.096%(+0.123)#2,266 |
| 43. | St James | 0.22% | 0.095%(+0.125)#43 | 0.096%(+0.123)#2,269 |
| 44. | Bensville | 0.22% | 0.095%(+0.124)#44 | 0.096%(+0.122)#2,279 |
| 45. | Eldersburg | 0.22% | 0.095%(+0.123)#45 | 0.096%(+0.121)#2,292 |
| 46. | Crofton | 0.21% | 0.095%(+0.120)#46 | 0.096%(+0.118)#2,311 |
| 47. | Elkridge | 0.21% | 0.095%(+0.119)#47 | 0.096%(+0.118)#2,317 |
| 48. | Sykesville | 0.21% | 0.095%(+0.114)#48 | 0.096%(+0.113)#2,360 |
| 49. | Riva | 0.21% | 0.095%(+0.114)#49 | 0.096%(+0.113)#2,361 |
| 50. | Marlboro Village | 0.21% | 0.095%(+0.114)#50 | 0.096%(+0.112)#2,372 |
| 51. | Mitchellville | 0.21% | 0.095%(+0.112)#51 | 0.096%(+0.110)#2,388 |
| 52. | Leisure World | 0.20% | 0.095%(+0.106)#52 | 0.096%(+0.104)#2,437 |
| 53. | Capitol Heights | 0.20% | 0.095%(+0.104)#53 | 0.096%(+0.102)#2,462 |
| 54. | Flower Hill | 0.20% | 0.095%(+0.104)#54 | 0.096%(+0.102)#2,464 |
| 55. | Centreville | 0.19% | 0.095%(+0.097)#55 | 0.096%(+0.095)#2,538 |
| 56. | Chesapeake Ranch Estates | 0.19% | 0.095%(+0.095)#56 | 0.096%(+0.093)#2,552 |
| 57. | Forest Heights | 0.19% | 0.095%(+0.095)#57 | 0.096%(+0.093)#2,557 |
| 58. | Glen Burnie | 0.18% | 0.095%(+0.089)#58 | 0.096%(+0.087)#2,617 |
| 59. | Bowie | 0.18% | 0.095%(+0.087)#59 | 0.096%(+0.085)#2,642 |
| 60. | Chevy Chase View | 0.18% | 0.095%(+0.084)#60 | 0.096%(+0.082)#2,668 |
| 61. | Clarksburg | 0.17% | 0.095%(+0.071)#61 | 0.096%(+0.070)#2,799 |
| 62. | Havre De Grace | 0.16% | 0.095%(+0.068)#62 | 0.096%(+0.066)#2,840 |
| 63. | Gambrills | 0.16% | 0.095%(+0.066)#63 | 0.096%(+0.064)#2,853 |
| 64. | Chevy Chase Village | 0.16% | 0.095%(+0.065)#64 | 0.096%(+0.063)#2,872 |
| 65. | Rossville | 0.15% | 0.095%(+0.060)#65 | 0.096%(+0.058)#2,912 |
| 66. | Frederick | 0.15% | 0.095%(+0.055)#66 | 0.096%(+0.053)#2,992 |
| 67. | North Chevy Chase | 0.15% | 0.095%(+0.052)#67 | 0.096%(+0.051)#3,017 |
| 68. | Green Valley | 0.15% | 0.095%(+0.052)#68 | 0.096%(+0.050)#3,022 |
| 69. | Bethesda | 0.15% | 0.095%(+0.052)#69 | 0.096%(+0.050)#3,025 |
| 70. | Forest Glen | 0.15% | 0.095%(+0.051)#70 | 0.096%(+0.049)#3,030 |
| 71. | Denton | 0.14% | 0.095%(+0.050)#71 | 0.096%(+0.048)#3,039 |
| 72. | Garrison | 0.14% | 0.095%(+0.049)#72 | 0.096%(+0.047)#3,054 |
| 73. | Adelphi | 0.14% | 0.095%(+0.047)#73 | 0.096%(+0.045)#3,075 |
| 74. | Towson | 0.14% | 0.095%(+0.041)#74 | 0.096%(+0.039)#3,151 |
| 75. | Aspen Hill | 0.13% | 0.095%(+0.040)#75 | 0.096%(+0.038)#3,159 |
| 76. | Kensington | 0.13% | 0.095%(+0.039)#76 | 0.096%(+0.038)#3,167 |
| 77. | Annapolis Neck | 0.13% | 0.095%(+0.039)#77 | 0.096%(+0.037)#3,169 |
| 78. | Pikesville | 0.13% | 0.095%(+0.037)#78 | 0.096%(+0.036)#3,189 |
| 79. | St Michaels | 0.13% | 0.095%(+0.037)#79 | 0.096%(+0.035)#3,201 |
| 80. | Timonium | 0.13% | 0.095%(+0.035)#80 | 0.096%(+0.033)#3,228 |
| 81. | Halfway | 0.13% | 0.095%(+0.033)#81 | 0.096%(+0.031)#3,254 |
| 82. | Easton | 0.12% | 0.095%(+0.028)#82 | 0.096%(+0.026)#3,315 |
| 83. | Olney | 0.12% | 0.095%(+0.026)#83 | 0.096%(+0.025)#3,331 |
| 84. | Gaithersburg | 0.12% | 0.095%(+0.023)#84 | 0.096%(+0.021)#3,369 |
| 85. | Cockeysville | 0.12% | 0.095%(+0.022)#85 | 0.096%(+0.020)#3,384 |
| 86. | Thurmont | 0.11% | 0.095%(+0.016)#86 | 0.096%(+0.015)#3,467 |
| 87. | Camp Springs | 0.10% | 0.095%(+0.009)#87 | 0.096%(+0.007)#3,572 |
| 88. | Catonsville | 0.10% | 0.095%(+0.008)#88 | 0.096%(+0.007)#3,579 |
| 89. | South Laurel | 0.10% | 0.095%(+0.007)#89 | 0.096%(+0.006)#3,590 |
| 90. | Travilah | 0.10% | 0.095%(+0.007)#90 | 0.096%(+0.005)#3,599 |
| 91. | Silver Spring | 0.099% | 0.095%(+0.004)#91 | 0.096%(+0.003)#3,638 |
| 92. | Columbia | 0.098% | 0.095%(+0.003)#92 | 0.096%(+0.001)#3,656 |
| 93. | Pasadena | 0.096% | 0.095%(+0.002)#93 | 0.096%(+0.000)#3,670 |
| 94. | Riverdale Park | 0.096% | 0.095%(+0.002)#94 | 0.096%(-0.000)#3,673 |
| 95. | Coral Hills | 0.096% | 0.095%(+0.001)#95 | 0.096%(-0.001)#3,682 |
| 96. | Cloverly | 0.091% | 0.095%(-0.003)#96 | 0.096%(-0.005)#3,753 |
| 97. | Essex | 0.091% | 0.095%(-0.004)#97 | 0.096%(-0.006)#3,764 |
| 98. | Woodlawn Cdp Baltimore County | 0.090% | 0.095%(-0.005)#98 | 0.096%(-0.006)#3,775 |
| 99. | Joppatowne | 0.090% | 0.095%(-0.005)#99 | 0.096%(-0.007)#3,782 |
| 100. | Perry Hall | 0.089% | 0.095%(-0.006)#100 | 0.096%(-0.007)#3,789 |
Common Questions
What are the Top 10 Cities with the Highest Percentage of Immigrants from England in Maryland?
Top 10 Cities with the Highest Percentage of Immigrants from England in Maryland are:
#1
1.32%
#2
1.18%
#3
1.07%
#4
0.86%
#5
0.85%
#6
0.83%
#7
0.76%
#8
0.75%
#9
0.71%
#10
0.67%
What city has the Highest Percentage of Immigrants from England in Maryland?
St Leonard has the Highest Percentage of Immigrants from England in Maryland with 1.32%.
What is the Percentage of Immigrants from England in the State of Maryland?
Percentage of Immigrants from England in Maryland is 0.095%.
What is the Percentage of Immigrants from England in the United States?
Percentage of Immigrants from England in the United States is 0.096%.