Cities with the Largest Native Hawaiian Community in Maryland
RELATED REPORTS & OPTIONS
Native Hawaiian
Maryland
Compare Cities
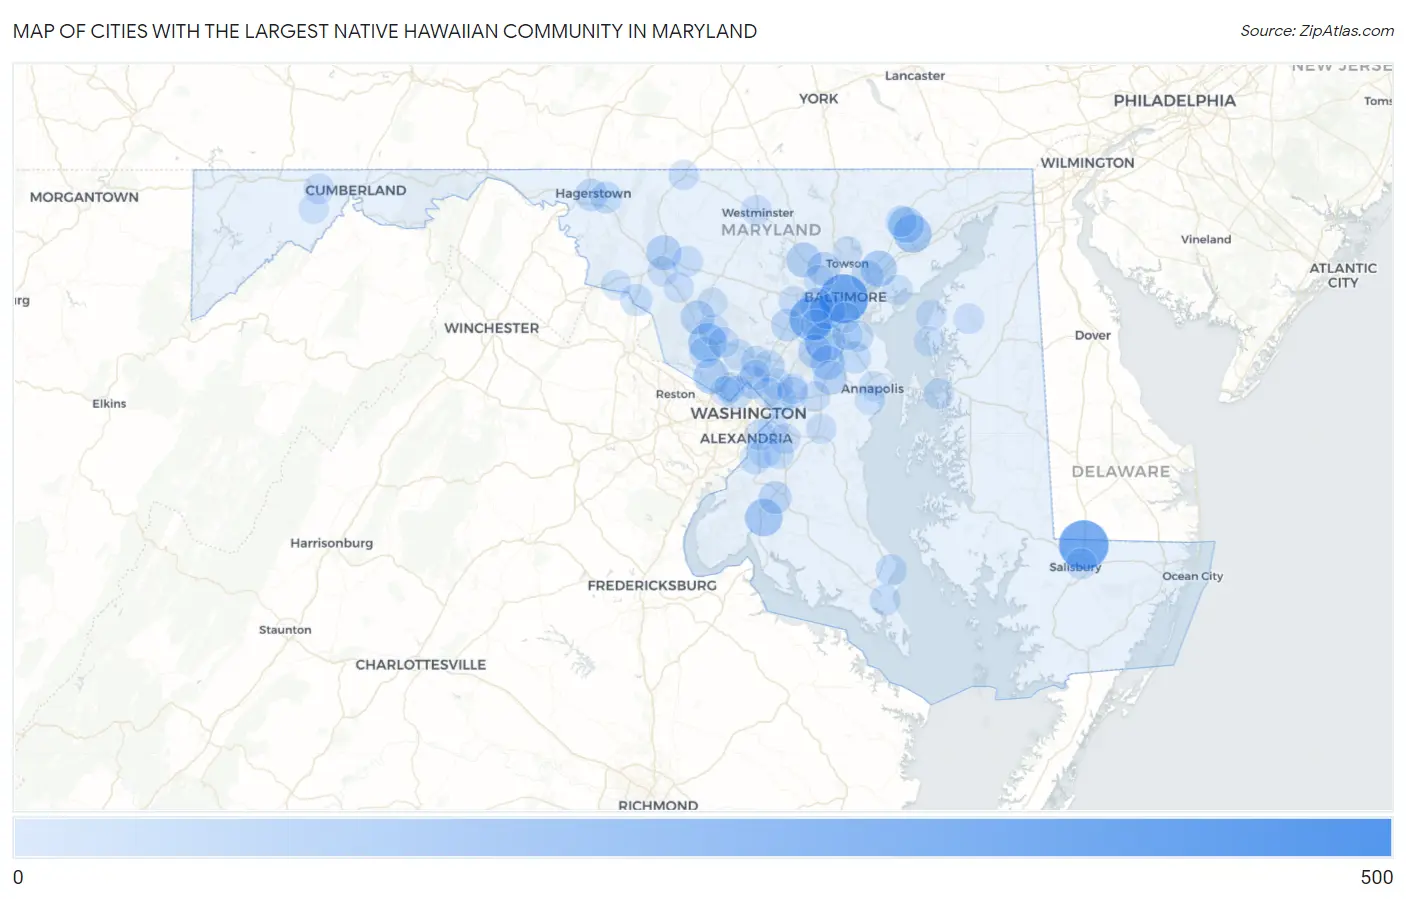
Map of Cities with the Largest Native Hawaiian Community in Maryland
0
500
Cities with the Largest Native Hawaiian Community in Maryland
| City | Native Hawaiian | vs State | vs National | |
| 1. | Woodlawn Cdp Baltimore County | 489 | 4,486(10.90%)#1 | 654,614(0.07%)#193 |
| 2. | Delmar | 348 | 4,486(7.76%)#2 | 654,614(0.05%)#279 |
| 3. | Baltimore | 339 | 4,486(7.56%)#3 | 654,614(0.05%)#283 |
| 4. | Ilchester | 236 | 4,486(5.26%)#4 | 654,614(0.04%)#368 |
| 5. | Severn | 172 | 4,486(3.83%)#5 | 654,614(0.03%)#482 |
| 6. | Gaithersburg | 146 | 4,486(3.25%)#6 | 654,614(0.02%)#549 |
| 7. | Bel Air South | 140 | 4,486(3.12%)#7 | 654,614(0.02%)#576 |
| 8. | La Plata | 131 | 4,486(2.92%)#8 | 654,614(0.02%)#612 |
| 9. | White Marsh | 106 | 4,486(2.36%)#9 | 654,614(0.02%)#723 |
| 10. | Bel Air | 104 | 4,486(2.32%)#10 | 654,614(0.02%)#737 |
| 11. | Potomac | 100 | 4,486(2.23%)#11 | 654,614(0.02%)#757 |
| 12. | Arbutus | 100 | 4,486(2.23%)#12 | 654,614(0.02%)#758 |
| 13. | Owings Mills | 86 | 4,486(1.92%)#13 | 654,614(0.01%)#859 |
| 14. | Frederick | 85 | 4,486(1.89%)#14 | 654,614(0.01%)#865 |
| 15. | Odenton | 76 | 4,486(1.69%)#15 | 654,614(0.01%)#940 |
| 16. | Clarksburg | 70 | 4,486(1.56%)#16 | 654,614(0.01%)#995 |
| 17. | Fort Meade | 65 | 4,486(1.45%)#17 | 654,614(0.01%)#1,047 |
| 18. | Pikesville | 64 | 4,486(1.43%)#18 | 654,614(0.01%)#1,058 |
| 19. | Catonsville | 63 | 4,486(1.40%)#19 | 654,614(0.01%)#1,071 |
| 20. | Crofton | 62 | 4,486(1.38%)#20 | 654,614(0.01%)#1,084 |
| 21. | Friendship Heights Village | 55 | 4,486(1.23%)#21 | 654,614(0.01%)#1,174 |
| 22. | Silver Spring | 52 | 4,486(1.16%)#22 | 654,614(0.01%)#1,207 |
| 23. | Columbia | 48 | 4,486(1.07%)#23 | 654,614(0.01%)#1,280 |
| 24. | Waldorf | 48 | 4,486(1.07%)#24 | 654,614(0.01%)#1,282 |
| 25. | Overlea | 45 | 4,486(1.00%)#25 | 654,614(0.01%)#1,346 |
| 26. | Hagerstown | 44 | 4,486(0.98%)#26 | 654,614(0.01%)#1,361 |
| 27. | Severna Park | 36 | 4,486(0.80%)#27 | 654,614(0.01%)#1,533 |
| 28. | Point Of Rocks | 35 | 4,486(0.78%)#28 | 654,614(0.01%)#1,564 |
| 29. | Calverton | 34 | 4,486(0.76%)#29 | 654,614(0.01%)#1,582 |
| 30. | Landover Hills | 34 | 4,486(0.76%)#30 | 654,614(0.01%)#1,596 |
| 31. | Robinwood | 32 | 4,486(0.71%)#31 | 654,614(0.00%)#1,650 |
| 32. | Aspen Hill | 28 | 4,486(0.62%)#32 | 654,614(0.00%)#1,761 |
| 33. | North Potomac | 27 | 4,486(0.60%)#33 | 654,614(0.00%)#1,807 |
| 34. | Fort Washington | 25 | 4,486(0.56%)#34 | 654,614(0.00%)#1,874 |
| 35. | Friendly | 25 | 4,486(0.56%)#35 | 654,614(0.00%)#1,890 |
| 36. | Chesapeake Ranch Estates | 25 | 4,486(0.56%)#36 | 654,614(0.00%)#1,894 |
| 37. | Bel Air North | 24 | 4,486(0.53%)#37 | 654,614(0.00%)#1,915 |
| 38. | Pasadena | 22 | 4,486(0.49%)#38 | 654,614(0.00%)#1,997 |
| 39. | Glassmanor | 22 | 4,486(0.49%)#39 | 654,614(0.00%)#2,010 |
| 40. | Berwyn Heights | 21 | 4,486(0.47%)#40 | 654,614(0.00%)#2,071 |
| 41. | Salisbury | 20 | 4,486(0.45%)#41 | 654,614(0.00%)#2,086 |
| 42. | Elkridge | 20 | 4,486(0.45%)#42 | 654,614(0.00%)#2,091 |
| 43. | Lanham | 18 | 4,486(0.40%)#43 | 654,614(0.00%)#2,203 |
| 44. | Lexington Park | 17 | 4,486(0.38%)#44 | 654,614(0.00%)#2,256 |
| 45. | Linganore | 16 | 4,486(0.36%)#45 | 654,614(0.00%)#2,326 |
| 46. | Grasonville | 15 | 4,486(0.33%)#46 | 654,614(0.00%)#2,399 |
| 47. | Montgomery Village | 14 | 4,486(0.31%)#47 | 654,614(0.00%)#2,436 |
| 48. | Colesville | 14 | 4,486(0.31%)#48 | 654,614(0.00%)#2,451 |
| 49. | Silver Hill | 14 | 4,486(0.31%)#49 | 654,614(0.00%)#2,466 |
| 50. | Andrews Afb | 13 | 4,486(0.29%)#50 | 654,614(0.00%)#2,535 |
| 51. | Frostburg | 12 | 4,486(0.27%)#51 | 654,614(0.00%)#2,590 |
| 52. | Bowie | 11 | 4,486(0.25%)#52 | 654,614(0.00%)#2,630 |
| 53. | Tolchester | 11 | 4,486(0.25%)#53 | 654,614(0.00%)#2,710 |
| 54. | Ellicott City | 10 | 4,486(0.22%)#54 | 654,614(0.00%)#2,720 |
| 55. | Clinton | 10 | 4,486(0.22%)#55 | 654,614(0.00%)#2,734 |
| 56. | Redland | 10 | 4,486(0.22%)#56 | 654,614(0.00%)#2,751 |
| 57. | Chestertown | 10 | 4,486(0.22%)#57 | 654,614(0.00%)#2,779 |
| 58. | Glen Burnie | 9 | 4,486(0.20%)#58 | 654,614(0.00%)#2,827 |
| 59. | Bethesda | 9 | 4,486(0.20%)#59 | 654,614(0.00%)#2,830 |
| 60. | Seabrook | 9 | 4,486(0.20%)#60 | 654,614(0.00%)#2,854 |
| 61. | Bowleys Quarters | 8 | 4,486(0.18%)#61 | 654,614(0.00%)#2,995 |
| 62. | Ballenger Creek | 7 | 4,486(0.16%)#62 | 654,614(0.00%)#3,072 |
| 63. | Brooklyn Park | 7 | 4,486(0.16%)#63 | 654,614(0.00%)#3,084 |
| 64. | Urbana | 7 | 4,486(0.16%)#64 | 654,614(0.00%)#3,087 |
| 65. | Four Corners | 7 | 4,486(0.16%)#65 | 654,614(0.00%)#3,098 |
| 66. | Emmitsburg | 7 | 4,486(0.16%)#66 | 654,614(0.00%)#3,115 |
| 67. | Westminster | 6 | 4,486(0.13%)#67 | 654,614(0.00%)#3,171 |
| 68. | Marlboro Meadows | 6 | 4,486(0.13%)#68 | 654,614(0.00%)#3,200 |
| 69. | Green Valley | 5 | 4,486(0.11%)#69 | 654,614(0.00%)#3,284 |
| 70. | Timonium | 4 | 4,486(0.09%)#70 | 654,614(0.00%)#3,418 |
| 71. | Naval Academy | 4 | 4,486(0.09%)#71 | 654,614(0.00%)#3,446 |
| 72. | Glen Echo | 4 | 4,486(0.09%)#72 | 654,614(0.00%)#3,498 |
| 73. | Hyattsville | 3 | 4,486(0.07%)#73 | 654,614(0.00%)#3,517 |
| 74. | Annapolis Neck | 3 | 4,486(0.07%)#74 | 654,614(0.00%)#3,527 |
| 75. | Rosemont | 3 | 4,486(0.07%)#75 | 654,614(0.00%)#3,641 |
| 76. | Lochearn | 2 | 4,486(0.04%)#76 | 654,614(0.00%)#3,657 |
| 77. | Damascus | 1 | 4,486(0.02%)#77 | 654,614(0.00%)#3,804 |
| 78. | Rock Hall | 1 | 4,486(0.02%)#78 | 654,614(0.00%)#3,855 |
| 79. | Midland | 1 | 4,486(0.02%)#79 | 654,614(0.00%)#3,880 |
1
2Common Questions
What are the Top 10 Cities with the Largest Native Hawaiian Community in Maryland?
Top 10 Cities with the Largest Native Hawaiian Community in Maryland are:
#1
348
#2
339
#3
236
#4
172
#5
146
#6
140
#7
131
#8
106
#9
104
#10
100
What city has the Largest Native Hawaiian Community in Maryland?
Delmar has the Largest Native Hawaiian Community in Maryland with 348.
What is the Total Native Hawaiian Population in the State of Maryland?
Total Native Hawaiian Population in Maryland is 4,486.
What is the Total Native Hawaiian Population in the United States?
Total Native Hawaiian Population in the United States is 654,614.