Cities with the Highest Percentage of Immigrants from Asia in Maryland
RELATED REPORTS & OPTIONS
Asia
Maryland
Compare Cities
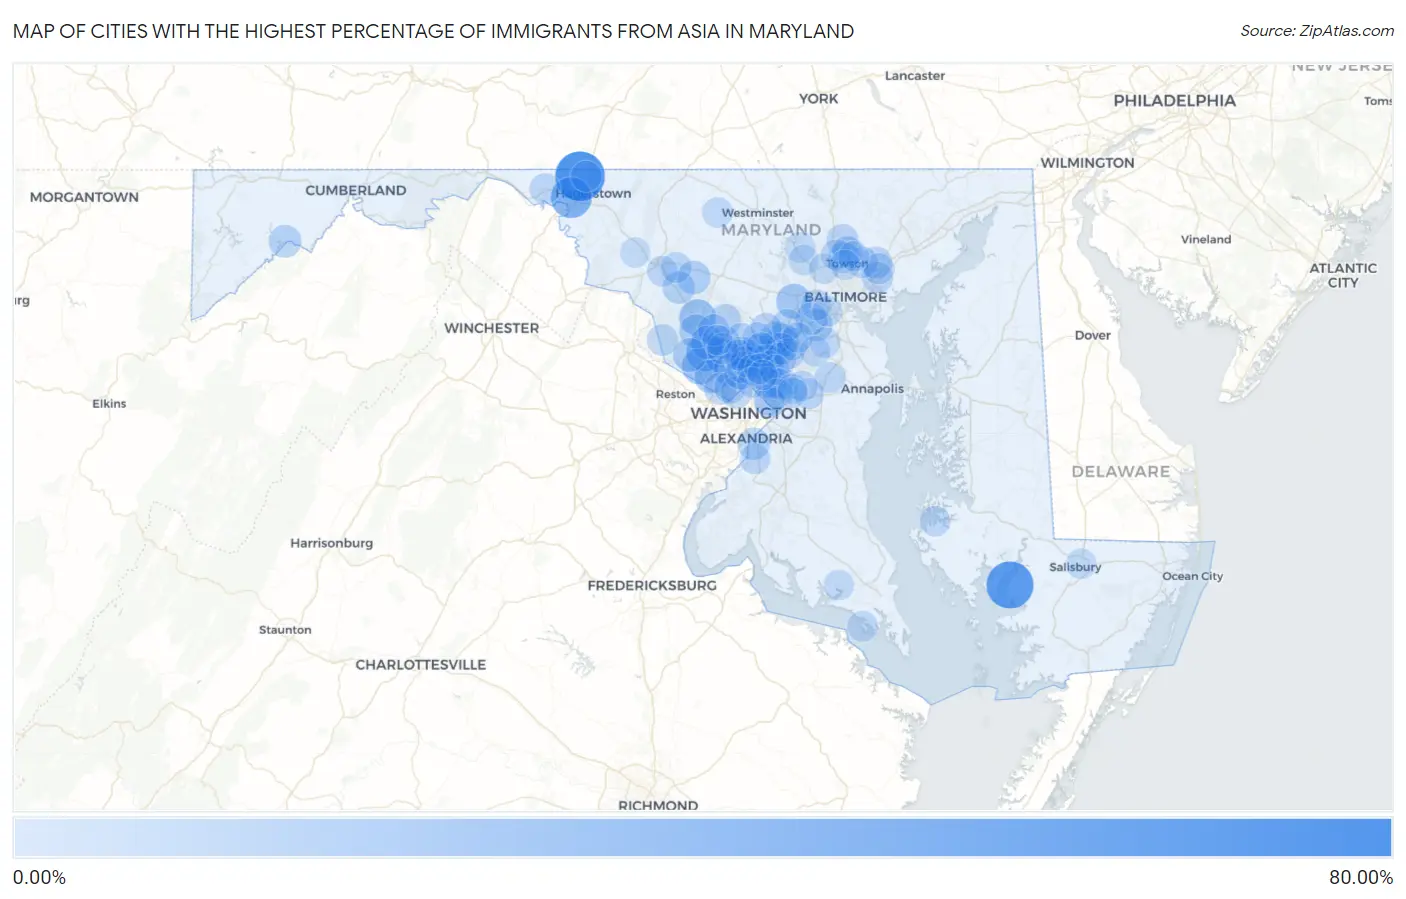
Map of Cities with the Highest Percentage of Immigrants from Asia in Maryland
0.00%
80.00%
Cities with the Highest Percentage of Immigrants from Asia in Maryland
| City | Asia | vs State | vs National | |
| 1. | Cearfoss | 70.75% | 4.95%(+65.8)#1 | 4.26%(+66.5)#3 |
| 2. | Bivalve | 62.26% | 4.95%(+57.3)#2 | 4.26%(+58.0)#6 |
| 3. | Kemps Mill | 40.74% | 4.95%(+35.8)#3 | 4.26%(+36.5)#38 |
| 4. | North Potomac | 28.93% | 4.95%(+24.0)#4 | 4.26%(+24.7)#121 |
| 5. | Clarksburg | 26.08% | 4.95%(+21.1)#5 | 4.26%(+21.8)#150 |
| 6. | Travilah | 24.92% | 4.95%(+20.0)#6 | 4.26%(+20.7)#173 |
| 7. | Ellicott City | 20.74% | 4.95%(+15.8)#7 | 4.26%(+16.5)#259 |
| 8. | Burtonsville | 19.39% | 4.95%(+14.4)#8 | 4.26%(+15.1)#301 |
| 9. | Rockville | 19.38% | 4.95%(+14.4)#9 | 4.26%(+15.1)#302 |
| 10. | Potomac | 17.05% | 4.95%(+12.1)#10 | 4.26%(+12.8)#392 |
| 11. | Germantown | 16.55% | 4.95%(+11.6)#11 | 4.26%(+12.3)#408 |
| 12. | Gaithersburg | 16.45% | 4.95%(+11.5)#12 | 4.26%(+12.2)#414 |
| 13. | Darnestown | 16.25% | 4.95%(+11.3)#13 | 4.26%(+12.0)#422 |
| 14. | Monrovia | 15.37% | 4.95%(+10.4)#14 | 4.26%(+11.1)#462 |
| 15. | Redland | 13.98% | 4.95%(+9.03)#15 | 4.26%(+9.72)#543 |
| 16. | North Bethesda | 13.71% | 4.95%(+8.75)#16 | 4.26%(+9.45)#556 |
| 17. | Scaggsville | 13.51% | 4.95%(+8.55)#17 | 4.26%(+9.25)#570 |
| 18. | Elkridge | 13.47% | 4.95%(+8.52)#18 | 4.26%(+9.21)#573 |
| 19. | Flower Hill | 13.43% | 4.95%(+8.48)#19 | 4.26%(+9.17)#581 |
| 20. | Fulton | 13.12% | 4.95%(+8.16)#20 | 4.26%(+8.86)#603 |
| 21. | Bloomington | 12.78% | 4.95%(+7.83)#21 | 4.26%(+8.52)#624 |
| 22. | Urbana | 12.50% | 4.95%(+7.55)#22 | 4.26%(+8.24)#645 |
| 23. | Ilchester | 11.89% | 4.95%(+6.93)#23 | 4.26%(+7.63)#699 |
| 24. | Layhill | 11.69% | 4.95%(+6.74)#24 | 4.26%(+7.43)#717 |
| 25. | National Harbor | 11.27% | 4.95%(+6.31)#25 | 4.26%(+7.01)#748 |
| 26. | Cloverly | 11.18% | 4.95%(+6.23)#26 | 4.26%(+6.92)#760 |
| 27. | Laytonsville | 11.01% | 4.95%(+6.05)#27 | 4.26%(+6.75)#786 |
| 28. | Cabin John | 10.52% | 4.95%(+5.56)#28 | 4.26%(+6.26)#848 |
| 29. | Colesville | 10.46% | 4.95%(+5.50)#29 | 4.26%(+6.20)#854 |
| 30. | North Laurel | 10.45% | 4.95%(+5.49)#30 | 4.26%(+6.19)#855 |
| 31. | Woodlawn Cdp Baltimore County | 10.19% | 4.95%(+5.24)#31 | 4.26%(+5.93)#896 |
| 32. | Columbia | 10.03% | 4.95%(+5.08)#32 | 4.26%(+5.77)#926 |
| 33. | Cockeysville | 9.96% | 4.95%(+5.01)#33 | 4.26%(+5.70)#930 |
| 34. | Perry Hall | 9.94% | 4.95%(+4.98)#34 | 4.26%(+5.68)#935 |
| 35. | Bethesda | 9.93% | 4.95%(+4.98)#35 | 4.26%(+5.67)#936 |
| 36. | Olney | 9.64% | 4.95%(+4.68)#36 | 4.26%(+5.38)#967 |
| 37. | Konterra | 9.63% | 4.95%(+4.68)#37 | 4.26%(+5.37)#970 |
| 38. | Friendship Heights Village | 9.59% | 4.95%(+4.64)#38 | 4.26%(+5.33)#975 |
| 39. | Leisure World | 9.47% | 4.95%(+4.52)#39 | 4.26%(+5.21)#988 |
| 40. | Montgomery Village | 9.41% | 4.95%(+4.45)#40 | 4.26%(+5.15)#1,002 |
| 41. | Fairland | 9.24% | 4.95%(+4.28)#41 | 4.26%(+4.98)#1,023 |
| 42. | West Laurel | 9.16% | 4.95%(+4.21)#42 | 4.26%(+4.90)#1,035 |
| 43. | Honeygo | 9.01% | 4.95%(+4.05)#43 | 4.26%(+4.75)#1,061 |
| 44. | Poolesville | 8.97% | 4.95%(+4.01)#44 | 4.26%(+4.71)#1,073 |
| 45. | College Park | 8.91% | 4.95%(+3.96)#45 | 4.26%(+4.65)#1,080 |
| 46. | Highland | 8.85% | 4.95%(+3.89)#46 | 4.26%(+4.59)#1,092 |
| 47. | Calverton | 8.82% | 4.95%(+3.86)#47 | 4.26%(+4.56)#1,095 |
| 48. | Lutherville | 8.78% | 4.95%(+3.82)#48 | 4.26%(+4.52)#1,108 |
| 49. | Greenbelt | 8.60% | 4.95%(+3.64)#49 | 4.26%(+4.34)#1,148 |
| 50. | Kensington | 8.39% | 4.95%(+3.43)#50 | 4.26%(+4.13)#1,191 |
| 51. | Wheaton | 8.31% | 4.95%(+3.35)#51 | 4.26%(+4.04)#1,210 |
| 52. | Rossville | 8.26% | 4.95%(+3.31)#52 | 4.26%(+4.00)#1,214 |
| 53. | Glenmont | 8.10% | 4.95%(+3.14)#53 | 4.26%(+3.84)#1,243 |
| 54. | Carney | 7.98% | 4.95%(+3.02)#54 | 4.26%(+3.72)#1,269 |
| 55. | Maugansville | 7.51% | 4.95%(+2.55)#55 | 4.26%(+3.25)#1,372 |
| 56. | Derwood | 7.41% | 4.95%(+2.45)#56 | 4.26%(+3.15)#1,398 |
| 57. | Adelphi | 7.37% | 4.95%(+2.42)#57 | 4.26%(+3.11)#1,404 |
| 58. | Burnt Mills | 7.37% | 4.95%(+2.41)#58 | 4.26%(+3.11)#1,408 |
| 59. | White Marsh | 7.27% | 4.95%(+2.31)#59 | 4.26%(+3.00)#1,430 |
| 60. | Cottage City | 7.26% | 4.95%(+2.31)#60 | 4.26%(+3.00)#1,431 |
| 61. | Mays Chapel | 7.23% | 4.95%(+2.28)#61 | 4.26%(+2.97)#1,439 |
| 62. | Bartonsville | 7.08% | 4.95%(+2.12)#62 | 4.26%(+2.82)#1,478 |
| 63. | Clear Spring | 7.06% | 4.95%(+2.10)#63 | 4.26%(+2.80)#1,484 |
| 64. | Aspen Hill | 7.03% | 4.95%(+2.07)#64 | 4.26%(+2.77)#1,491 |
| 65. | Fort Washington | 6.93% | 4.95%(+1.97)#65 | 4.26%(+2.67)#1,527 |
| 66. | Ballenger Creek | 6.78% | 4.95%(+1.82)#66 | 4.26%(+2.52)#1,570 |
| 67. | Crofton | 6.67% | 4.95%(+1.71)#67 | 4.26%(+2.41)#1,609 |
| 68. | Fairwood | 6.62% | 4.95%(+1.67)#68 | 4.26%(+2.36)#1,617 |
| 69. | Kemp Mill | 6.59% | 4.95%(+1.63)#69 | 4.26%(+2.33)#1,626 |
| 70. | Timonium | 6.55% | 4.95%(+1.60)#70 | 4.26%(+2.29)#1,637 |
| 71. | Silver Spring | 6.49% | 4.95%(+1.53)#71 | 4.26%(+2.23)#1,649 |
| 72. | Reisterstown | 6.45% | 4.95%(+1.49)#72 | 4.26%(+2.19)#1,662 |
| 73. | Union Bridge | 6.39% | 4.95%(+1.43)#73 | 4.26%(+2.13)#1,677 |
| 74. | Berwyn Heights | 6.37% | 4.95%(+1.42)#74 | 4.26%(+2.11)#1,686 |
| 75. | Tall Timbers | 6.25% | 4.95%(+1.30)#75 | 4.26%(+1.99)#1,715 |
| 76. | Severn | 6.18% | 4.95%(+1.23)#76 | 4.26%(+1.92)#1,739 |
| 77. | Laurel | 6.03% | 4.95%(+1.08)#77 | 4.26%(+1.77)#1,776 |
| 78. | Catonsville | 5.96% | 4.95%(+1.01)#78 | 4.26%(+1.70)#1,805 |
| 79. | White Oak | 5.84% | 4.95%(+0.881)#79 | 4.26%(+1.58)#1,859 |
| 80. | Fort Meade | 5.67% | 4.95%(+0.719)#80 | 4.26%(+1.41)#1,917 |
| 81. | Arbutus | 5.65% | 4.95%(+0.697)#81 | 4.26%(+1.39)#1,927 |
| 82. | Madison | 5.63% | 4.95%(+0.679)#82 | 4.26%(+1.37)#1,933 |
| 83. | Beltsville | 5.61% | 4.95%(+0.653)#83 | 4.26%(+1.35)#1,947 |
| 84. | Ashton Sandy Spring | 5.50% | 4.95%(+0.549)#84 | 4.26%(+1.24)#1,982 |
| 85. | Glenn Dale | 5.49% | 4.95%(+0.536)#85 | 4.26%(+1.23)#1,992 |
| 86. | Colmar Manor | 5.34% | 4.95%(+0.388)#86 | 4.26%(+1.08)#2,049 |
| 87. | Owings Mills | 5.31% | 4.95%(+0.351)#87 | 4.26%(+1.05)#2,063 |
| 88. | Savage | 5.19% | 4.95%(+0.239)#88 | 4.26%(+0.934)#2,108 |
| 89. | Leonardtown | 5.19% | 4.95%(+0.235)#89 | 4.26%(+0.929)#2,111 |
| 90. | Spencerville | 5.17% | 4.95%(+0.213)#90 | 4.26%(+0.908)#2,119 |
| 91. | Pikesville | 5.07% | 4.95%(+0.118)#91 | 4.26%(+0.813)#2,165 |
| 92. | East Riverdale | 5.07% | 4.95%(+0.117)#92 | 4.26%(+0.812)#2,166 |
| 93. | Seabrook | 4.99% | 4.95%(+0.038)#93 | 4.26%(+0.732)#2,196 |
| 94. | Middletown | 4.98% | 4.95%(+0.027)#94 | 4.26%(+0.722)#2,201 |
| 95. | Hillandale | 4.98% | 4.95%(+0.023)#95 | 4.26%(+0.718)#2,204 |
| 96. | Hampton | 4.96% | 4.95%(+0.006)#96 | 4.26%(+0.700)#2,216 |
| 97. | Salisbury | 4.92% | 4.95%(-0.037)#97 | 4.26%(+0.658)#2,242 |
| 98. | Washington Grove | 4.80% | 4.95%(-0.154)#98 | 4.26%(+0.541)#2,309 |
| 99. | Lanham | 4.72% | 4.95%(-0.239)#99 | 4.26%(+0.456)#2,357 |
| 100. | Towson | 4.66% | 4.95%(-0.298)#100 | 4.26%(+0.396)#2,384 |
Common Questions
What are the Top 10 Cities with the Highest Percentage of Immigrants from Asia in Maryland?
Top 10 Cities with the Highest Percentage of Immigrants from Asia in Maryland are:
#1
70.75%
#2
62.26%
#3
40.74%
#4
28.93%
#5
26.08%
#6
24.92%
#7
20.74%
#8
19.39%
#9
19.38%
#10
17.05%
What city has the Highest Percentage of Immigrants from Asia in Maryland?
Cearfoss has the Highest Percentage of Immigrants from Asia in Maryland with 70.75%.
What is the Percentage of Immigrants from Asia in the State of Maryland?
Percentage of Immigrants from Asia in Maryland is 4.95%.
What is the Percentage of Immigrants from Asia in the United States?
Percentage of Immigrants from Asia in the United States is 4.26%.