Cities with the Highest Percentage of Croatian Population in Maryland
RELATED REPORTS & OPTIONS
Croatian
Maryland
Compare Cities
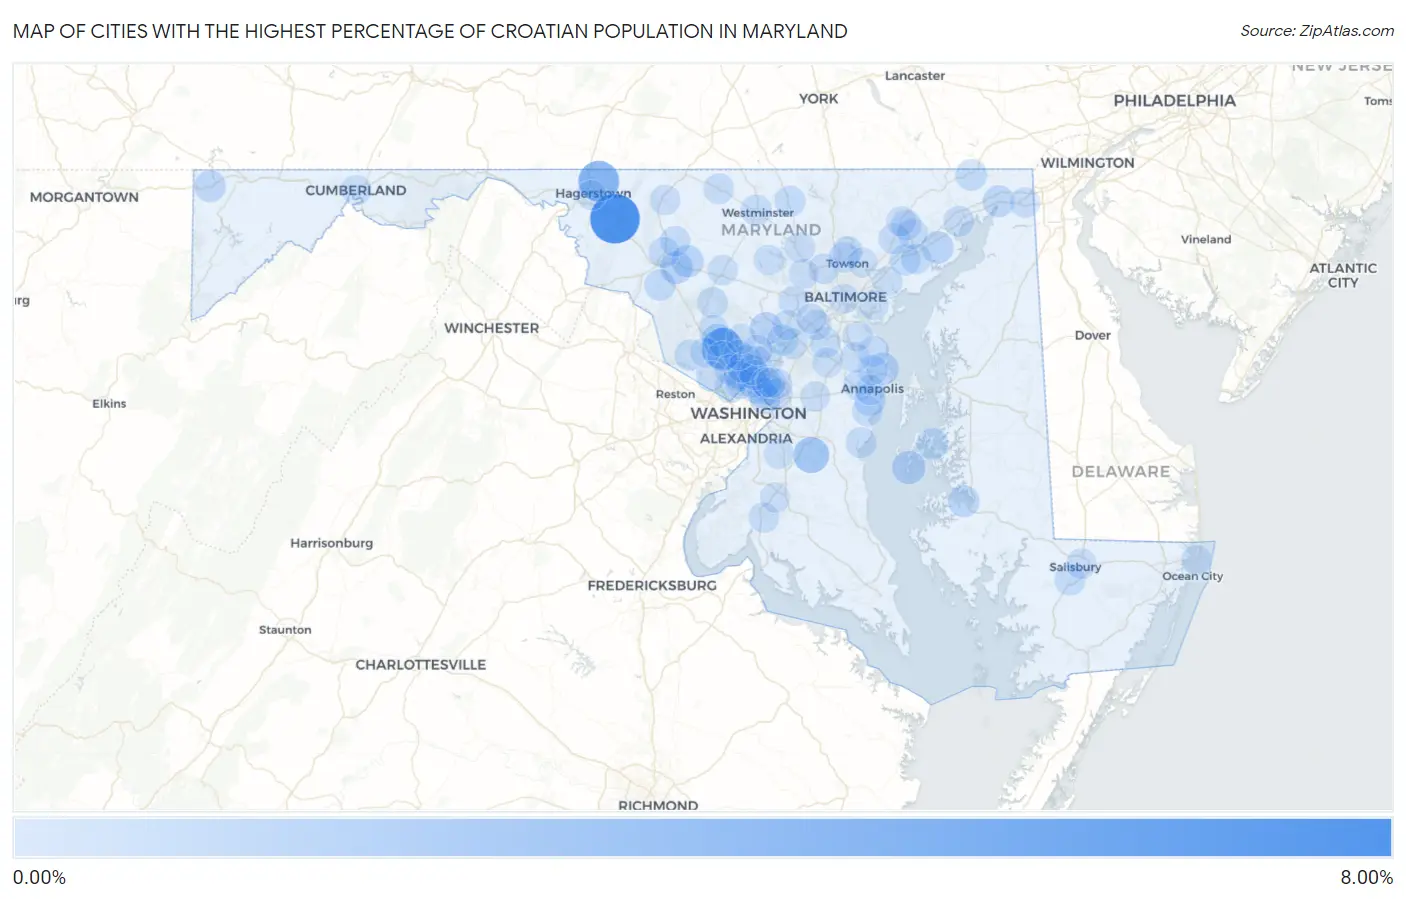
Map of Cities with the Highest Percentage of Croatian Population in Maryland
0.00%
8.00%
Cities with the Highest Percentage of Croatian Population in Maryland
| City | Croatian | vs State | vs National | |
| 1. | Mount Lena | 6.12% | 0.069%(+6.05)#1 | 0.12%(+6.00)#53 |
| 2. | Derwood | 3.46% | 0.069%(+3.39)#2 | 0.12%(+3.34)#140 |
| 3. | Paramount Long Meadow | 3.29% | 0.069%(+3.22)#3 | 0.12%(+3.17)#164 |
| 4. | Croom | 1.76% | 0.069%(+1.69)#4 | 0.12%(+1.64)#412 |
| 5. | Tilghman Island | 0.97% | 0.069%(+0.900)#5 | 0.12%(+0.848)#856 |
| 6. | Highland | 0.86% | 0.069%(+0.794)#6 | 0.12%(+0.742)#952 |
| 7. | Bartonsville | 0.80% | 0.069%(+0.732)#7 | 0.12%(+0.680)#1,031 |
| 8. | Linganore | 0.74% | 0.069%(+0.673)#8 | 0.12%(+0.621)#1,112 |
| 9. | Cape St Claire | 0.73% | 0.069%(+0.659)#9 | 0.12%(+0.607)#1,140 |
| 10. | Perryman | 0.71% | 0.069%(+0.639)#10 | 0.12%(+0.587)#1,180 |
| 11. | Washington Grove | 0.66% | 0.069%(+0.593)#11 | 0.12%(+0.542)#1,248 |
| 12. | Glenmont | 0.60% | 0.069%(+0.532)#12 | 0.12%(+0.481)#1,385 |
| 13. | North East | 0.54% | 0.069%(+0.473)#13 | 0.12%(+0.421)#1,506 |
| 14. | Takoma Park | 0.49% | 0.069%(+0.421)#14 | 0.12%(+0.370)#1,657 |
| 15. | Friendsville | 0.49% | 0.069%(+0.418)#15 | 0.12%(+0.366)#1,676 |
| 16. | Algonquin | 0.47% | 0.069%(+0.405)#16 | 0.12%(+0.353)#1,713 |
| 17. | Rising Sun | 0.47% | 0.069%(+0.403)#17 | 0.12%(+0.351)#1,718 |
| 18. | St Michaels | 0.46% | 0.069%(+0.391)#18 | 0.12%(+0.339)#1,758 |
| 19. | Annapolis Neck | 0.42% | 0.069%(+0.356)#19 | 0.12%(+0.304)#1,865 |
| 20. | Buckeystown | 0.40% | 0.069%(+0.336)#20 | 0.12%(+0.284)#1,935 |
| 21. | Severn | 0.36% | 0.069%(+0.291)#21 | 0.12%(+0.239)#2,119 |
| 22. | Scaggsville | 0.32% | 0.069%(+0.255)#22 | 0.12%(+0.204)#2,276 |
| 23. | Frederick | 0.30% | 0.069%(+0.228)#23 | 0.12%(+0.177)#2,416 |
| 24. | Fruitland | 0.29% | 0.069%(+0.217)#24 | 0.12%(+0.165)#2,479 |
| 25. | Joppatowne | 0.28% | 0.069%(+0.215)#25 | 0.12%(+0.163)#2,488 |
| 26. | Green Valley | 0.28% | 0.069%(+0.209)#26 | 0.12%(+0.157)#2,525 |
| 27. | Hampstead | 0.27% | 0.069%(+0.202)#27 | 0.12%(+0.150)#2,574 |
| 28. | Deale | 0.25% | 0.069%(+0.186)#28 | 0.12%(+0.134)#2,691 |
| 29. | Damascus | 0.25% | 0.069%(+0.181)#29 | 0.12%(+0.129)#2,717 |
| 30. | Westminster | 0.25% | 0.069%(+0.180)#30 | 0.12%(+0.128)#2,722 |
| 31. | Bethesda | 0.25% | 0.069%(+0.177)#31 | 0.12%(+0.125)#2,746 |
| 32. | Havre De Grace | 0.24% | 0.069%(+0.175)#32 | 0.12%(+0.124)#2,765 |
| 33. | Darnestown | 0.24% | 0.069%(+0.171)#33 | 0.12%(+0.119)#2,800 |
| 34. | North Laurel | 0.23% | 0.069%(+0.161)#34 | 0.12%(+0.109)#2,892 |
| 35. | Kensington | 0.22% | 0.069%(+0.154)#35 | 0.12%(+0.102)#2,937 |
| 36. | Parole | 0.22% | 0.069%(+0.147)#36 | 0.12%(+0.095)#3,003 |
| 37. | Pleasant Hills | 0.20% | 0.069%(+0.135)#37 | 0.12%(+0.083)#3,100 |
| 38. | Redland | 0.20% | 0.069%(+0.133)#38 | 0.12%(+0.081)#3,119 |
| 39. | Lake Shore | 0.20% | 0.069%(+0.133)#39 | 0.12%(+0.081)#3,121 |
| 40. | Bel Air South | 0.19% | 0.069%(+0.126)#40 | 0.12%(+0.074)#3,188 |
| 41. | University Park | 0.19% | 0.069%(+0.123)#41 | 0.12%(+0.071)#3,208 |
| 42. | Fairland | 0.19% | 0.069%(+0.120)#42 | 0.12%(+0.068)#3,236 |
| 43. | North Bethesda | 0.18% | 0.069%(+0.116)#43 | 0.12%(+0.064)#3,267 |
| 44. | Taneytown | 0.18% | 0.069%(+0.111)#44 | 0.12%(+0.059)#3,317 |
| 45. | Chevy Chase View | 0.18% | 0.069%(+0.109)#45 | 0.12%(+0.057)#3,336 |
| 46. | Walkersville | 0.18% | 0.069%(+0.107)#46 | 0.12%(+0.056)#3,365 |
| 47. | Mount Rainier | 0.17% | 0.069%(+0.101)#47 | 0.12%(+0.049)#3,448 |
| 48. | Edgewood | 0.17% | 0.069%(+0.098)#48 | 0.12%(+0.047)#3,470 |
| 49. | Mount Airy | 0.17% | 0.069%(+0.097)#49 | 0.12%(+0.045)#3,486 |
| 50. | Pikesville | 0.16% | 0.069%(+0.090)#50 | 0.12%(+0.038)#3,551 |
| 51. | Colesville | 0.15% | 0.069%(+0.084)#51 | 0.12%(+0.033)#3,605 |
| 52. | Bel Air | 0.15% | 0.069%(+0.082)#52 | 0.12%(+0.030)#3,630 |
| 53. | Salisbury | 0.14% | 0.069%(+0.071)#53 | 0.12%(+0.019)#3,754 |
| 54. | Lutherville | 0.14% | 0.069%(+0.068)#54 | 0.12%(+0.016)#3,789 |
| 55. | Mayo | 0.13% | 0.069%(+0.064)#55 | 0.12%(+0.013)#3,825 |
| 56. | Ellicott City | 0.12% | 0.069%(+0.055)#56 | 0.12%(+0.003)#3,941 |
| 57. | Thurmont | 0.11% | 0.069%(+0.042)#57 | 0.12%(-0.010)#4,084 |
| 58. | Silver Spring | 0.11% | 0.069%(+0.039)#58 | 0.12%(-0.013)#4,136 |
| 59. | Annapolis | 0.11% | 0.069%(+0.037)#59 | 0.12%(-0.015)#4,165 |
| 60. | Arnold | 0.10% | 0.069%(+0.036)#60 | 0.12%(-0.016)#4,176 |
| 61. | East Riverdale | 0.100% | 0.069%(+0.031)#61 | 0.12%(-0.021)#4,242 |
| 62. | Chillum | 0.097% | 0.069%(+0.029)#62 | 0.12%(-0.023)#4,267 |
| 63. | Reisterstown | 0.094% | 0.069%(+0.025)#63 | 0.12%(-0.026)#4,309 |
| 64. | Timonium | 0.093% | 0.069%(+0.024)#64 | 0.12%(-0.028)#4,326 |
| 65. | Berwyn Heights | 0.091% | 0.069%(+0.022)#65 | 0.12%(-0.030)#4,361 |
| 66. | Eldersburg | 0.089% | 0.069%(+0.020)#66 | 0.12%(-0.032)#4,381 |
| 67. | Elkton | 0.082% | 0.069%(+0.013)#67 | 0.12%(-0.039)#4,461 |
| 68. | Chevy Chase | 0.082% | 0.069%(+0.013)#68 | 0.12%(-0.039)#4,465 |
| 69. | Kemp Mill | 0.078% | 0.069%(+0.009)#69 | 0.12%(-0.043)#4,511 |
| 70. | La Plata | 0.078% | 0.069%(+0.009)#70 | 0.12%(-0.043)#4,515 |
| 71. | Four Corners | 0.077% | 0.069%(+0.008)#71 | 0.12%(-0.043)#4,529 |
| 72. | Wheaton | 0.076% | 0.069%(+0.007)#72 | 0.12%(-0.045)#4,551 |
| 73. | Elkridge | 0.075% | 0.069%(+0.006)#73 | 0.12%(-0.045)#4,561 |
| 74. | Cumberland | 0.074% | 0.069%(+0.005)#74 | 0.12%(-0.047)#4,580 |
| 75. | Montgomery Village | 0.072% | 0.069%(+0.003)#75 | 0.12%(-0.049)#4,609 |
| 76. | Adelphi | 0.071% | 0.069%(+0.002)#76 | 0.12%(-0.050)#4,627 |
| 77. | Columbia | 0.064% | 0.069%(-0.005)#77 | 0.12%(-0.057)#4,727 |
| 78. | Severna Park | 0.062% | 0.069%(-0.007)#78 | 0.12%(-0.059)#4,753 |
| 79. | Cloverly | 0.061% | 0.069%(-0.008)#79 | 0.12%(-0.060)#4,763 |
| 80. | Aspen Hill | 0.061% | 0.069%(-0.008)#80 | 0.12%(-0.060)#4,764 |
| 81. | Randallstown | 0.061% | 0.069%(-0.008)#81 | 0.12%(-0.060)#4,767 |
| 82. | Rockville | 0.054% | 0.069%(-0.015)#82 | 0.12%(-0.067)#4,869 |
| 83. | Odenton | 0.049% | 0.069%(-0.020)#83 | 0.12%(-0.072)#4,934 |
| 84. | Bel Air North | 0.048% | 0.069%(-0.021)#84 | 0.12%(-0.073)#4,948 |
| 85. | College Park | 0.044% | 0.069%(-0.025)#85 | 0.12%(-0.077)#5,000 |
| 86. | Pasadena | 0.040% | 0.069%(-0.028)#86 | 0.12%(-0.080)#5,044 |
| 87. | Bowie | 0.038% | 0.069%(-0.031)#87 | 0.12%(-0.083)#5,072 |
| 88. | Ilchester | 0.037% | 0.069%(-0.032)#88 | 0.12%(-0.084)#5,093 |
| 89. | Olney | 0.037% | 0.069%(-0.032)#89 | 0.12%(-0.084)#5,096 |
| 90. | Middle River | 0.035% | 0.069%(-0.034)#90 | 0.12%(-0.085)#5,110 |
| 91. | Baltimore | 0.035% | 0.069%(-0.034)#91 | 0.12%(-0.086)#5,116 |
| 92. | Hagerstown | 0.032% | 0.069%(-0.037)#92 | 0.12%(-0.088)#5,154 |
| 93. | Dundalk | 0.029% | 0.069%(-0.040)#93 | 0.12%(-0.092)#5,206 |
| 94. | Clinton | 0.025% | 0.069%(-0.044)#94 | 0.12%(-0.096)#5,248 |
| 95. | North Potomac | 0.024% | 0.069%(-0.045)#95 | 0.12%(-0.096)#5,256 |
| 96. | Woodlawn Cdp Baltimore County | 0.024% | 0.069%(-0.045)#96 | 0.12%(-0.097)#5,265 |
| 97. | Carney | 0.020% | 0.069%(-0.048)#97 | 0.12%(-0.100)#5,308 |
| 98. | Waldorf | 0.020% | 0.069%(-0.049)#98 | 0.12%(-0.101)#5,320 |
| 99. | Potomac | 0.015% | 0.069%(-0.054)#99 | 0.12%(-0.106)#5,374 |
| 100. | Ocean City | 0.015% | 0.069%(-0.054)#100 | 0.12%(-0.106)#5,380 |
Common Questions
What are the Top 10 Cities with the Highest Percentage of Croatian Population in Maryland?
Top 10 Cities with the Highest Percentage of Croatian Population in Maryland are:
#1
6.12%
#2
3.46%
#3
3.29%
#4
1.76%
#5
0.97%
#6
0.86%
#7
0.80%
#8
0.74%
#9
0.73%
#10
0.71%
What city has the Highest Percentage of Croatian Population in Maryland?
Mount Lena has the Highest Percentage of Croatian Population in Maryland with 6.12%.
What is the Percentage of Croatian Population in the State of Maryland?
Percentage of Croatian Population in Maryland is 0.069%.
What is the Percentage of Croatian Population in the United States?
Percentage of Croatian Population in the United States is 0.12%.