Cities with the Highest Percentage of Immigrants from Western Europe in Maryland
RELATED REPORTS & OPTIONS
Western Europe
Maryland
Compare Cities
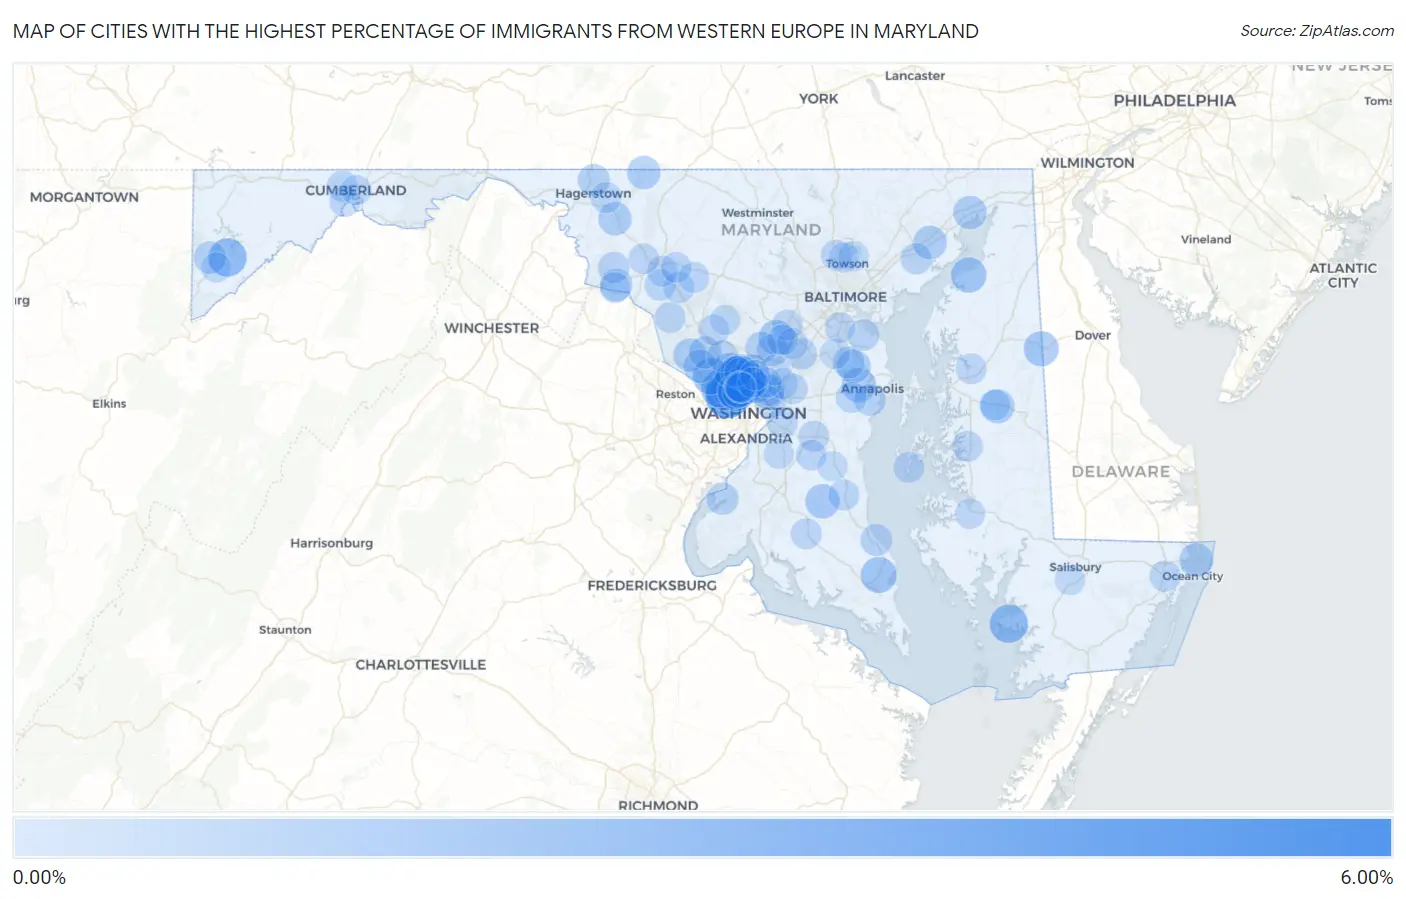
Map of Cities with the Highest Percentage of Immigrants from Western Europe in Maryland
0.00%
6.00%
Cities with the Highest Percentage of Immigrants from Western Europe in Maryland
| City | Western Europe | vs State | vs National | |
| 1. | North Chevy Chase | 5.29% | 0.32%(+4.97)#1 | 0.28%(+5.01)#114 |
| 2. | Brookmont | 3.78% | 0.32%(+3.46)#2 | 0.28%(+3.50)#180 |
| 3. | Glen Echo | 2.48% | 0.32%(+2.16)#3 | 0.28%(+2.20)#353 |
| 4. | Chevy Chase | 2.41% | 0.32%(+2.09)#4 | 0.28%(+2.13)#371 |
| 5. | Deer Park | 2.37% | 0.32%(+2.06)#5 | 0.28%(+2.09)#386 |
| 6. | Dames Quarter | 2.36% | 0.32%(+2.04)#6 | 0.28%(+2.08)#388 |
| 7. | Bethesda | 2.23% | 0.32%(+1.91)#7 | 0.28%(+1.95)#432 |
| 8. | Cabin John | 2.19% | 0.32%(+1.87)#8 | 0.28%(+1.91)#444 |
| 9. | Potomac | 2.03% | 0.32%(+1.72)#9 | 0.28%(+1.76)#501 |
| 10. | Friendship Heights Village | 2.02% | 0.32%(+1.70)#10 | 0.28%(+1.74)#509 |
| 11. | Solomons | 1.78% | 0.32%(+1.47)#11 | 0.28%(+1.50)#614 |
| 12. | Somerset | 1.65% | 0.32%(+1.34)#12 | 0.28%(+1.37)#684 |
| 13. | Betterton | 1.65% | 0.32%(+1.33)#13 | 0.28%(+1.37)#685 |
| 14. | Fulton | 1.58% | 0.32%(+1.26)#14 | 0.28%(+1.30)#740 |
| 15. | Marydel | 1.55% | 0.32%(+1.23)#15 | 0.28%(+1.27)#761 |
| 16. | Aquasco | 1.43% | 0.32%(+1.11)#16 | 0.28%(+1.15)#851 |
| 17. | Parole | 1.39% | 0.32%(+1.07)#17 | 0.28%(+1.11)#889 |
| 18. | North Bethesda | 1.38% | 0.32%(+1.06)#18 | 0.28%(+1.10)#891 |
| 19. | Hillsboro | 1.34% | 0.32%(+1.02)#19 | 0.28%(+1.06)#933 |
| 20. | Ocean City | 1.24% | 0.32%(+0.917)#20 | 0.28%(+0.956)#1,048 |
| 21. | Riverside | 1.23% | 0.32%(+0.914)#21 | 0.28%(+0.953)#1,054 |
| 22. | Herald Harbor | 1.23% | 0.32%(+0.909)#22 | 0.28%(+0.947)#1,059 |
| 23. | Darnestown | 1.18% | 0.32%(+0.866)#23 | 0.28%(+0.905)#1,114 |
| 24. | Perryville | 1.18% | 0.32%(+0.864)#24 | 0.28%(+0.903)#1,120 |
| 25. | Mount Lena | 1.17% | 0.32%(+0.848)#25 | 0.28%(+0.887)#1,151 |
| 26. | Highfield Cascade | 1.16% | 0.32%(+0.846)#26 | 0.28%(+0.885)#1,152 |
| 27. | Travilah | 1.15% | 0.32%(+0.834)#27 | 0.28%(+0.873)#1,174 |
| 28. | Chevy Chase Village | 1.01% | 0.32%(+0.690)#28 | 0.28%(+0.729)#1,414 |
| 29. | Rosemont | 1.01% | 0.32%(+0.689)#29 | 0.28%(+0.727)#1,416 |
| 30. | North Potomac | 0.96% | 0.32%(+0.638)#30 | 0.28%(+0.677)#1,518 |
| 31. | Hyattsville | 0.91% | 0.32%(+0.593)#31 | 0.28%(+0.632)#1,625 |
| 32. | Oakland | 0.90% | 0.32%(+0.584)#32 | 0.28%(+0.623)#1,652 |
| 33. | Indian Head | 0.86% | 0.32%(+0.547)#33 | 0.28%(+0.586)#1,754 |
| 34. | Fountainhead Orchard Hills | 0.86% | 0.32%(+0.537)#34 | 0.28%(+0.576)#1,775 |
| 35. | Forest Glen | 0.83% | 0.32%(+0.513)#35 | 0.28%(+0.552)#1,835 |
| 36. | Burtonsville | 0.81% | 0.32%(+0.496)#36 | 0.28%(+0.535)#1,879 |
| 37. | Arden On The Severn | 0.81% | 0.32%(+0.489)#37 | 0.28%(+0.528)#1,903 |
| 38. | Long Beach | 0.80% | 0.32%(+0.477)#38 | 0.28%(+0.516)#1,942 |
| 39. | Spencerville | 0.78% | 0.32%(+0.465)#39 | 0.28%(+0.504)#1,980 |
| 40. | Kemp Mill | 0.77% | 0.32%(+0.455)#40 | 0.28%(+0.494)#2,010 |
| 41. | University Park | 0.77% | 0.32%(+0.448)#41 | 0.28%(+0.487)#2,034 |
| 42. | Takoma Park | 0.76% | 0.32%(+0.440)#42 | 0.28%(+0.479)#2,061 |
| 43. | North Kensington | 0.76% | 0.32%(+0.437)#43 | 0.28%(+0.476)#2,069 |
| 44. | Annapolis Neck | 0.76% | 0.32%(+0.437)#44 | 0.28%(+0.476)#2,070 |
| 45. | Maryland City | 0.72% | 0.32%(+0.407)#45 | 0.28%(+0.446)#2,187 |
| 46. | Edgewood | 0.70% | 0.32%(+0.387)#46 | 0.28%(+0.425)#2,250 |
| 47. | Burkittsville | 0.70% | 0.32%(+0.381)#47 | 0.28%(+0.420)#2,264 |
| 48. | Rockville | 0.70% | 0.32%(+0.380)#48 | 0.28%(+0.419)#2,267 |
| 49. | Riviera Beach | 0.68% | 0.32%(+0.358)#49 | 0.28%(+0.397)#2,348 |
| 50. | Kensington | 0.67% | 0.32%(+0.351)#50 | 0.28%(+0.390)#2,381 |
| 51. | Buckeystown | 0.65% | 0.32%(+0.330)#51 | 0.28%(+0.369)#2,484 |
| 52. | Abingdon | 0.65% | 0.32%(+0.327)#52 | 0.28%(+0.366)#2,493 |
| 53. | Urbana | 0.64% | 0.32%(+0.325)#53 | 0.28%(+0.364)#2,506 |
| 54. | Robinwood | 0.64% | 0.32%(+0.319)#54 | 0.28%(+0.358)#2,540 |
| 55. | Berlin | 0.61% | 0.32%(+0.295)#55 | 0.28%(+0.334)#2,673 |
| 56. | Garrett Park | 0.61% | 0.32%(+0.295)#56 | 0.28%(+0.333)#2,677 |
| 57. | Tilghman Island | 0.61% | 0.32%(+0.287)#57 | 0.28%(+0.326)#2,729 |
| 58. | Monrovia | 0.60% | 0.32%(+0.286)#58 | 0.28%(+0.325)#2,736 |
| 59. | Huntingtown | 0.60% | 0.32%(+0.283)#59 | 0.28%(+0.322)#2,748 |
| 60. | La Vale | 0.60% | 0.32%(+0.279)#60 | 0.28%(+0.318)#2,765 |
| 61. | Colmar Manor | 0.59% | 0.32%(+0.275)#61 | 0.28%(+0.314)#2,776 |
| 62. | Riva | 0.59% | 0.32%(+0.267)#62 | 0.28%(+0.306)#2,819 |
| 63. | Chevy Chase Section Three | 0.58% | 0.32%(+0.267)#63 | 0.28%(+0.306)#2,827 |
| 64. | Ballenger Creek | 0.58% | 0.32%(+0.257)#64 | 0.28%(+0.296)#2,866 |
| 65. | North Laurel | 0.57% | 0.32%(+0.251)#65 | 0.28%(+0.290)#2,896 |
| 66. | Charlotte Hall | 0.57% | 0.32%(+0.249)#66 | 0.28%(+0.288)#2,912 |
| 67. | Easton | 0.57% | 0.32%(+0.248)#67 | 0.28%(+0.287)#2,914 |
| 68. | Bartonsville | 0.55% | 0.32%(+0.230)#68 | 0.28%(+0.269)#3,015 |
| 69. | Montgomery Village | 0.54% | 0.32%(+0.220)#69 | 0.28%(+0.259)#3,077 |
| 70. | Barnesville | 0.54% | 0.32%(+0.219)#70 | 0.28%(+0.258)#3,083 |
| 71. | Columbia | 0.53% | 0.32%(+0.216)#71 | 0.28%(+0.254)#3,102 |
| 72. | Centreville | 0.53% | 0.32%(+0.214)#72 | 0.28%(+0.253)#3,113 |
| 73. | Greenbelt | 0.53% | 0.32%(+0.213)#73 | 0.28%(+0.252)#3,119 |
| 74. | Upper Marlboro | 0.53% | 0.32%(+0.209)#74 | 0.28%(+0.248)#3,143 |
| 75. | District Heights | 0.52% | 0.32%(+0.207)#75 | 0.28%(+0.246)#3,154 |
| 76. | Mays Chapel | 0.52% | 0.32%(+0.204)#76 | 0.28%(+0.243)#3,175 |
| 77. | Brunswick | 0.51% | 0.32%(+0.196)#77 | 0.28%(+0.235)#3,222 |
| 78. | Potomac Park | 0.51% | 0.32%(+0.194)#78 | 0.28%(+0.233)#3,238 |
| 79. | Scaggsville | 0.51% | 0.32%(+0.191)#79 | 0.28%(+0.230)#3,256 |
| 80. | Queen Anne | 0.51% | 0.32%(+0.187)#80 | 0.28%(+0.226)#3,293 |
| 81. | Chevy Chase Section Five | 0.50% | 0.32%(+0.184)#81 | 0.28%(+0.223)#3,310 |
| 82. | Seabrook | 0.50% | 0.32%(+0.183)#82 | 0.28%(+0.222)#3,324 |
| 83. | Croom | 0.49% | 0.32%(+0.174)#83 | 0.28%(+0.213)#3,376 |
| 84. | Braddock Heights | 0.49% | 0.32%(+0.172)#84 | 0.28%(+0.211)#3,400 |
| 85. | Ferndale | 0.49% | 0.32%(+0.168)#85 | 0.28%(+0.207)#3,430 |
| 86. | Gambrills | 0.48% | 0.32%(+0.164)#86 | 0.28%(+0.203)#3,455 |
| 87. | Beltsville | 0.46% | 0.32%(+0.144)#87 | 0.28%(+0.183)#3,602 |
| 88. | Adelphi | 0.45% | 0.32%(+0.136)#88 | 0.28%(+0.175)#3,654 |
| 89. | Four Corners | 0.44% | 0.32%(+0.120)#89 | 0.28%(+0.159)#3,787 |
| 90. | Loch Lynn Heights | 0.42% | 0.32%(+0.102)#90 | 0.28%(+0.141)#3,923 |
| 91. | Silver Spring | 0.42% | 0.32%(+0.099)#91 | 0.28%(+0.138)#3,956 |
| 92. | Cumberland | 0.41% | 0.32%(+0.097)#92 | 0.28%(+0.136)#3,973 |
| 93. | Hampton | 0.41% | 0.32%(+0.095)#93 | 0.28%(+0.134)#3,986 |
| 94. | Clinton | 0.41% | 0.32%(+0.094)#94 | 0.28%(+0.133)#3,991 |
| 95. | Fruitland | 0.41% | 0.32%(+0.092)#95 | 0.28%(+0.131)#4,014 |
| 96. | Lutherville | 0.41% | 0.32%(+0.091)#96 | 0.28%(+0.130)#4,023 |
| 97. | Laytonsville | 0.41% | 0.32%(+0.089)#97 | 0.28%(+0.128)#4,042 |
| 98. | Cambridge | 0.41% | 0.32%(+0.088)#98 | 0.28%(+0.127)#4,066 |
| 99. | Martin S Additions | 0.40% | 0.32%(+0.085)#99 | 0.28%(+0.124)#4,094 |
| 100. | Dunkirk | 0.40% | 0.32%(+0.077)#100 | 0.28%(+0.116)#4,166 |
Common Questions
What are the Top 10 Cities with the Highest Percentage of Immigrants from Western Europe in Maryland?
Top 10 Cities with the Highest Percentage of Immigrants from Western Europe in Maryland are:
#1
5.29%
#2
3.78%
#3
2.48%
#4
2.41%
#5
2.37%
#6
2.36%
#7
2.23%
#8
2.19%
#9
2.03%
#10
2.02%
What city has the Highest Percentage of Immigrants from Western Europe in Maryland?
North Chevy Chase has the Highest Percentage of Immigrants from Western Europe in Maryland with 5.29%.
What is the Percentage of Immigrants from Western Europe in the State of Maryland?
Percentage of Immigrants from Western Europe in Maryland is 0.32%.
What is the Percentage of Immigrants from Western Europe in the United States?
Percentage of Immigrants from Western Europe in the United States is 0.28%.