Cities with the Highest Percentage of Panamanian Population in Maryland
RELATED REPORTS & OPTIONS
Panamanian
Maryland
Compare Cities
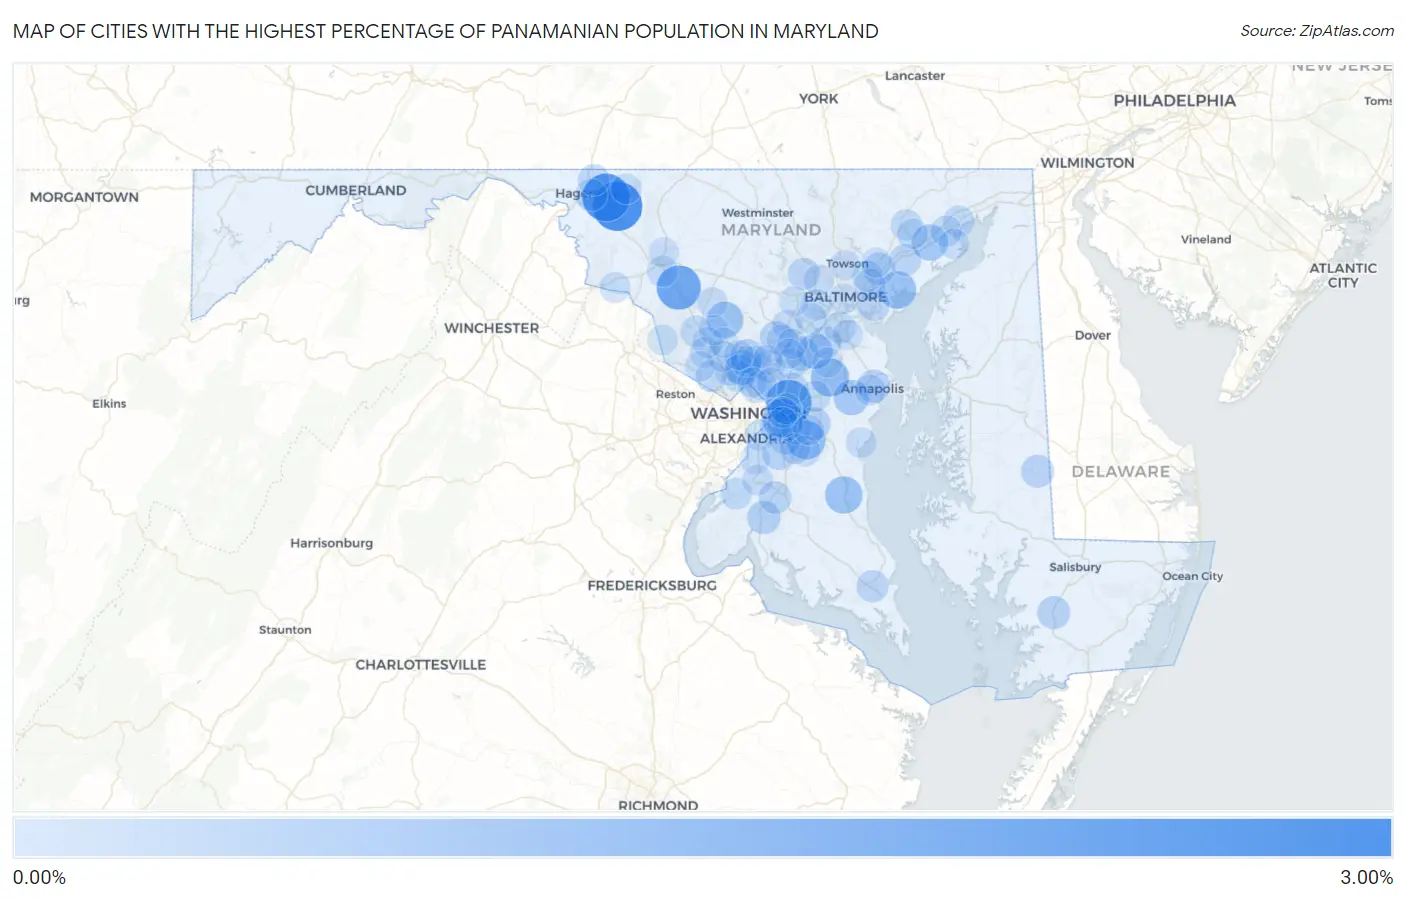
Map of Cities with the Highest Percentage of Panamanian Population in Maryland
0.00%
3.00%
Cities with the Highest Percentage of Panamanian Population in Maryland
| City | Panamanian | vs State | vs National | |
| 1. | Mount Aetna | 2.93% | 0.11%(+2.82)#1 | 0.068%(+2.86)#44 |
| 2. | Robinwood | 2.66% | 0.11%(+2.55)#2 | 0.068%(+2.59)#51 |
| 3. | Glenarden | 2.30% | 0.11%(+2.19)#3 | 0.068%(+2.24)#62 |
| 4. | Urbana | 2.10% | 0.11%(+1.99)#4 | 0.068%(+2.03)#68 |
| 5. | Walker Mill | 1.49% | 0.11%(+1.38)#5 | 0.068%(+1.43)#111 |
| 6. | Queensland | 1.28% | 0.11%(+1.17)#6 | 0.068%(+1.21)#136 |
| 7. | Crofton | 1.21% | 0.11%(+1.10)#7 | 0.068%(+1.14)#144 |
| 8. | Bowleys Quarters | 1.10% | 0.11%(+0.985)#8 | 0.068%(+1.03)#167 |
| 9. | Huntingtown | 1.06% | 0.11%(+0.950)#9 | 0.068%(+0.993)#176 |
| 10. | Laytonsville | 0.95% | 0.11%(+0.840)#10 | 0.068%(+0.883)#199 |
| 11. | Riverside | 0.89% | 0.11%(+0.783)#11 | 0.068%(+0.827)#217 |
| 12. | Fort Meade | 0.80% | 0.11%(+0.688)#12 | 0.068%(+0.731)#259 |
| 13. | Woodlawn Cdp Prince George S County | 0.80% | 0.11%(+0.687)#13 | 0.068%(+0.731)#260 |
| 14. | Riva | 0.79% | 0.11%(+0.683)#14 | 0.068%(+0.727)#264 |
| 15. | Wheaton | 0.63% | 0.11%(+0.516)#15 | 0.068%(+0.559)#336 |
| 16. | Maryland City | 0.63% | 0.11%(+0.515)#16 | 0.068%(+0.559)#337 |
| 17. | Layhill | 0.58% | 0.11%(+0.470)#17 | 0.068%(+0.514)#366 |
| 18. | La Plata | 0.50% | 0.11%(+0.384)#18 | 0.068%(+0.428)#437 |
| 19. | Brock Hall | 0.49% | 0.11%(+0.375)#19 | 0.068%(+0.419)#444 |
| 20. | Naval Academy | 0.45% | 0.11%(+0.335)#20 | 0.068%(+0.379)#482 |
| 21. | Fulton | 0.44% | 0.11%(+0.330)#21 | 0.068%(+0.374)#490 |
| 22. | Princess Anne | 0.44% | 0.11%(+0.325)#22 | 0.068%(+0.368)#501 |
| 23. | Federalsburg | 0.43% | 0.11%(+0.314)#23 | 0.068%(+0.358)#521 |
| 24. | Clinton | 0.40% | 0.11%(+0.284)#24 | 0.068%(+0.328)#553 |
| 25. | Waldorf | 0.38% | 0.11%(+0.265)#25 | 0.068%(+0.308)#576 |
| 26. | White Marsh | 0.36% | 0.11%(+0.246)#26 | 0.068%(+0.290)#600 |
| 27. | Calverton | 0.33% | 0.11%(+0.216)#27 | 0.068%(+0.260)#647 |
| 28. | Andrews Afb | 0.32% | 0.11%(+0.211)#28 | 0.068%(+0.255)#650 |
| 29. | Joppatowne | 0.32% | 0.11%(+0.210)#29 | 0.068%(+0.253)#651 |
| 30. | California | 0.32% | 0.11%(+0.204)#30 | 0.068%(+0.248)#668 |
| 31. | Hagerstown | 0.31% | 0.11%(+0.200)#31 | 0.068%(+0.243)#674 |
| 32. | Dundalk | 0.30% | 0.11%(+0.189)#32 | 0.068%(+0.232)#701 |
| 33. | Randallstown | 0.29% | 0.11%(+0.181)#33 | 0.068%(+0.225)#712 |
| 34. | Seabrook | 0.29% | 0.11%(+0.178)#34 | 0.068%(+0.221)#722 |
| 35. | Severn | 0.28% | 0.11%(+0.172)#35 | 0.068%(+0.216)#735 |
| 36. | Ferndale | 0.28% | 0.11%(+0.170)#36 | 0.068%(+0.214)#740 |
| 37. | Rosedale | 0.24% | 0.11%(+0.133)#37 | 0.068%(+0.177)#818 |
| 38. | Fountainhead Orchard Hills | 0.24% | 0.11%(+0.130)#38 | 0.068%(+0.174)#824 |
| 39. | Germantown | 0.23% | 0.11%(+0.122)#39 | 0.068%(+0.166)#840 |
| 40. | South Kensington | 0.23% | 0.11%(+0.115)#40 | 0.068%(+0.159)#863 |
| 41. | Bowie | 0.23% | 0.11%(+0.115)#41 | 0.068%(+0.158)#866 |
| 42. | North Bethesda | 0.22% | 0.11%(+0.110)#42 | 0.068%(+0.153)#883 |
| 43. | Havre De Grace | 0.22% | 0.11%(+0.106)#43 | 0.068%(+0.149)#897 |
| 44. | Bryans Road | 0.21% | 0.11%(+0.098)#44 | 0.068%(+0.142)#922 |
| 45. | Takoma Park | 0.21% | 0.11%(+0.094)#45 | 0.068%(+0.137)#937 |
| 46. | Ilchester | 0.21% | 0.11%(+0.094)#46 | 0.068%(+0.137)#938 |
| 47. | Bel Air | 0.20% | 0.11%(+0.086)#47 | 0.068%(+0.130)#967 |
| 48. | Scaggsville | 0.19% | 0.11%(+0.074)#48 | 0.068%(+0.118)#1,011 |
| 49. | Catonsville | 0.18% | 0.11%(+0.071)#49 | 0.068%(+0.115)#1,029 |
| 50. | North Kensington | 0.18% | 0.11%(+0.065)#50 | 0.068%(+0.109)#1,054 |
| 51. | Ballenger Creek | 0.18% | 0.11%(+0.065)#51 | 0.068%(+0.109)#1,057 |
| 52. | Aberdeen | 0.18% | 0.11%(+0.065)#52 | 0.068%(+0.109)#1,059 |
| 53. | Glassmanor | 0.17% | 0.11%(+0.061)#53 | 0.068%(+0.105)#1,075 |
| 54. | Colesville | 0.17% | 0.11%(+0.056)#54 | 0.068%(+0.100)#1,099 |
| 55. | Potomac | 0.17% | 0.11%(+0.056)#55 | 0.068%(+0.100)#1,101 |
| 56. | Forestville | 0.17% | 0.11%(+0.054)#56 | 0.068%(+0.097)#1,108 |
| 57. | Overlea | 0.16% | 0.11%(+0.053)#57 | 0.068%(+0.096)#1,114 |
| 58. | Glenmont | 0.16% | 0.11%(+0.051)#58 | 0.068%(+0.095)#1,124 |
| 59. | South Laurel | 0.15% | 0.11%(+0.036)#59 | 0.068%(+0.080)#1,176 |
| 60. | Westphalia | 0.14% | 0.11%(+0.031)#60 | 0.068%(+0.074)#1,195 |
| 61. | Brunswick | 0.14% | 0.11%(+0.030)#61 | 0.068%(+0.074)#1,197 |
| 62. | Suitland | 0.14% | 0.11%(+0.028)#62 | 0.068%(+0.072)#1,205 |
| 63. | Fort Washington | 0.14% | 0.11%(+0.024)#63 | 0.068%(+0.068)#1,227 |
| 64. | Accokeek | 0.13% | 0.11%(+0.022)#64 | 0.068%(+0.066)#1,239 |
| 65. | North Potomac | 0.13% | 0.11%(+0.018)#65 | 0.068%(+0.062)#1,263 |
| 66. | Rockville | 0.13% | 0.11%(+0.018)#66 | 0.068%(+0.062)#1,264 |
| 67. | Columbia | 0.13% | 0.11%(+0.018)#67 | 0.068%(+0.062)#1,267 |
| 68. | Summerfield | 0.13% | 0.11%(+0.014)#68 | 0.068%(+0.058)#1,295 |
| 69. | Annapolis | 0.13% | 0.11%(+0.014)#69 | 0.068%(+0.057)#1,296 |
| 70. | Langley Park | 0.12% | 0.11%(+0.012)#70 | 0.068%(+0.056)#1,301 |
| 71. | Woodlawn Cdp Baltimore County | 0.12% | 0.11%(+0.009)#71 | 0.068%(+0.053)#1,314 |
| 72. | Gaithersburg | 0.12% | 0.11%(+0.007)#72 | 0.068%(+0.051)#1,327 |
| 73. | Marlton | 0.12% | 0.11%(+0.006)#73 | 0.068%(+0.050)#1,330 |
| 74. | Bel Air South | 0.12% | 0.11%(+0.006)#74 | 0.068%(+0.050)#1,336 |
| 75. | Rosaryville | 0.12% | 0.11%(+0.005)#75 | 0.068%(+0.049)#1,341 |
| 76. | Peppermill Village | 0.11% | 0.11%(-0.005)#76 | 0.068%(+0.039)#1,396 |
| 77. | Poolesville | 0.11% | 0.11%(-0.006)#77 | 0.068%(+0.038)#1,400 |
| 78. | Lochearn | 0.10% | 0.11%(-0.008)#78 | 0.068%(+0.036)#1,414 |
| 79. | District Heights | 0.10% | 0.11%(-0.010)#79 | 0.068%(+0.034)#1,424 |
| 80. | Travilah | 0.10% | 0.11%(-0.010)#80 | 0.068%(+0.034)#1,426 |
| 81. | Smithsburg | 0.099% | 0.11%(-0.012)#81 | 0.068%(+0.031)#1,440 |
| 82. | Marlboro Village | 0.099% | 0.11%(-0.013)#82 | 0.068%(+0.031)#1,446 |
| 83. | Deale | 0.085% | 0.11%(-0.027)#83 | 0.068%(+0.017)#1,534 |
| 84. | Baltimore | 0.079% | 0.11%(-0.033)#84 | 0.068%(+0.011)#1,579 |
| 85. | Glen Burnie | 0.078% | 0.11%(-0.033)#85 | 0.068%(+0.011)#1,585 |
| 86. | Damascus | 0.077% | 0.11%(-0.034)#86 | 0.068%(+0.009)#1,593 |
| 87. | Aberdeen Proving Ground | 0.074% | 0.11%(-0.038)#87 | 0.068%(+0.006)#1,622 |
| 88. | Frederick | 0.073% | 0.11%(-0.039)#88 | 0.068%(+0.005)#1,634 |
| 89. | Fairland | 0.065% | 0.11%(-0.046)#89 | 0.068%(-0.002)#1,693 |
| 90. | North Laurel | 0.057% | 0.11%(-0.054)#90 | 0.068%(-0.010)#1,767 |
| 91. | Silver Spring | 0.045% | 0.11%(-0.066)#91 | 0.068%(-0.023)#1,878 |
| 92. | Towson | 0.042% | 0.11%(-0.070)#92 | 0.068%(-0.026)#1,920 |
| 93. | Laurel | 0.041% | 0.11%(-0.071)#93 | 0.068%(-0.027)#1,936 |
| 94. | Odenton | 0.038% | 0.11%(-0.074)#94 | 0.068%(-0.030)#1,961 |
| 95. | Montgomery Village | 0.037% | 0.11%(-0.074)#95 | 0.068%(-0.030)#1,966 |
| 96. | College Park | 0.032% | 0.11%(-0.080)#96 | 0.068%(-0.036)#2,030 |
| 97. | Perry Hall | 0.031% | 0.11%(-0.081)#97 | 0.068%(-0.037)#2,050 |
| 98. | Redland | 0.022% | 0.11%(-0.090)#98 | 0.068%(-0.046)#2,162 |
| 99. | Aspen Hill | 0.018% | 0.11%(-0.093)#99 | 0.068%(-0.049)#2,197 |
| 100. | Ellicott City | 0.016% | 0.11%(-0.095)#100 | 0.068%(-0.051)#2,223 |
Common Questions
What are the Top 10 Cities with the Highest Percentage of Panamanian Population in Maryland?
Top 10 Cities with the Highest Percentage of Panamanian Population in Maryland are:
#1
2.93%
#2
2.66%
#3
2.30%
#4
2.10%
#5
1.49%
#6
1.28%
#7
1.21%
#8
1.10%
#9
1.06%
#10
0.95%
What city has the Highest Percentage of Panamanian Population in Maryland?
Mount Aetna has the Highest Percentage of Panamanian Population in Maryland with 2.93%.
What is the Percentage of Panamanian Population in the State of Maryland?
Percentage of Panamanian Population in Maryland is 0.11%.
What is the Percentage of Panamanian Population in the United States?
Percentage of Panamanian Population in the United States is 0.068%.