Cities with the Most Immigrants from Afghanistan in Maryland
RELATED REPORTS & OPTIONS
Afghanistan
Maryland
Compare Cities
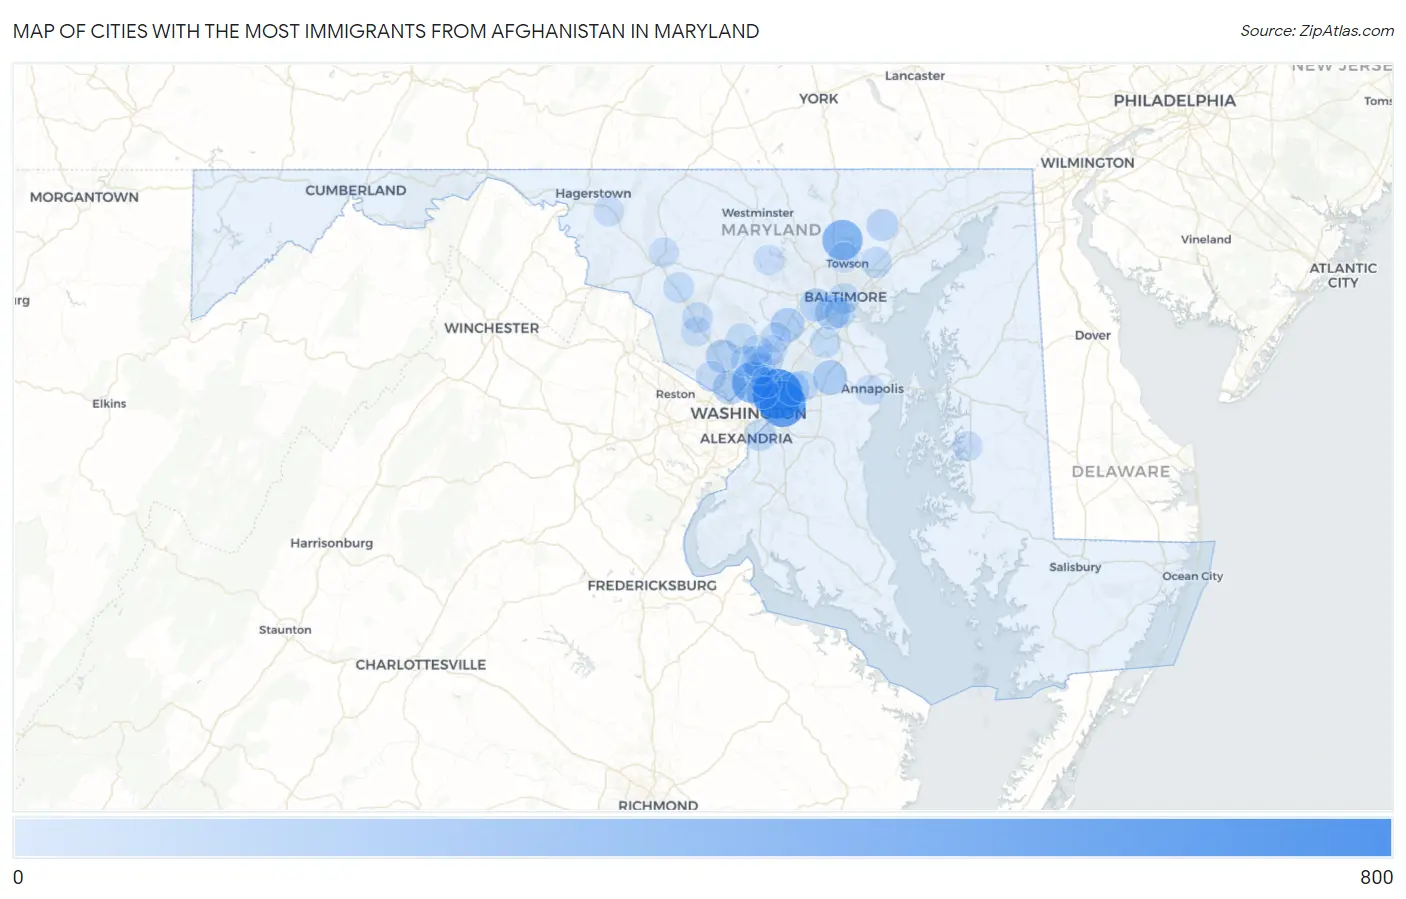
Map of Cities with the Most Immigrants from Afghanistan in Maryland
0
800
Cities with the Most Immigrants from Afghanistan in Maryland
| City | Afghanistan | vs State | vs National | |
| 1. | East Riverdale | 642 | 3,905(16.44%)#1 | 136,364(0.47%)#41 |
| 2. | Landover | 540 | 3,905(13.83%)#2 | 136,364(0.40%)#48 |
| 3. | Silver Spring | 362 | 3,905(9.27%)#3 | 136,364(0.27%)#67 |
| 4. | Cockeysville | 329 | 3,905(8.43%)#4 | 136,364(0.24%)#72 |
| 5. | Lansdowne | 146 | 3,905(3.74%)#5 | 136,364(0.11%)#186 |
| 6. | Crofton | 140 | 3,905(3.59%)#6 | 136,364(0.10%)#189 |
| 7. | Bethesda | 129 | 3,905(3.30%)#7 | 136,364(0.09%)#206 |
| 8. | Columbia | 125 | 3,905(3.20%)#8 | 136,364(0.09%)#211 |
| 9. | Seabrook | 120 | 3,905(3.07%)#9 | 136,364(0.09%)#220 |
| 10. | Rockville | 109 | 3,905(2.79%)#10 | 136,364(0.08%)#234 |
| 11. | Catonsville | 100 | 3,905(2.56%)#11 | 136,364(0.07%)#252 |
| 12. | Chillum | 92 | 3,905(2.36%)#12 | 136,364(0.07%)#268 |
| 13. | Flower Hill | 78 | 3,905(2.00%)#13 | 136,364(0.06%)#297 |
| 14. | Glassmanor | 66 | 3,905(1.69%)#14 | 136,364(0.05%)#329 |
| 15. | Fallston | 60 | 3,905(1.54%)#15 | 136,364(0.04%)#346 |
| 16. | White Oak | 49 | 3,905(1.25%)#16 | 136,364(0.04%)#389 |
| 17. | Baltimore | 45 | 3,905(1.15%)#17 | 136,364(0.03%)#406 |
| 18. | Fairland | 45 | 3,905(1.15%)#18 | 136,364(0.03%)#409 |
| 19. | Perry Hall | 41 | 3,905(1.05%)#19 | 136,364(0.03%)#429 |
| 20. | Baltimore Highlands | 39 | 3,905(1.00%)#20 | 136,364(0.03%)#443 |
| 21. | Glenn Dale | 38 | 3,905(0.97%)#21 | 136,364(0.03%)#448 |
| 22. | Severn | 37 | 3,905(0.95%)#22 | 136,364(0.03%)#452 |
| 23. | Olney | 35 | 3,905(0.90%)#23 | 136,364(0.03%)#466 |
| 24. | Glenmont | 34 | 3,905(0.87%)#24 | 136,364(0.02%)#472 |
| 25. | Urbana | 31 | 3,905(0.79%)#25 | 136,364(0.02%)#496 |
| 26. | Colesville | 28 | 3,905(0.72%)#26 | 136,364(0.02%)#521 |
| 27. | Woodlawn Cdp Baltimore County | 27 | 3,905(0.69%)#27 | 136,364(0.02%)#528 |
| 28. | Clarksburg | 23 | 3,905(0.59%)#28 | 136,364(0.02%)#557 |
| 29. | Adelphi | 19 | 3,905(0.49%)#29 | 136,364(0.01%)#590 |
| 30. | Fulton | 18 | 3,905(0.46%)#30 | 136,364(0.01%)#603 |
| 31. | Potomac | 14 | 3,905(0.36%)#31 | 136,364(0.01%)#651 |
| 32. | Lutherville | 14 | 3,905(0.36%)#32 | 136,364(0.01%)#663 |
| 33. | Eldersburg | 11 | 3,905(0.28%)#33 | 136,364(0.01%)#695 |
| 34. | Annapolis | 10 | 3,905(0.26%)#34 | 136,364(0.01%)#704 |
| 35. | Easton | 10 | 3,905(0.26%)#35 | 136,364(0.01%)#706 |
| 36. | Beaver Creek | 9 | 3,905(0.23%)#36 | 136,364(0.01%)#720 |
| 37. | Germantown | 6 | 3,905(0.15%)#37 | 136,364(0.00%)#754 |
| 38. | Frederick | 6 | 3,905(0.15%)#38 | 136,364(0.00%)#755 |
| 39. | Cloverly | 2 | 3,905(0.05%)#39 | 136,364(0.00%)#805 |
| 40. | Burtonsville | 2 | 3,905(0.05%)#40 | 136,364(0.00%)#806 |
Common Questions
What are the Top 10 Cities with the Most Immigrants from Afghanistan in Maryland?
Top 10 Cities with the Most Immigrants from Afghanistan in Maryland are:
#1
642
#2
540
#3
362
#4
329
#5
146
#6
140
#7
129
#8
125
#9
120
#10
109
What city has the Most Immigrants from Afghanistan in Maryland?
East Riverdale has the Most Immigrants from Afghanistan in Maryland with 642.
What is the Total Immigrants from Afghanistan in the State of Maryland?
Total Immigrants from Afghanistan in Maryland is 3,905.
What is the Total Immigrants from Afghanistan in the United States?
Total Immigrants from Afghanistan in the United States is 136,364.