Cities with the Most Immigrants from Colombia in Maryland
RELATED REPORTS & OPTIONS
Colombia
Maryland
Compare Cities
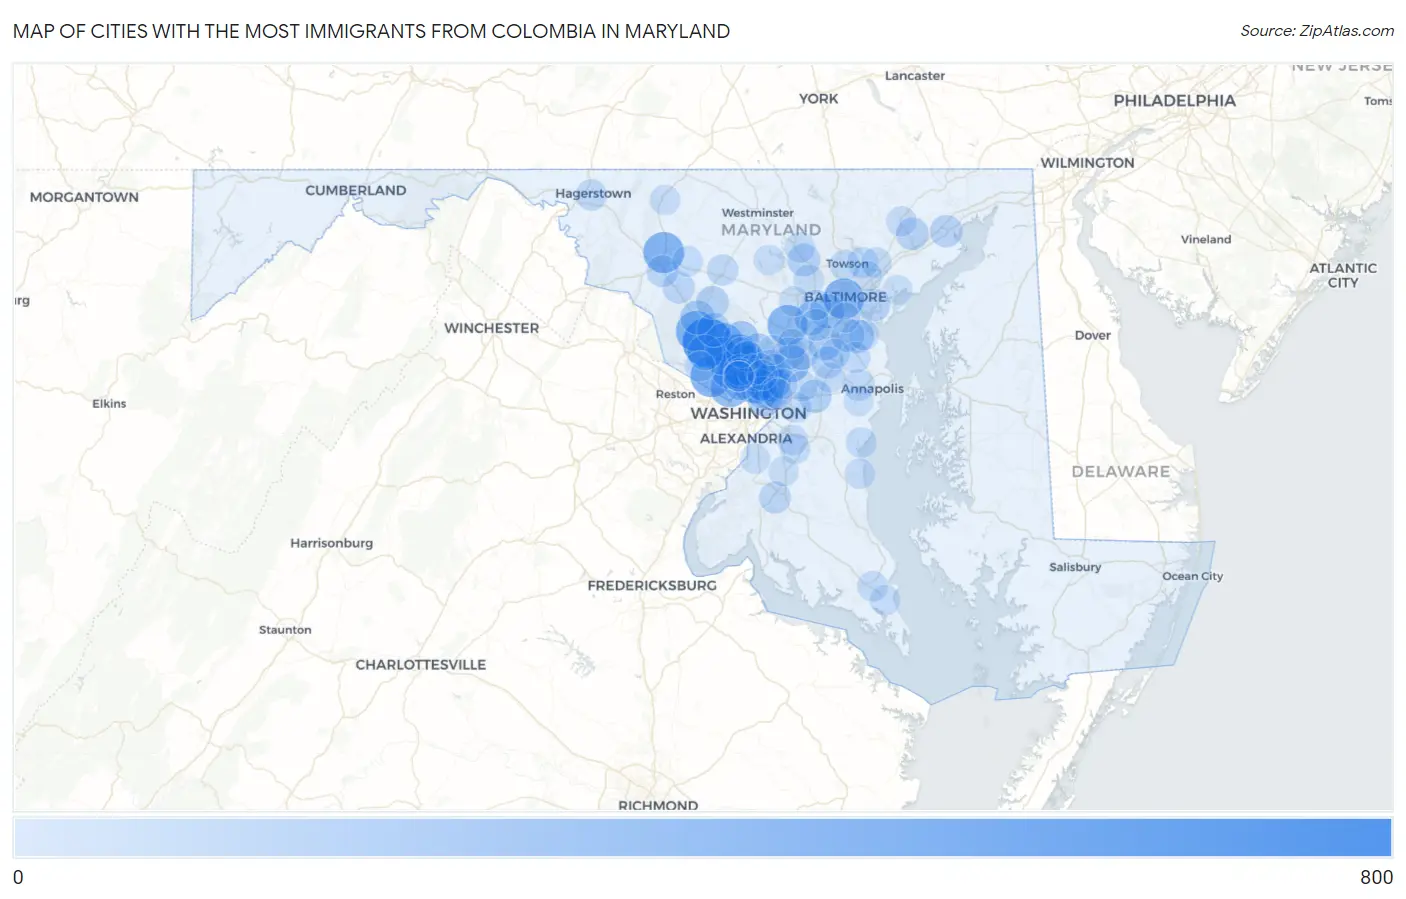
Map of Cities with the Most Immigrants from Colombia in Maryland
0
800
Cities with the Most Immigrants from Colombia in Maryland
| City | Colombia | vs State | vs National | |
| 1. | Gaithersburg | 719 | 12,898(5.57%)#1 | 860,787(0.08%)#175 |
| 2. | Wheaton | 548 | 12,898(4.25%)#2 | 860,787(0.06%)#220 |
| 3. | Aspen Hill | 420 | 12,898(3.26%)#3 | 860,787(0.05%)#278 |
| 4. | Potomac | 420 | 12,898(3.26%)#4 | 860,787(0.05%)#279 |
| 5. | Frederick | 399 | 12,898(3.09%)#5 | 860,787(0.05%)#297 |
| 6. | Germantown | 397 | 12,898(3.08%)#6 | 860,787(0.05%)#298 |
| 7. | Baltimore | 394 | 12,898(3.05%)#7 | 860,787(0.05%)#301 |
| 8. | Silver Spring | 388 | 12,898(3.01%)#8 | 860,787(0.05%)#305 |
| 9. | Columbia | 368 | 12,898(2.85%)#9 | 860,787(0.04%)#320 |
| 10. | Bethesda | 348 | 12,898(2.70%)#10 | 860,787(0.04%)#341 |
| 11. | Adelphi | 321 | 12,898(2.49%)#11 | 860,787(0.04%)#377 |
| 12. | Redland | 317 | 12,898(2.46%)#12 | 860,787(0.04%)#384 |
| 13. | Glenmont | 298 | 12,898(2.31%)#13 | 860,787(0.03%)#404 |
| 14. | College Park | 292 | 12,898(2.26%)#14 | 860,787(0.03%)#414 |
| 15. | North Bethesda | 286 | 12,898(2.22%)#15 | 860,787(0.03%)#421 |
| 16. | Rockville | 274 | 12,898(2.12%)#16 | 860,787(0.03%)#439 |
| 17. | South Laurel | 251 | 12,898(1.95%)#17 | 860,787(0.03%)#473 |
| 18. | North Potomac | 204 | 12,898(1.58%)#18 | 860,787(0.02%)#554 |
| 19. | Olney | 202 | 12,898(1.57%)#19 | 860,787(0.02%)#559 |
| 20. | Mount Rainier | 191 | 12,898(1.48%)#20 | 860,787(0.02%)#584 |
| 21. | Severn | 182 | 12,898(1.41%)#21 | 860,787(0.02%)#611 |
| 22. | Arbutus | 171 | 12,898(1.33%)#22 | 860,787(0.02%)#651 |
| 23. | Clarksburg | 160 | 12,898(1.24%)#23 | 860,787(0.02%)#687 |
| 24. | Montgomery Village | 146 | 12,898(1.13%)#24 | 860,787(0.02%)#744 |
| 25. | Pasadena | 140 | 12,898(1.09%)#25 | 860,787(0.02%)#770 |
| 26. | Ilchester | 140 | 12,898(1.09%)#26 | 860,787(0.02%)#772 |
| 27. | Glen Burnie | 136 | 12,898(1.05%)#27 | 860,787(0.02%)#792 |
| 28. | Bowie | 128 | 12,898(0.99%)#28 | 860,787(0.01%)#827 |
| 29. | Cloverly | 120 | 12,898(0.93%)#29 | 860,787(0.01%)#873 |
| 30. | Takoma Park | 114 | 12,898(0.88%)#30 | 860,787(0.01%)#905 |
| 31. | Owings Mills | 113 | 12,898(0.88%)#31 | 860,787(0.01%)#915 |
| 32. | Dundalk | 111 | 12,898(0.86%)#32 | 860,787(0.01%)#930 |
| 33. | Bel Air South | 107 | 12,898(0.83%)#33 | 860,787(0.01%)#964 |
| 34. | Damascus | 107 | 12,898(0.83%)#34 | 860,787(0.01%)#969 |
| 35. | Chevy Chase | 107 | 12,898(0.83%)#35 | 860,787(0.01%)#970 |
| 36. | Aberdeen | 99 | 12,898(0.77%)#36 | 860,787(0.01%)#1,016 |
| 37. | Calverton | 92 | 12,898(0.71%)#37 | 860,787(0.01%)#1,076 |
| 38. | Flower Hill | 92 | 12,898(0.71%)#38 | 860,787(0.01%)#1,077 |
| 39. | Laurel | 88 | 12,898(0.68%)#39 | 860,787(0.01%)#1,106 |
| 40. | Urbana | 88 | 12,898(0.68%)#40 | 860,787(0.01%)#1,110 |
| 41. | Beltsville | 86 | 12,898(0.67%)#41 | 860,787(0.01%)#1,126 |
| 42. | Maryland City | 85 | 12,898(0.66%)#42 | 860,787(0.01%)#1,133 |
| 43. | Odenton | 84 | 12,898(0.65%)#43 | 860,787(0.01%)#1,139 |
| 44. | Hyattsville | 83 | 12,898(0.64%)#44 | 860,787(0.01%)#1,157 |
| 45. | Four Corners | 81 | 12,898(0.63%)#45 | 860,787(0.01%)#1,172 |
| 46. | Ballenger Creek | 77 | 12,898(0.60%)#46 | 860,787(0.01%)#1,218 |
| 47. | Waldorf | 76 | 12,898(0.59%)#47 | 860,787(0.01%)#1,225 |
| 48. | Chillum | 71 | 12,898(0.55%)#48 | 860,787(0.01%)#1,284 |
| 49. | Elkridge | 69 | 12,898(0.53%)#49 | 860,787(0.01%)#1,307 |
| 50. | North Kensington | 66 | 12,898(0.51%)#50 | 860,787(0.01%)#1,345 |
| 51. | Parole | 64 | 12,898(0.50%)#51 | 860,787(0.01%)#1,358 |
| 52. | Hagerstown | 58 | 12,898(0.45%)#52 | 860,787(0.01%)#1,452 |
| 53. | Langley Park | 56 | 12,898(0.43%)#53 | 860,787(0.01%)#1,494 |
| 54. | Mount Airy | 54 | 12,898(0.42%)#54 | 860,787(0.01%)#1,520 |
| 55. | Kemp Mill | 50 | 12,898(0.39%)#55 | 860,787(0.01%)#1,587 |
| 56. | Severna Park | 49 | 12,898(0.38%)#56 | 860,787(0.01%)#1,605 |
| 57. | Carney | 49 | 12,898(0.38%)#57 | 860,787(0.01%)#1,607 |
| 58. | Wildewood | 45 | 12,898(0.35%)#58 | 860,787(0.01%)#1,703 |
| 59. | Linganore | 41 | 12,898(0.32%)#59 | 860,787(0.00%)#1,784 |
| 60. | Layhill | 38 | 12,898(0.29%)#60 | 860,787(0.00%)#1,855 |
| 61. | White Oak | 37 | 12,898(0.29%)#61 | 860,787(0.00%)#1,875 |
| 62. | Towson | 36 | 12,898(0.28%)#62 | 860,787(0.00%)#1,900 |
| 63. | Perry Hall | 36 | 12,898(0.28%)#63 | 860,787(0.00%)#1,906 |
| 64. | Milford Mill | 35 | 12,898(0.27%)#64 | 860,787(0.00%)#1,937 |
| 65. | Reisterstown | 34 | 12,898(0.26%)#65 | 860,787(0.00%)#1,979 |
| 66. | California | 34 | 12,898(0.26%)#66 | 860,787(0.00%)#1,988 |
| 67. | Leisure World | 34 | 12,898(0.26%)#67 | 860,787(0.00%)#1,990 |
| 68. | Green Valley | 33 | 12,898(0.26%)#68 | 860,787(0.00%)#2,026 |
| 69. | Travilah | 33 | 12,898(0.26%)#69 | 860,787(0.00%)#2,029 |
| 70. | Deale | 32 | 12,898(0.25%)#70 | 860,787(0.00%)#2,068 |
| 71. | Melwood | 31 | 12,898(0.24%)#71 | 860,787(0.00%)#2,101 |
| 72. | Lake Arbor | 30 | 12,898(0.23%)#72 | 860,787(0.00%)#2,128 |
| 73. | Glenn Dale | 29 | 12,898(0.22%)#73 | 860,787(0.00%)#2,172 |
| 74. | Honeygo | 29 | 12,898(0.22%)#74 | 860,787(0.00%)#2,176 |
| 75. | Bel Air North | 28 | 12,898(0.22%)#75 | 860,787(0.00%)#2,201 |
| 76. | Riviera Beach | 28 | 12,898(0.22%)#76 | 860,787(0.00%)#2,209 |
| 77. | Lexington Park | 27 | 12,898(0.21%)#77 | 860,787(0.00%)#2,243 |
| 78. | Kensington | 27 | 12,898(0.21%)#78 | 860,787(0.00%)#2,258 |
| 79. | Catonsville | 26 | 12,898(0.20%)#79 | 860,787(0.00%)#2,269 |
| 80. | Eldersburg | 25 | 12,898(0.19%)#80 | 860,787(0.00%)#2,309 |
| 81. | Riverdale Park | 24 | 12,898(0.19%)#81 | 860,787(0.00%)#2,361 |
| 82. | Thurmont | 24 | 12,898(0.19%)#82 | 860,787(0.00%)#2,362 |
| 83. | Fort Washington | 23 | 12,898(0.18%)#83 | 860,787(0.00%)#2,388 |
| 84. | Brooklyn Park | 22 | 12,898(0.17%)#84 | 860,787(0.00%)#2,437 |
| 85. | Rosaryville | 22 | 12,898(0.17%)#85 | 860,787(0.00%)#2,445 |
| 86. | Chesapeake Beach | 21 | 12,898(0.16%)#86 | 860,787(0.00%)#2,506 |
| 87. | South Kensington | 20 | 12,898(0.16%)#87 | 860,787(0.00%)#2,555 |
| 88. | Chevy Chase View | 20 | 12,898(0.16%)#88 | 860,787(0.00%)#2,572 |
| 89. | Greenbelt | 19 | 12,898(0.15%)#89 | 860,787(0.00%)#2,586 |
| 90. | Crofton | 18 | 12,898(0.14%)#90 | 860,787(0.00%)#2,626 |
| 91. | Ellicott City | 16 | 12,898(0.12%)#91 | 860,787(0.00%)#2,743 |
| 92. | Overlea | 16 | 12,898(0.12%)#92 | 860,787(0.00%)#2,773 |
| 93. | Edgewater | 16 | 12,898(0.12%)#93 | 860,787(0.00%)#2,784 |
| 94. | Hillandale | 16 | 12,898(0.12%)#94 | 860,787(0.00%)#2,790 |
| 95. | Gambrills | 16 | 12,898(0.12%)#95 | 860,787(0.00%)#2,799 |
| 96. | East Riverdale | 15 | 12,898(0.12%)#96 | 860,787(0.00%)#2,842 |
| 97. | Burtonsville | 15 | 12,898(0.12%)#97 | 860,787(0.00%)#2,852 |
| 98. | North Laurel | 14 | 12,898(0.11%)#98 | 860,787(0.00%)#2,904 |
| 99. | Brandywine | 14 | 12,898(0.11%)#99 | 860,787(0.00%)#2,921 |
| 100. | Bowleys Quarters | 14 | 12,898(0.11%)#100 | 860,787(0.00%)#2,932 |
Common Questions
What are the Top 10 Cities with the Most Immigrants from Colombia in Maryland?
Top 10 Cities with the Most Immigrants from Colombia in Maryland are:
#1
719
#2
548
#3
420
#4
420
#5
399
#6
397
#7
394
#8
388
#9
368
#10
348
What city has the Most Immigrants from Colombia in Maryland?
Gaithersburg has the Most Immigrants from Colombia in Maryland with 719.
What is the Total Immigrants from Colombia in the State of Maryland?
Total Immigrants from Colombia in Maryland is 12,898.
What is the Total Immigrants from Colombia in the United States?
Total Immigrants from Colombia in the United States is 860,787.