European Female Disability
COMPARE
European
Select to Compare
Female Disability
European Female Disability
12.4%
DISABILITY | FEMALES
12.1/ 100
METRIC RATING
219th/ 347
METRIC RANK
European Female Disability Correlation Chart
The statistical analysis conducted on geographies consisting of 561,578,477 people shows a moderate positive correlation between the proportion of Europeans and percentage of females with a disability in the United States with a correlation coefficient (R) of 0.488 and weighted average of 12.4%. On average, for every 1% (one percent) increase in Europeans within a typical geography, there is an increase of 0.40% in percentage of females with a disability.
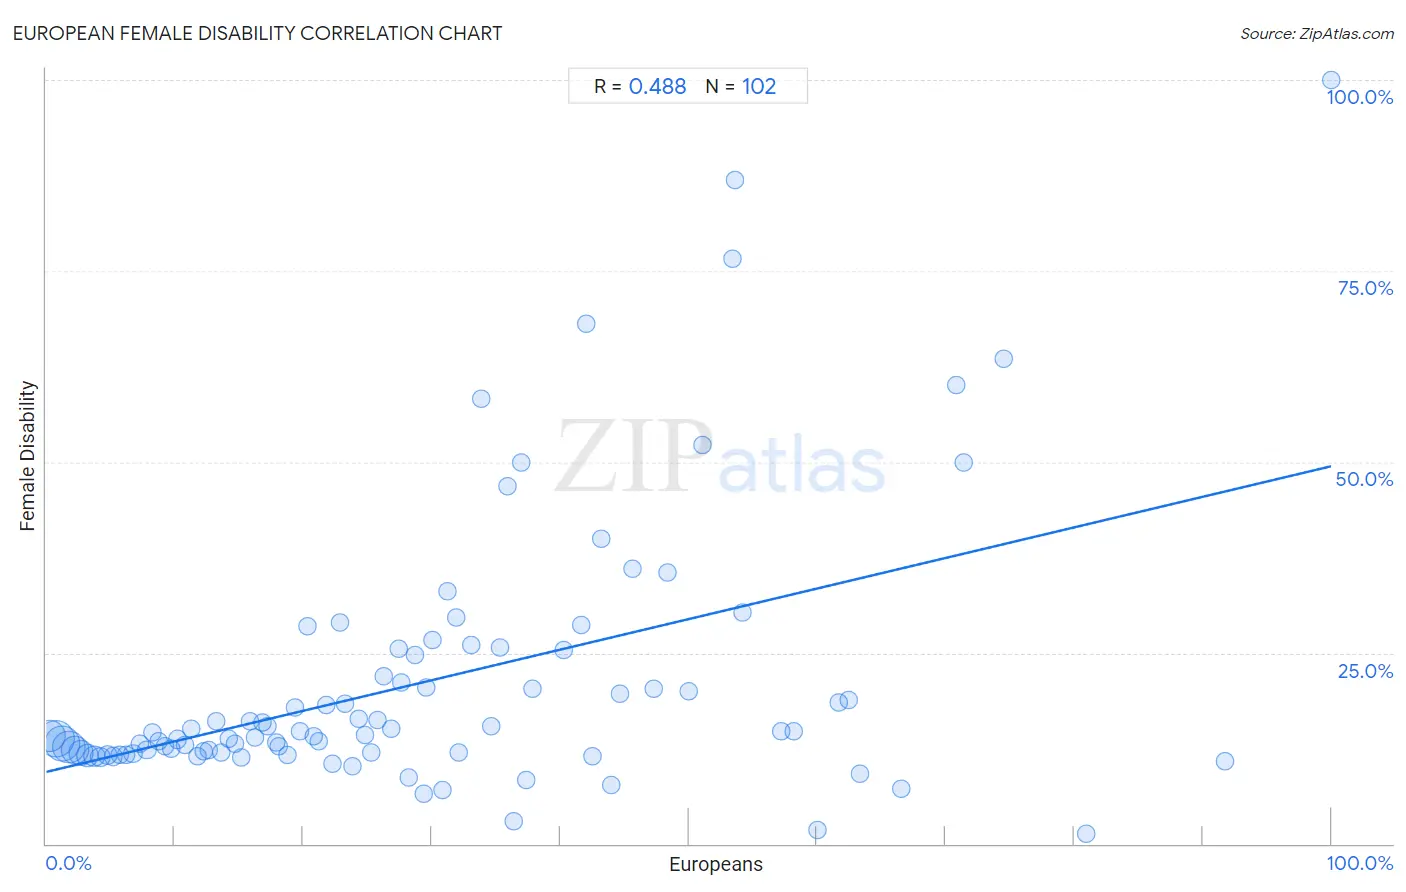
It is essential to understand that the correlation between the percentage of Europeans and percentage of females with a disability does not imply a direct cause-and-effect relationship. It remains uncertain whether the presence of Europeans influences an upward or downward trend in the level of percentage of females with a disability within an area, or if Europeans simply ended up residing in those areas with higher or lower levels of percentage of females with a disability due to other factors.
Demographics Similar to Europeans by Female Disability
In terms of female disability, the demographic groups most similar to Europeans are Immigrants from Bahamas (12.4%, a difference of 0.030%), British (12.4%, a difference of 0.050%), Bahamian (12.4%, a difference of 0.090%), Immigrants from Burma/Myanmar (12.4%, a difference of 0.10%), and Panamanian (12.4%, a difference of 0.11%).
| Demographics | Rating | Rank | Female Disability |
| Ute | 14.7 /100 | #212 | Poor 12.4% |
| Immigrants from Thailand | 14.5 /100 | #213 | Poor 12.4% |
| Panamanians | 13.5 /100 | #214 | Poor 12.4% |
| Samoans | 13.4 /100 | #215 | Poor 12.4% |
| Immigrants from Burma/Myanmar | 13.3 /100 | #216 | Poor 12.4% |
| British | 12.7 /100 | #217 | Poor 12.4% |
| Immigrants from Bahamas | 12.5 /100 | #218 | Poor 12.4% |
| Europeans | 12.1 /100 | #219 | Poor 12.4% |
| Bahamians | 11.1 /100 | #220 | Poor 12.4% |
| Native Hawaiians | 10.8 /100 | #221 | Poor 12.4% |
| Italians | 10.7 /100 | #222 | Poor 12.4% |
| Guamanians/Chamorros | 9.5 /100 | #223 | Tragic 12.5% |
| Belizeans | 9.3 /100 | #224 | Tragic 12.5% |
| Poles | 8.4 /100 | #225 | Tragic 12.5% |
| Hispanics or Latinos | 8.0 /100 | #226 | Tragic 12.5% |
European Female Disability Correlation Summary
| Measurement | European Data | Female Disability Data |
| Minimum | 0.27% | 1.3% |
| Maximum | 100.0% | 100.0% |
| Range | 99.7% | 98.8% |
| Mean | 29.4% | 21.2% |
| Median | 25.5% | 14.4% |
| Interquartile 25% (IQ1) | 12.6% | 11.9% |
| Interquartile 75% (IQ3) | 42.0% | 24.8% |
| Interquartile Range (IQR) | 29.4% | 12.9% |
| Standard Deviation (Sample) | 21.4% | 17.6% |
| Standard Deviation (Population) | 21.3% | 17.5% |
Correlation Details
| European Percentile | Sample Size | Female Disability |
[ 0.0% - 0.5% ] 0.27% | 85,153,708 | 14.2% |
[ 0.5% - 1.0% ] 0.76% | 110,452,710 | 13.8% |
[ 1.0% - 1.5% ] 1.25% | 106,139,990 | 13.1% |
[ 1.5% - 2.0% ] 1.73% | 87,064,829 | 12.7% |
[ 2.0% - 2.5% ] 2.23% | 58,743,202 | 12.2% |
[ 2.5% - 3.0% ] 2.73% | 39,777,679 | 11.9% |
[ 3.0% - 3.5% ] 3.23% | 23,616,780 | 11.6% |
[ 3.5% - 4.0% ] 3.74% | 15,610,300 | 11.5% |
[ 4.0% - 4.5% ] 4.20% | 11,505,084 | 11.4% |
[ 4.5% - 5.0% ] 4.73% | 6,879,445 | 11.6% |
[ 5.0% - 5.5% ] 5.23% | 4,982,311 | 11.4% |
[ 5.5% - 6.0% ] 5.75% | 2,580,648 | 11.6% |
[ 6.0% - 6.5% ] 6.24% | 1,995,467 | 11.6% |
[ 6.5% - 7.0% ] 6.74% | 1,755,155 | 11.8% |
[ 7.0% - 7.5% ] 7.25% | 833,734 | 13.1% |
[ 7.5% - 8.0% ] 7.82% | 871,593 | 12.2% |
[ 8.0% - 8.5% ] 8.28% | 575,937 | 14.6% |
[ 8.5% - 9.0% ] 8.76% | 404,834 | 13.4% |
[ 9.0% - 9.5% ] 9.20% | 415,692 | 12.8% |
[ 9.5% - 10.0% ] 9.72% | 494,794 | 12.4% |
[ 10.0% - 10.5% ] 10.20% | 241,348 | 13.7% |
[ 10.5% - 11.0% ] 10.78% | 136,027 | 13.0% |
[ 11.0% - 11.5% ] 11.24% | 159,161 | 15.0% |
[ 11.5% - 12.0% ] 11.81% | 115,119 | 11.5% |
[ 12.0% - 12.5% ] 12.29% | 114,344 | 12.1% |
[ 12.5% - 13.0% ] 12.64% | 140,023 | 12.3% |
[ 13.0% - 13.5% ] 13.25% | 47,767 | 16.1% |
[ 13.5% - 14.0% ] 13.66% | 174,254 | 11.9% |
[ 14.0% - 14.5% ] 14.20% | 49,108 | 13.7% |
[ 14.5% - 15.0% ] 14.66% | 94,917 | 13.0% |
[ 15.0% - 15.5% ] 15.21% | 73,174 | 11.3% |
[ 15.5% - 16.0% ] 15.82% | 74,311 | 16.1% |
[ 16.0% - 16.5% ] 16.24% | 11,950 | 13.8% |
[ 16.5% - 17.0% ] 16.83% | 46,575 | 15.9% |
[ 17.0% - 17.5% ] 17.22% | 37,425 | 15.3% |
[ 17.5% - 18.0% ] 17.87% | 41,889 | 13.2% |
[ 18.0% - 18.5% ] 18.13% | 24,723 | 12.8% |
[ 18.5% - 19.0% ] 18.80% | 13,771 | 11.6% |
[ 19.0% - 19.5% ] 19.36% | 15,874 | 17.9% |
[ 19.5% - 20.0% ] 19.77% | 7,788 | 14.7% |
[ 20.0% - 20.5% ] 20.29% | 7,286 | 28.4% |
[ 20.5% - 21.0% ] 20.78% | 6,391 | 14.0% |
[ 21.0% - 21.5% ] 21.22% | 15,909 | 13.3% |
[ 21.5% - 22.0% ] 21.77% | 12,370 | 18.2% |
[ 22.0% - 22.5% ] 22.24% | 6,115 | 10.6% |
[ 22.5% - 23.0% ] 22.83% | 3,185 | 29.0% |
[ 23.0% - 23.5% ] 23.27% | 4,074 | 18.4% |
[ 23.5% - 24.0% ] 23.85% | 1,870 | 10.2% |
[ 24.0% - 24.5% ] 24.32% | 3,717 | 16.4% |
[ 24.5% - 25.0% ] 24.83% | 600 | 14.2% |
[ 25.0% - 25.5% ] 25.33% | 7,563 | 11.9% |
[ 25.5% - 26.0% ] 25.74% | 4,172 | 16.2% |
[ 26.0% - 26.5% ] 26.26% | 693 | 22.0% |
[ 26.5% - 27.0% ] 26.82% | 1,648 | 15.1% |
[ 27.0% - 27.5% ] 27.42% | 952 | 25.5% |
[ 27.5% - 28.0% ] 27.64% | 1,230 | 21.1% |
[ 28.0% - 28.5% ] 28.16% | 3,231 | 8.6% |
[ 28.5% - 29.0% ] 28.74% | 1,952 | 24.8% |
[ 29.0% - 29.5% ] 29.35% | 920 | 6.6% |
[ 29.5% - 30.0% ] 29.56% | 1,174 | 20.5% |
[ 30.0% - 30.5% ] 30.10% | 1,216 | 26.7% |
[ 30.5% - 31.0% ] 30.81% | 2,360 | 7.0% |
[ 31.0% - 31.5% ] 31.18% | 1,408 | 33.1% |
[ 31.5% - 32.0% ] 31.90% | 116 | 29.6% |
[ 32.0% - 32.5% ] 32.14% | 809 | 12.0% |
[ 33.0% - 33.5% ] 33.10% | 423 | 26.1% |
[ 33.5% - 34.0% ] 33.85% | 65 | 58.3% |
[ 34.5% - 35.0% ] 34.65% | 3,469 | 15.4% |
[ 35.0% - 35.5% ] 35.28% | 547 | 25.7% |
[ 35.5% - 36.0% ] 35.86% | 502 | 46.8% |
[ 36.0% - 36.5% ] 36.34% | 388 | 2.9% |
[ 36.5% - 37.0% ] 36.95% | 617 | 49.8% |
[ 37.0% - 37.5% ] 37.38% | 107 | 8.3% |
[ 37.5% - 38.0% ] 37.84% | 444 | 20.3% |
[ 40.0% - 40.5% ] 40.29% | 206 | 25.4% |
[ 41.5% - 42.0% ] 41.67% | 120 | 28.6% |
[ 42.0% - 42.5% ] 42.05% | 88 | 68.1% |
[ 42.5% - 43.0% ] 42.55% | 416 | 11.4% |
[ 43.0% - 43.5% ] 43.18% | 44 | 40.0% |
[ 43.5% - 44.0% ] 43.95% | 248 | 7.6% |
[ 44.5% - 45.0% ] 44.61% | 946 | 19.7% |
[ 45.5% - 46.0% ] 45.61% | 1,002 | 35.9% |
[ 47.0% - 47.5% ] 47.31% | 465 | 20.4% |
[ 48.0% - 48.5% ] 48.35% | 242 | 35.5% |
[ 50.0% - 50.5% ] 50.00% | 116 | 20.0% |
[ 51.0% - 51.5% ] 51.04% | 96 | 52.1% |
[ 53.0% - 53.5% ] 53.44% | 131 | 76.7% |
[ 53.5% - 54.0% ] 53.57% | 112 | 86.9% |
[ 54.0% - 54.5% ] 54.19% | 179 | 30.2% |
[ 57.0% - 57.5% ] 57.19% | 612 | 14.8% |
[ 58.0% - 58.5% ] 58.21% | 67 | 14.7% |
[ 60.0% - 60.5% ] 60.00% | 725 | 1.8% |
[ 61.5% - 62.0% ] 61.67% | 621 | 18.5% |
[ 62.0% - 62.5% ] 62.41% | 141 | 18.8% |
[ 63.0% - 63.5% ] 63.37% | 101 | 9.2% |
[ 66.5% - 67.0% ] 66.53% | 236 | 7.2% |
[ 70.5% - 71.0% ] 70.83% | 24 | 60.0% |
[ 71.0% - 71.5% ] 71.43% | 7 | 50.0% |
[ 74.0% - 74.5% ] 74.47% | 94 | 63.5% |
[ 80.5% - 81.0% ] 80.89% | 246 | 1.3% |
[ 91.5% - 92.0% ] 91.71% | 205 | 10.8% |
[ 99.5% - 100.0% ] 100.00% | 24 | 100.0% |