Spaniard vs Immigrants from Indonesia Unemployment Among Women with Children Ages 6 to 17 years

COMPARE

Spaniard
Race
Ancestry
AfghanAfricanAlaska NativeAlaskan AthabascanAlbanianAleutAlsatianAmericanApacheArabArapahoArgentineanArmenianAssyrian/Chaldean/SyriacAustralianAustrianBahamianBangladeshiBarbadianBasqueBelgianBelizeanBermudanBhutaneseBlackfeetBolivianBrazilianBritishBritish West IndianBulgarianBurmeseCajunCambodianCanadianCape VerdeanCarpatho RusynCelticCentral AmericanCentral American IndianCherokeeCheyenneChickasawChileanChineseChippewaChoctawColombianColvilleComancheCosta RicanCreeCreekCroatianCrowCubanCypriotCzechCzechoslovakianDanishDelawareDominicanDutchDutch West IndianEastern EuropeanEcuadorianEgyptianEnglishEstonianEthiopianEuropeanFijianFilipinoFinnishFrenchFrench American IndianFrench CanadianGermanGerman RussianGhanaianGreekGuamanian/ChamorroGuatemalanGuyaneseHaitianHmongHonduranHopiHoumaHungarianIcelanderIndian (Asian)IndonesianInupiatIranianIraqiIrishIroquoisIsraeliItalianJamaicanJapaneseJordanianKenyanKiowaKoreanLaotianLatvianLebaneseLiberianLithuanianLumbeeLuxembourgerMacedonianMalaysianMalteseMarshalleseMenomineeMexicanMexican American IndianMongolianMoroccanNative HawaiianNavajoNepaleseNew ZealanderNicaraguanNigerianNorthern EuropeanNorwegianOkinawanOsageOttawaPaiutePakistaniPalestinianPanamanianParaguayanPennsylvania GermanPeruvianPimaPolishPortuguesePotawatomiPuebloPuerto RicanPuget Sound SalishRomanianRussianSalvadoranSamoanScandinavianScotch-IrishScottishSeminoleSenegaleseSerbianShoshoneSierra LeoneanSiouxSlavicSlovakSloveneSomaliSouth AfricanSouth AmericanSouth American IndianSoviet UnionSpaniardSpanishSpanish AmericanSpanish American IndianSri LankanSubsaharan AfricanSudaneseSwedishSwissSyrianTaiwaneseThaiTlingit-HaidaTohono O'OdhamTonganTrinidadian and TobagonianTsimshianTurkishU.S. Virgin IslanderUgandanUkrainianUruguayanUteVenezuelanVietnameseWelshWest IndianYakamaYaquiYugoslavianYumanYup'ikZimbabwean
Immigration
NonimmigrantsImmigrantsAfghanistanAfricaAlbaniaArgentinaArmeniaAsiaAustraliaAustriaBahamasBangladeshBarbadosBelarusBelgiumBelizeBoliviaBosnia and HerzegovinaBrazilBulgariaBurma/MyanmarCabo VerdeCambodiaCameroonCanadaCaribbeanCentral AmericaChileChinaColombiaCongoCosta RicaCroatiaCubaCzechoslovakiaDenmarkDominicaDominican RepublicEastern AfricaEastern AsiaEastern EuropeEcuadorEgyptEl SalvadorEnglandEritreaEthiopiaEuropeFijiFranceGermanyGhanaGreeceGrenadaGuatemalaGuyanaHaitiHondurasHong KongHungaryIndiaIranIraqIrelandIsraelItalyJamaicaJapanJordanKazakhstanKenyaKoreaKuwaitLaosLatin AmericaLatviaLebanonLiberiaLithuaniaMalaysiaMexicoMicronesiaMiddle AfricaMoldovaMoroccoNepalNetherlandsNicaraguaNigeriaNorth AmericaNorth MacedoniaNorthern AfricaNorthern EuropeNorwayOceaniaPakistanPanamaPeruPhilippinesPolandPortugalRomaniaRussiaSaudi ArabiaScotlandSenegalSerbiaSierra LeoneSingaporeSomaliaSouth AfricaSouth AmericaSouth Central AsiaSouth Eastern AsiaSouthern EuropeSpainSri LankaSt. Vincent and the GrenadinesSudanSwedenSwitzerlandSyriaTaiwanThailandTrinidad and TobagoTurkeyUgandaUkraineUruguayUzbekistanVenezuelaVietnamWest IndiesWestern AfricaWestern AsiaWestern EuropeYemenZaireZimbabweAzores
Immigrants from Indonesia
Race
Ancestry
AfghanAfricanAlaska NativeAlaskan AthabascanAlbanianAleutAlsatianAmericanApacheArabArapahoArgentineanArmenianAssyrian/Chaldean/SyriacAustralianAustrianBahamianBangladeshiBarbadianBasqueBelgianBelizeanBermudanBhutaneseBlackfeetBolivianBrazilianBritishBritish West IndianBulgarianBurmeseCajunCambodianCanadianCape VerdeanCarpatho RusynCelticCentral AmericanCentral American IndianCherokeeCheyenneChickasawChileanChineseChippewaChoctawColombianColvilleComancheCosta RicanCreeCreekCroatianCrowCubanCypriotCzechCzechoslovakianDanishDelawareDominicanDutchDutch West IndianEastern EuropeanEcuadorianEgyptianEnglishEstonianEthiopianEuropeanFijianFilipinoFinnishFrenchFrench American IndianFrench CanadianGermanGerman RussianGhanaianGreekGuamanian/ChamorroGuatemalanGuyaneseHaitianHmongHonduranHopiHoumaHungarianIcelanderIndian (Asian)IndonesianInupiatIranianIraqiIrishIroquoisIsraeliItalianJamaicanJapaneseJordanianKenyanKiowaKoreanLaotianLatvianLebaneseLiberianLithuanianLumbeeLuxembourgerMacedonianMalaysianMalteseMarshalleseMenomineeMexicanMexican American IndianMongolianMoroccanNative HawaiianNavajoNepaleseNew ZealanderNicaraguanNigerianNorthern EuropeanNorwegianOkinawanOsageOttawaPaiutePakistaniPalestinianPanamanianParaguayanPennsylvania GermanPeruvianPimaPolishPortuguesePotawatomiPuebloPuerto RicanPuget Sound SalishRomanianRussianSalvadoranSamoanScandinavianScotch-IrishScottishSeminoleSenegaleseSerbianShoshoneSierra LeoneanSiouxSlavicSlovakSloveneSomaliSouth AfricanSouth AmericanSouth American IndianSoviet UnionSpanishSpanish AmericanSpanish American IndianSri LankanSubsaharan AfricanSudaneseSwedishSwissSyrianTaiwaneseThaiTlingit-HaidaTohono O'OdhamTonganTrinidadian and TobagonianTsimshianTurkishU.S. Virgin IslanderUgandanUkrainianUruguayanUteVenezuelanVietnameseWelshWest IndianYakamaYaquiYugoslavianYumanYup'ikZimbabwean
Immigration
NonimmigrantsImmigrantsAfghanistanAfricaAlbaniaArgentinaArmeniaAsiaAustraliaAustriaBahamasBangladeshBarbadosBelarusBelgiumBelizeBoliviaBosnia and HerzegovinaBrazilBulgariaBurma/MyanmarCabo VerdeCambodiaCameroonCanadaCaribbeanCentral AmericaChileChinaColombiaCongoCosta RicaCroatiaCubaCzechoslovakiaDenmarkDominicaDominican RepublicEastern AfricaEastern AsiaEastern EuropeEcuadorEgyptEl SalvadorEnglandEritreaEthiopiaEuropeFijiFranceGermanyGhanaGreeceGrenadaGuatemalaGuyanaHaitiHondurasHong KongHungaryIndiaIndonesiaIranIraqIrelandIsraelItalyJamaicaJapanJordanKazakhstanKenyaKoreaKuwaitLaosLatin AmericaLatviaLebanonLiberiaLithuaniaMalaysiaMexicoMicronesiaMiddle AfricaMoldovaMoroccoNepalNetherlandsNicaraguaNigeriaNorth AmericaNorth MacedoniaNorthern AfricaNorthern EuropeNorwayOceaniaPakistanPanamaPeruPhilippinesPolandPortugalRomaniaRussiaSaudi ArabiaScotlandSenegalSerbiaSierra LeoneSingaporeSomaliaSouth AfricaSouth AmericaSouth Central AsiaSouth Eastern AsiaSouthern EuropeSpainSri LankaSt. Vincent and the GrenadinesSudanSwedenSwitzerlandSyriaTaiwanThailandTrinidad and TobagoTurkeyUgandaUkraineUruguayUzbekistanVenezuelaVietnamWest IndiesWestern AfricaWestern AsiaWestern EuropeYemenZaireZimbabweAzores
Unemployment Among Women with Children Ages 6 to 17 years
Income
Poverty
Unemployment
Labor Participation
Family Structure
Vehicle Availability
Education Level
Disability

Unemployment Among Women with Children Ages 6 to 17 years Comparison

Spaniards

Immigrants from Indonesia

Tragic
Exceptional
9.2%
UNEMPLOYMENT AMONG WOMEN WITH CHILDREN AGES 6 TO 17 YEARS
8.2/ 100
METRIC RATING
213th/ 347
METRIC RANK
7.7%
UNEMPLOYMENT AMONG WOMEN WITH CHILDREN AGES 6 TO 17 YEARS
100.0/ 100
METRIC RATING
23rd/ 347
METRIC RANK

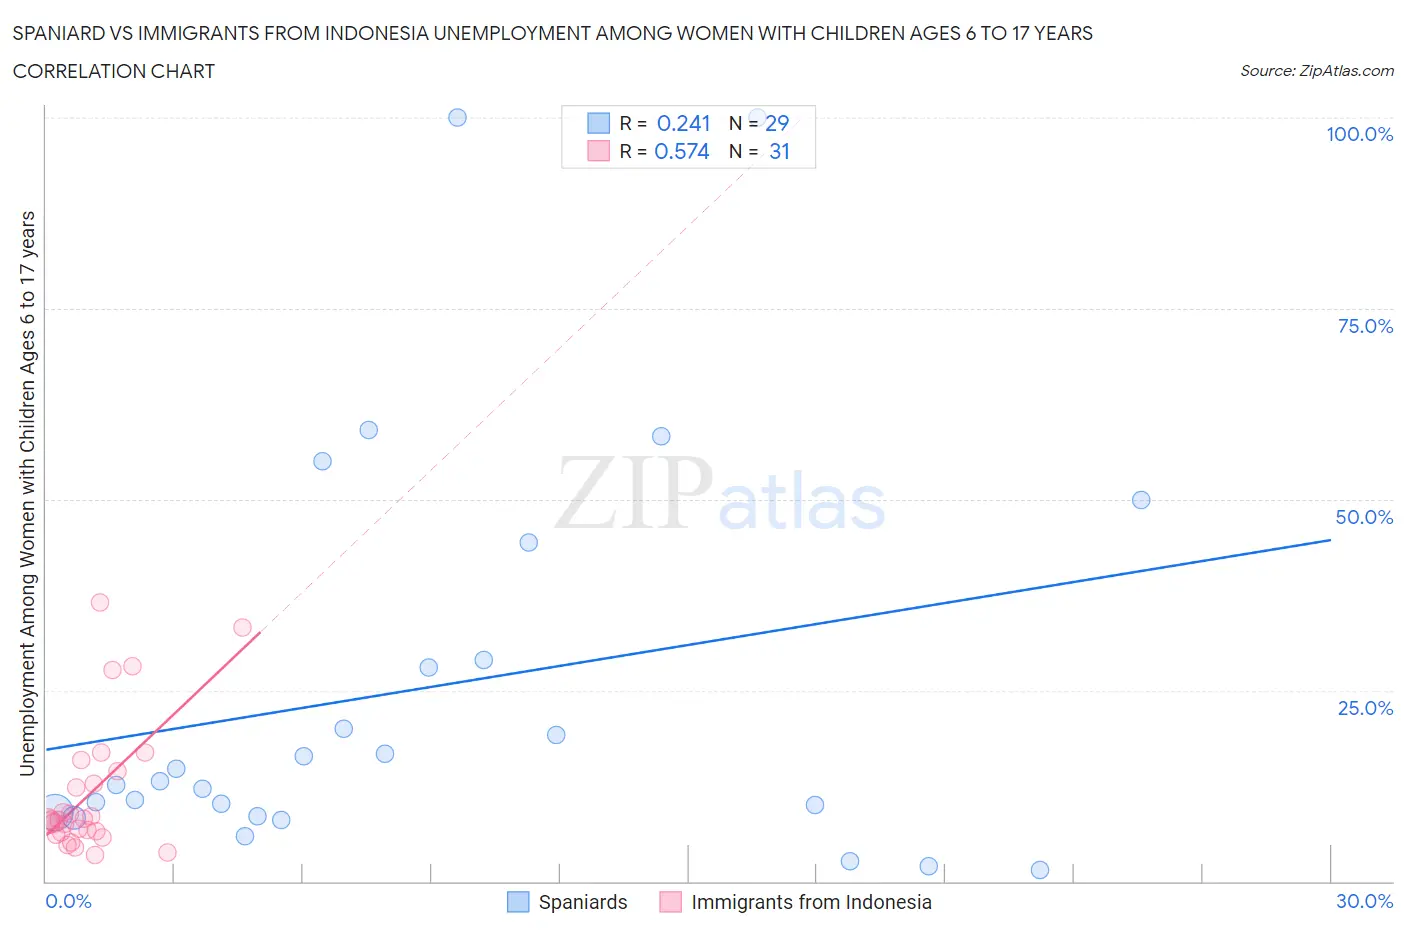
Spaniard vs Immigrants from Indonesia Unemployment Among Women with Children Ages 6 to 17 years Correlation Chart

The statistical analysis conducted on geographies consisting of 311,847,590 people shows a weak positive correlation between the proportion of Spaniards and unemployment rate among women with children between the ages 6 and 17 in the United States with a correlation coefficient (R) of 0.241 and weighted average of 9.2%. Similarly, the statistical analysis conducted on geographies consisting of 175,361,002 people shows a substantial positive correlation between the proportion of Immigrants from Indonesia and unemployment rate among women with children between the ages 6 and 17 in the United States with a correlation coefficient (R) of 0.574 and weighted average of 7.7%, a difference of 19.3%.
Spaniard vs Immigrants from Indonesia Unemployment Among Women with Children Ages 6 to 17 years

Unemployment Among Women with Children Ages 6 to 17 years Correlation Summary

MeasurementSpaniardImmigrants from Indonesia
Minimum1.4%3.4%
Maximum100.0%36.5%
Range98.6%33.1%
Mean25.4%11.5%
Median13.1%7.9%
Interquartile 25% (IQ1)8.7%6.4%
Interquartile 75% (IQ3)36.7%14.4%
Interquartile Range (IQR)27.9%8.0%
Standard Deviation (Sample)26.8%8.7%
Standard Deviation (Population)26.3%8.5%

Similar Demographics by Unemployment Among Women with Children Ages 6 to 17 years

Demographics Similar to Spaniards by Unemployment Among Women with Children Ages 6 to 17 years

In terms of unemployment among women with children ages 6 to 17 years, the demographic groups most similar to Spaniards are Iroquois (9.2%, a difference of 0.10%), Peruvian (9.2%, a difference of 0.11%), Immigrants from Germany (9.2%, a difference of 0.14%), Immigrants from Uruguay (9.2%, a difference of 0.14%), and German (9.2%, a difference of 0.15%).
DemographicsRating | RankUnemployment Among Women with Children Ages 6 to 17 years
Immigrants | North America
12.7
/100
|
#206
Poor
9.2%
Cubans
10.9
/100
|
#207
Poor
9.2%
Immigrants | Peru
10.8
/100
|
#208
Poor
9.2%
Salvadorans
10.7
/100
|
#209
Poor
9.2%
Finns
10.0
/100
|
#210
Tragic
9.2%
Immigrants | Cuba
9.6
/100
|
#211
Tragic
9.2%
Peruvians
9.0
/100
|
#212
Tragic
9.2%
Spaniards
8.2
/100
|
#213
Tragic
9.2%
Iroquois
7.5
/100
|
#214
Tragic
9.2%
Immigrants | Germany
7.2
/100
|
#215
Tragic
9.2%
Immigrants | Uruguay
7.2
/100
|
#216
Tragic
9.2%
Germans
7.2
/100
|
#217
Tragic
9.2%
Syrians
6.9
/100
|
#218
Tragic
9.2%
Immigrants | Scotland
6.6
/100
|
#219
Tragic
9.2%
Belgians
6.4
/100
|
#220
Tragic
9.2%

Demographics Similar to Immigrants from Indonesia by Unemployment Among Women with Children Ages 6 to 17 years

In terms of unemployment among women with children ages 6 to 17 years, the demographic groups most similar to Immigrants from Indonesia are Nepalese (7.7%, a difference of 0.010%), Immigrants from Eastern Asia (7.7%, a difference of 0.13%), Indian (Asian) (7.7%, a difference of 0.13%), Immigrants from China (7.7%, a difference of 0.38%), and Immigrants from India (7.7%, a difference of 0.68%).
DemographicsRating | RankUnemployment Among Women with Children Ages 6 to 17 years
Immigrants | Burma/Myanmar
100.0
/100
|
#16
Exceptional
7.5%
Cambodians
100.0
/100
|
#17
Exceptional
7.5%
Afghans
100.0
/100
|
#18
Exceptional
7.6%
Filipinos
100.0
/100
|
#19
Exceptional
7.6%
Immigrants | Singapore
100.0
/100
|
#20
Exceptional
7.7%
Immigrants | India
100.0
/100
|
#21
Exceptional
7.7%
Immigrants | China
100.0
/100
|
#22
Exceptional
7.7%
Immigrants | Indonesia
100.0
/100
|
#23
Exceptional
7.7%
Nepalese
100.0
/100
|
#24
Exceptional
7.7%
Immigrants | Eastern Asia
100.0
/100
|
#25
Exceptional
7.7%
Indians (Asian)
100.0
/100
|
#26
Exceptional
7.7%
Immigrants | Afghanistan
100.0
/100
|
#27
Exceptional
7.8%
Immigrants | Uzbekistan
100.0
/100
|
#28
Exceptional
7.8%
Thais
100.0
/100
|
#29
Exceptional
7.8%
Immigrants | Iran
100.0
/100
|
#30
Exceptional
7.9%