Brandywine, MD
Brandywine Map
Brandywine Overview
10,088
TOTAL POPULATION
4,882
MALE POPULATION
5,206
FEMALE POPULATION
93.78
MALES / 100 FEMALES
106.64
FEMALES / 100 MALES
43.1
MEDIAN AGE
3.4
AVG FAMILY SIZE
3.0
AVG HOUSEHOLD SIZE
$56,182
PER CAPITA INCOME
$181,389
AVG FAMILY INCOME
$150,494
AVG HOUSEHOLD INCOME
20.0%
WAGE / INCOME GAP [ % ]
80.0¢/ $1
WAGE / INCOME GAP [ $ ]
0.32
INEQUALITY / GINI INDEX
5,949
LABOR FORCE [ PEOPLE ]
70.6%
PERCENT IN LABOR FORCE
6.2%
UNEMPLOYMENT RATE
Brandywine Zip Codes
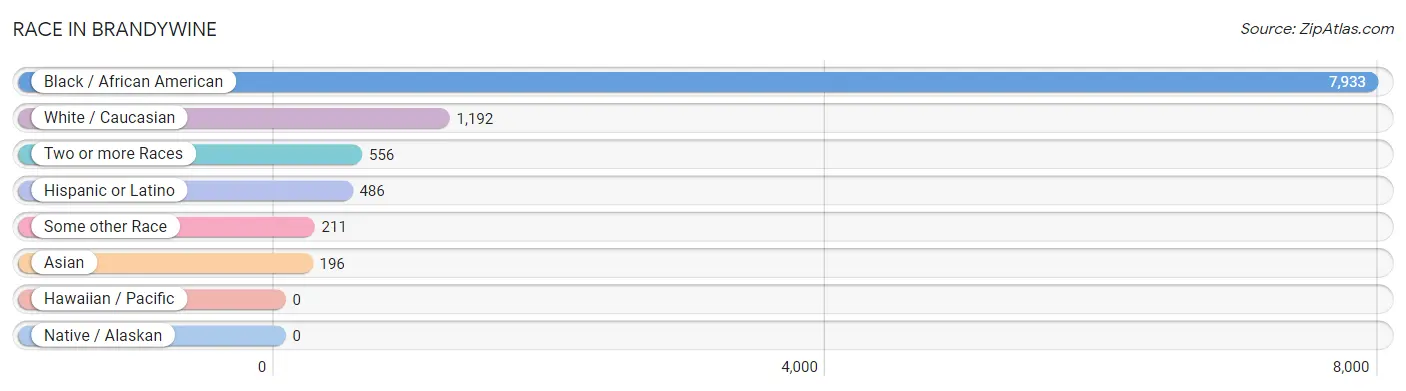
Race in Brandywine
The most populous races in Brandywine are Black / African American (7,933 | 78.6%), White / Caucasian (1,192 | 11.8%), and Two or more Races (556 | 5.5%).
| Race | # Population | % Population |
| Asian | 196 | 1.9% |
| Black / African American | 7,933 | 78.6% |
| Hawaiian / Pacific | 0 | 0.0% |
| Hispanic or Latino | 486 | 4.8% |
| Native / Alaskan | 0 | 0.0% |
| White / Caucasian | 1,192 | 11.8% |
| Two or more Races | 556 | 5.5% |
| Some other Race | 211 | 2.1% |
| Total | 10,088 | 100.0% |
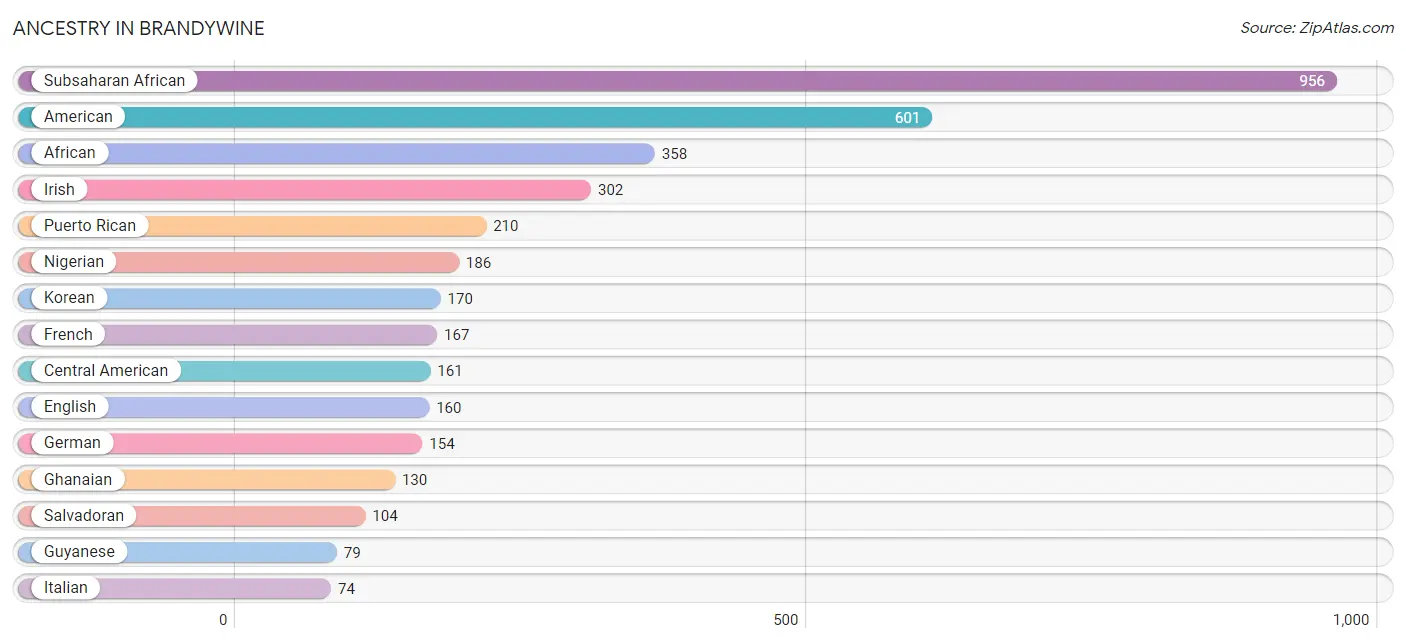
Ancestry in Brandywine
The most populous ancestries reported in Brandywine are Subsaharan African (956 | 9.5%), American (601 | 6.0%), African (358 | 3.5%), Irish (302 | 3.0%), and Puerto Rican (210 | 2.1%), together accounting for 24.1% of all Brandywine residents.
| Ancestry | # Population | % Population |
| African | 358 | 3.5% |
| American | 601 | 6.0% |
| Blackfeet | 65 | 0.6% |
| British | 20 | 0.2% |
| Central American | 161 | 1.6% |
| Colombian | 14 | 0.1% |
| Danish | 34 | 0.3% |
| Dutch | 28 | 0.3% |
| English | 160 | 1.6% |
| Ethiopian | 33 | 0.3% |
| European | 50 | 0.5% |
| French | 167 | 1.7% |
| German | 154 | 1.5% |
| Ghanaian | 130 | 1.3% |
| Guatemalan | 41 | 0.4% |
| Guyanese | 79 | 0.8% |
| Haitian | 20 | 0.2% |
| Hungarian | 7 | 0.1% |
| Irish | 302 | 3.0% |
| Iroquois | 9 | 0.1% |
| Israeli | 17 | 0.2% |
| Italian | 74 | 0.7% |
| Jamaican | 25 | 0.3% |
| Korean | 170 | 1.7% |
| Mexican | 28 | 0.3% |
| Nicaraguan | 16 | 0.2% |
| Nigerian | 186 | 1.8% |
| Polish | 7 | 0.1% |
| Puerto Rican | 210 | 2.1% |
| Salvadoran | 104 | 1.0% |
| Scottish | 9 | 0.1% |
| South African | 74 | 0.7% |
| South American | 14 | 0.1% |
| Spaniard | 30 | 0.3% |
| Sri Lankan | 46 | 0.5% |
| Subsaharan African | 956 | 9.5% |
| Swedish | 7 | 0.1% |
| Welsh | 3 | 0.0% |
| West Indian | 9 | 0.1% | View All 39 Rows |
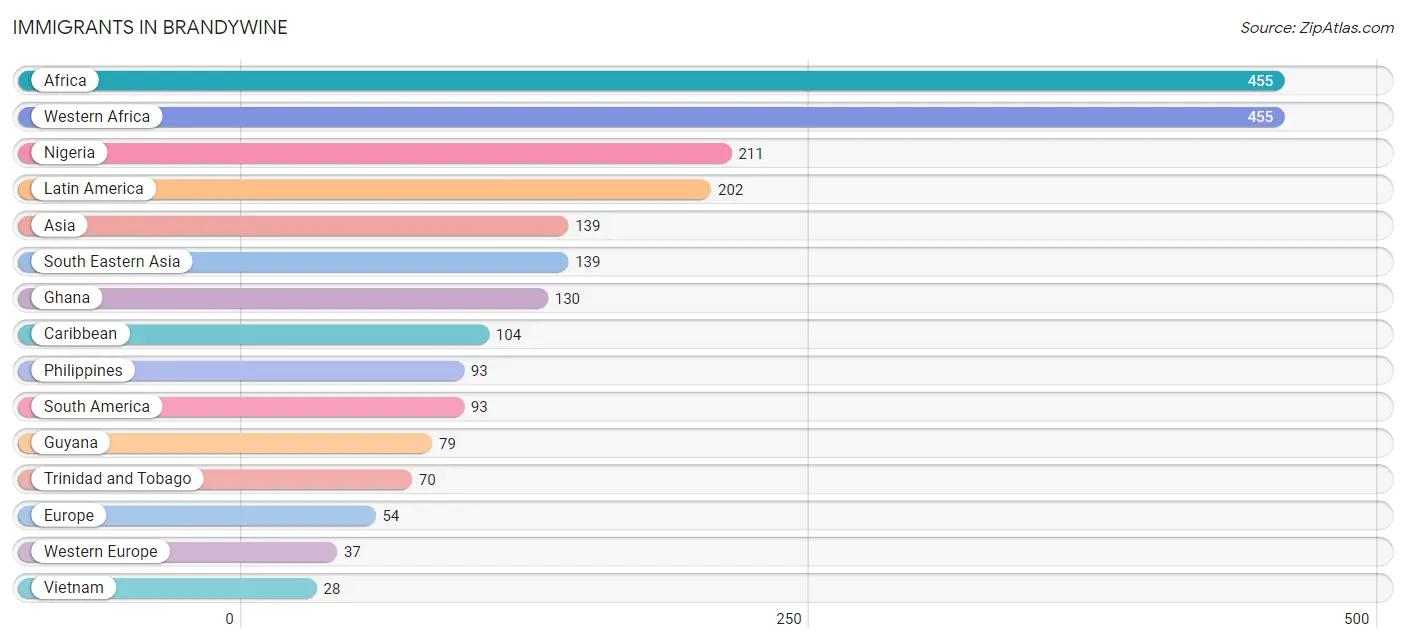
Immigrants in Brandywine
The most numerous immigrant groups reported in Brandywine came from Africa (455 | 4.5%), Western Africa (455 | 4.5%), Nigeria (211 | 2.1%), Latin America (202 | 2.0%), and Asia (139 | 1.4%), together accounting for 14.5% of all Brandywine residents.
| Immigration Origin | # Population | % Population |
| Africa | 455 | 4.5% |
| Asia | 139 | 1.4% |
| Caribbean | 104 | 1.0% |
| Central America | 5 | 0.1% |
| Colombia | 14 | 0.1% |
| Europe | 54 | 0.5% |
| France | 19 | 0.2% |
| Germany | 18 | 0.2% |
| Ghana | 130 | 1.3% |
| Guyana | 79 | 0.8% |
| Jamaica | 25 | 0.3% |
| Laos | 18 | 0.2% |
| Latin America | 202 | 2.0% |
| Mexico | 5 | 0.1% |
| Nigeria | 211 | 2.1% |
| Northern Europe | 17 | 0.2% |
| Philippines | 93 | 0.9% |
| South America | 93 | 0.9% |
| South Eastern Asia | 139 | 1.4% |
| Trinidad and Tobago | 70 | 0.7% |
| Vietnam | 28 | 0.3% |
| Western Africa | 455 | 4.5% |
| Western Europe | 37 | 0.4% | View All 23 Rows |
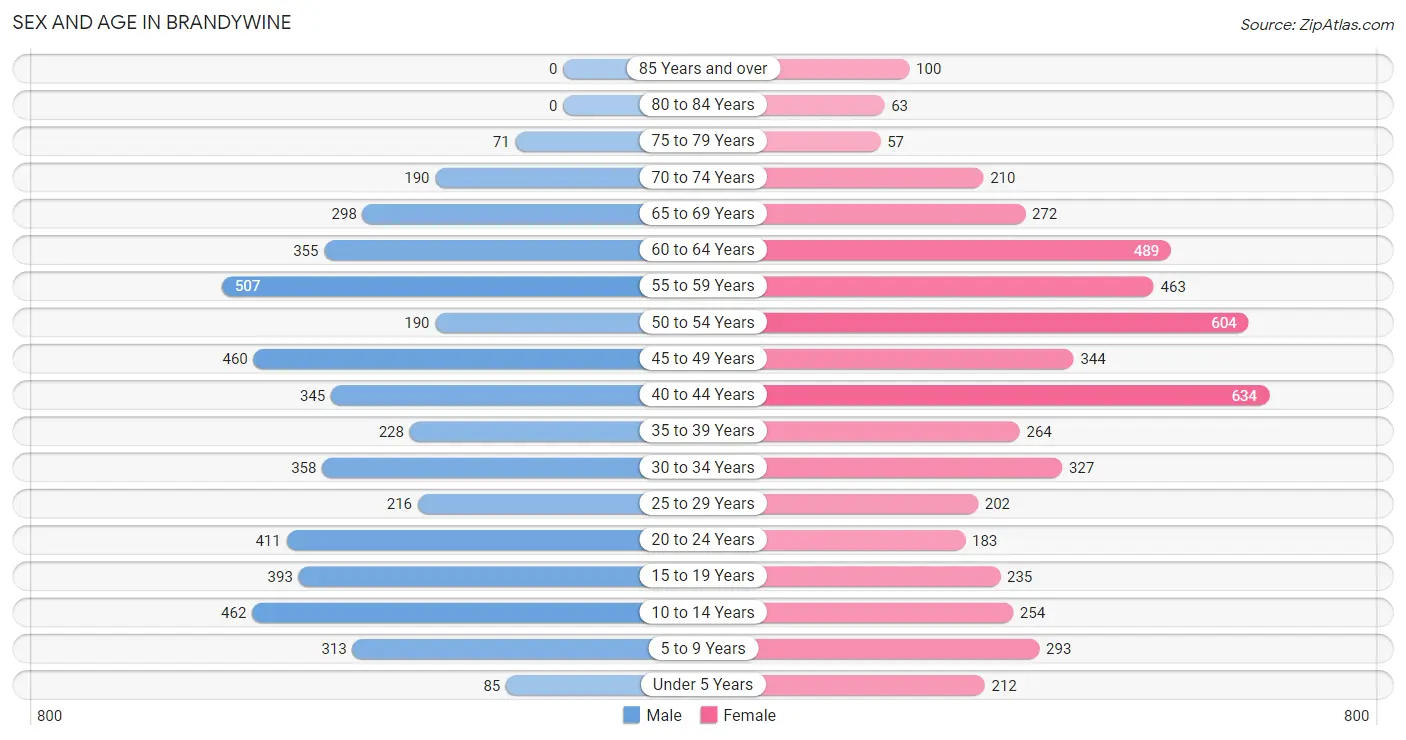
Sex and Age in Brandywine
Sex and Age in Brandywine
The most populous age groups in Brandywine are 55 to 59 Years (507 | 10.4%) for men and 40 to 44 Years (634 | 12.2%) for women.
| Age Bracket | Male | Female |
| Under 5 Years | 85 (1.7%) | 212 (4.1%) |
| 5 to 9 Years | 313 (6.4%) | 293 (5.6%) |
| 10 to 14 Years | 462 (9.5%) | 254 (4.9%) |
| 15 to 19 Years | 393 (8.1%) | 235 (4.5%) |
| 20 to 24 Years | 411 (8.4%) | 183 (3.5%) |
| 25 to 29 Years | 216 (4.4%) | 202 (3.9%) |
| 30 to 34 Years | 358 (7.3%) | 327 (6.3%) |
| 35 to 39 Years | 228 (4.7%) | 264 (5.1%) |
| 40 to 44 Years | 345 (7.1%) | 634 (12.2%) |
| 45 to 49 Years | 460 (9.4%) | 344 (6.6%) |
| 50 to 54 Years | 190 (3.9%) | 604 (11.6%) |
| 55 to 59 Years | 507 (10.4%) | 463 (8.9%) |
| 60 to 64 Years | 355 (7.3%) | 489 (9.4%) |
| 65 to 69 Years | 298 (6.1%) | 272 (5.2%) |
| 70 to 74 Years | 190 (3.9%) | 210 (4.0%) |
| 75 to 79 Years | 71 (1.5%) | 57 (1.1%) |
| 80 to 84 Years | 0 (0.0%) | 63 (1.2%) |
| 85 Years and over | 0 (0.0%) | 100 (1.9%) |
| Total | 4,882 (100.0%) | 5,206 (100.0%) |
Families and Households in Brandywine
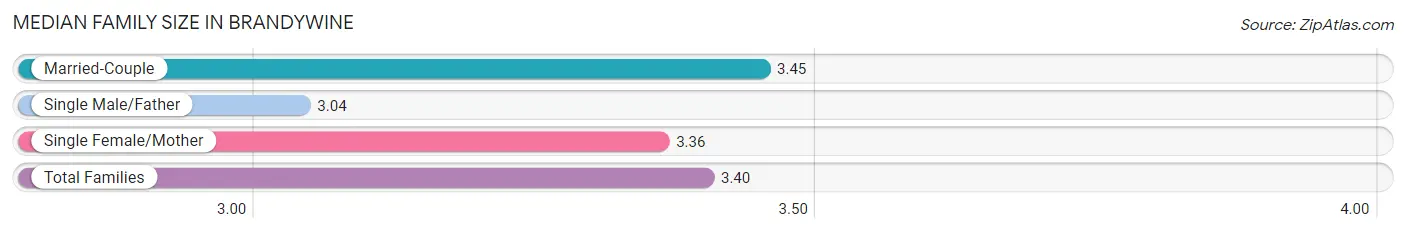
Median Family Size in Brandywine
The median family size in Brandywine is 3.40 persons per family, with married-couple families (1,840 | 70.4%) accounting for the largest median family size of 3.45 persons per family. On the other hand, single male/father families (208 | 8.0%) represent the smallest median family size with 3.04 persons per family.
| Family Type | # Families | Family Size |
| Married-Couple | 1,840 (70.4%) | 3.45 |
| Single Male/Father | 208 (8.0%) | 3.04 |
| Single Female/Mother | 566 (21.6%) | 3.36 |
| Total Families | 2,614 (100.0%) | 3.40 |
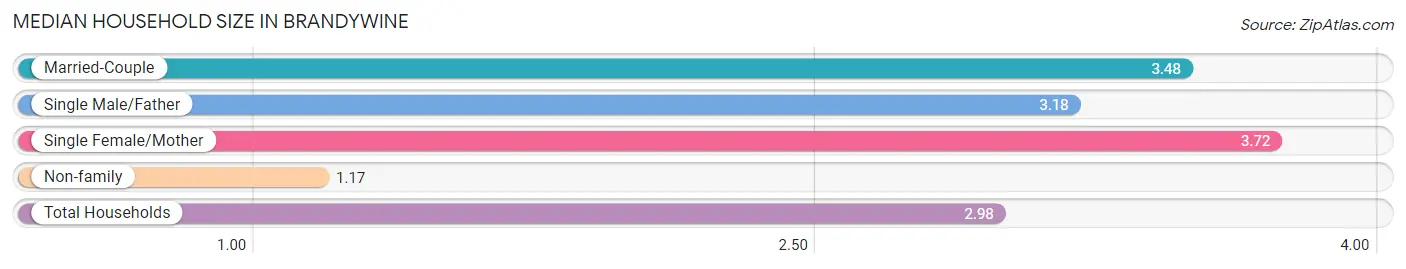
Median Household Size in Brandywine
The median household size in Brandywine is 2.98 persons per household, with single female/mother households (566 | 16.7%) accounting for the largest median household size of 3.72 persons per household. non-family households (775 | 22.9%) represent the smallest median household size with 1.17 persons per household.
| Household Type | # Households | Household Size |
| Married-Couple | 1,840 (54.3%) | 3.48 |
| Single Male/Father | 208 (6.1%) | 3.18 |
| Single Female/Mother | 566 (16.7%) | 3.72 |
| Non-family | 775 (22.9%) | 1.17 |
| Total Households | 3,389 (100.0%) | 2.98 |
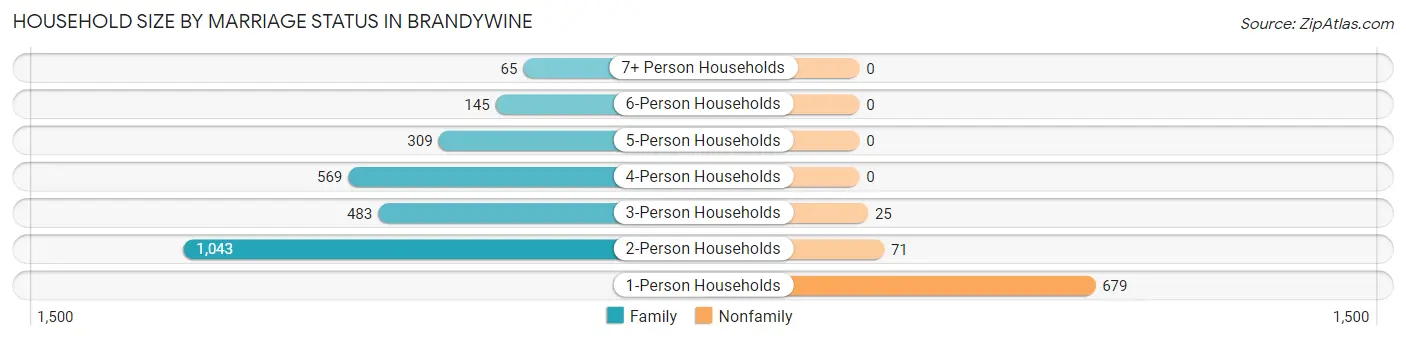
Household Size by Marriage Status in Brandywine
Out of a total of 3,389 households in Brandywine, 2,614 (77.1%) are family households, while 775 (22.9%) are nonfamily households. The most numerous type of family households are 2-person households, comprising 1,043, and the most common type of nonfamily households are 1-person households, comprising 679.
| Household Size | Family Households | Nonfamily Households |
| 1-Person Households | - | 679 (20.0%) |
| 2-Person Households | 1,043 (30.8%) | 71 (2.1%) |
| 3-Person Households | 483 (14.2%) | 25 (0.7%) |
| 4-Person Households | 569 (16.8%) | 0 (0.0%) |
| 5-Person Households | 309 (9.1%) | 0 (0.0%) |
| 6-Person Households | 145 (4.3%) | 0 (0.0%) |
| 7+ Person Households | 65 (1.9%) | 0 (0.0%) |
| Total | 2,614 (77.1%) | 775 (22.9%) |
Female Fertility in Brandywine
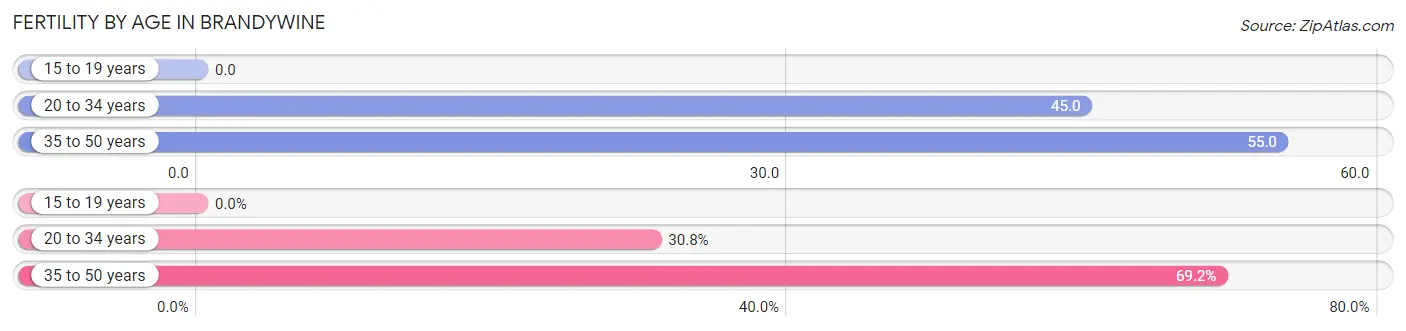
Fertility by Age in Brandywine
Average fertility rate in Brandywine is 46.0 births per 1,000 women. Women in the age bracket of 35 to 50 years have the highest fertility rate with 55.0 births per 1,000 women. Women in the age bracket of 35 to 50 years acount for 69.2% of all women with births.
| Age Bracket | Women with Births | Births / 1,000 Women |
| 15 to 19 years | 0 (0.0%) | 0.0 |
| 20 to 34 years | 32 (30.8%) | 45.0 |
| 35 to 50 years | 72 (69.2%) | 55.0 |
| Total | 104 (100.0%) | 46.0 |
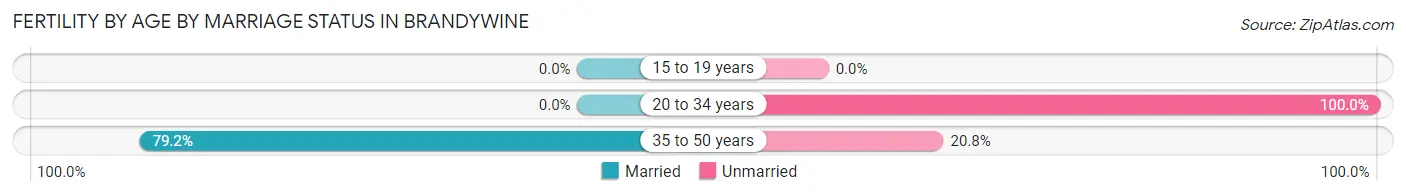
Fertility by Age by Marriage Status in Brandywine
54.8% of women with births (104) in Brandywine are married. The highest percentage of unmarried women with births falls into 20 to 34 years age bracket with 100.0% of them unmarried at the time of birth, while the lowest percentage of unmarried women with births belong to 35 to 50 years age bracket with 20.8% of them unmarried.
| Age Bracket | Married | Unmarried |
| 15 to 19 years | 0 (0.0%) | 0 (0.0%) |
| 20 to 34 years | 0 (0.0%) | 32 (100.0%) |
| 35 to 50 years | 57 (79.2%) | 15 (20.8%) |
| Total | 57 (54.8%) | 47 (45.2%) |
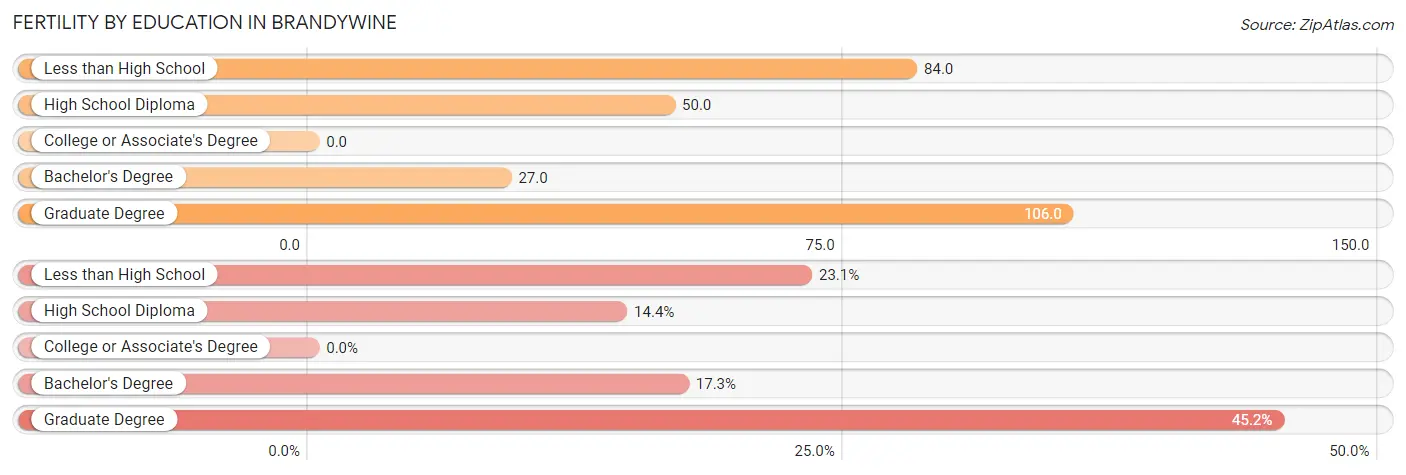
Fertility by Education in Brandywine
| Educational Attainment | Women with Births | Births / 1,000 Women |
| Less than High School | 24 (23.1%) | 84.0 |
| High School Diploma | 15 (14.4%) | 50.0 |
| College or Associate's Degree | 0 (0.0%) | 0.0 |
| Bachelor's Degree | 18 (17.3%) | 27.0 |
| Graduate Degree | 47 (45.2%) | 106.0 |
| Total | 104 (100.0%) | 46.0 |
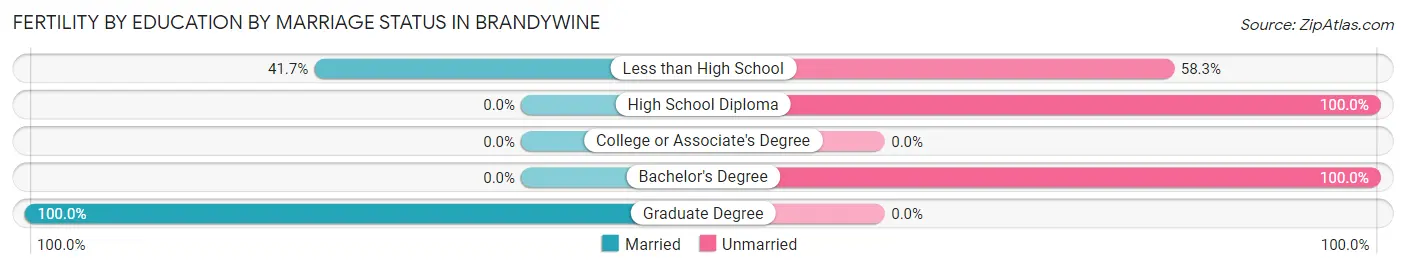
Fertility by Education by Marriage Status in Brandywine
45.2% of women with births in Brandywine are unmarried. Women with the educational attainment of graduate degree are most likely to be married with 100.0% of them married at childbirth, while women with the educational attainment of high school diploma are least likely to be married with 100.0% of them unmarried at childbirth.
| Educational Attainment | Married | Unmarried |
| Less than High School | 10 (41.7%) | 14 (58.3%) |
| High School Diploma | 0 (0.0%) | 15 (100.0%) |
| College or Associate's Degree | 0 (0.0%) | 0 (0.0%) |
| Bachelor's Degree | 0 (0.0%) | 18 (100.0%) |
| Graduate Degree | 47 (100.0%) | 0 (0.0%) |
| Total | 57 (54.8%) | 47 (45.2%) |
Income in Brandywine
Income Overview in Brandywine
Per Capita Income in Brandywine is $56,182, while median incomes of families and households are $181,389 and $150,494 respectively.
| Characteristic | Number | Measure |
| Per Capita Income | 10,088 | $56,182 |
| Median Family Income | 2,614 | $181,389 |
| Mean Family Income | 2,614 | $181,187 |
| Median Household Income | 3,389 | $150,494 |
| Mean Household Income | 3,389 | $163,614 |
| Income Deficit | 2,614 | $0 |
| Wage / Income Gap (%) | 10,088 | 19.95% |
| Wage / Income Gap ($) | 10,088 | 80.05¢ per $1 |
| Gini / Inequality Index | 10,088 | 0.32 |
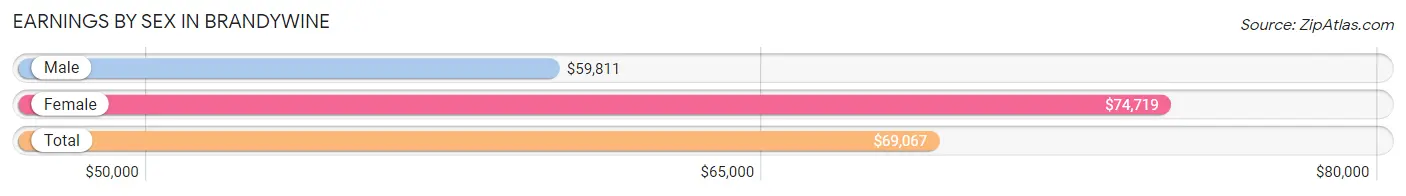
Earnings by Sex in Brandywine
Average Earnings in Brandywine are $69,067, $59,811 for men and $74,719 for women, a difference of 20.0%.
| Sex | Number | Average Earnings |
| Male | 2,944 (48.5%) | $59,811 |
| Female | 3,129 (51.5%) | $74,719 |
| Total | 6,073 (100.0%) | $69,067 |
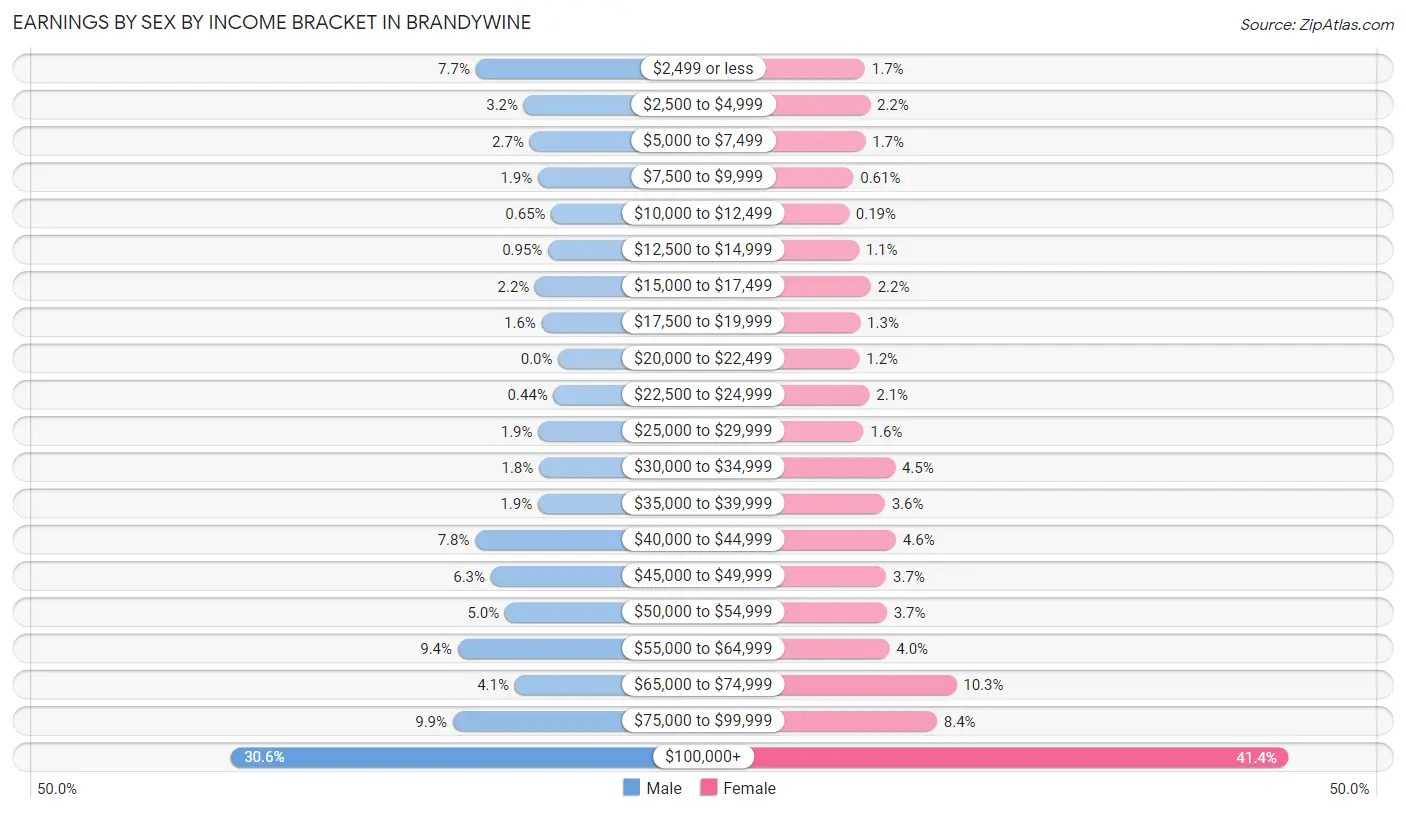
Earnings by Sex by Income Bracket in Brandywine
The most common earnings brackets in Brandywine are $100,000+ for men (902 | 30.6%) and $100,000+ for women (1,295 | 41.4%).
| Income | Male | Female |
| $2,499 or less | 228 (7.7%) | 53 (1.7%) |
| $2,500 to $4,999 | 95 (3.2%) | 68 (2.2%) |
| $5,000 to $7,499 | 79 (2.7%) | 54 (1.7%) |
| $7,500 to $9,999 | 56 (1.9%) | 19 (0.6%) |
| $10,000 to $12,499 | 19 (0.6%) | 6 (0.2%) |
| $12,500 to $14,999 | 28 (0.9%) | 35 (1.1%) |
| $15,000 to $17,499 | 64 (2.2%) | 70 (2.2%) |
| $17,500 to $19,999 | 46 (1.6%) | 39 (1.3%) |
| $20,000 to $22,499 | 0 (0.0%) | 37 (1.2%) |
| $22,500 to $24,999 | 13 (0.4%) | 66 (2.1%) |
| $25,000 to $29,999 | 55 (1.9%) | 49 (1.6%) |
| $30,000 to $34,999 | 53 (1.8%) | 141 (4.5%) |
| $35,000 to $39,999 | 56 (1.9%) | 111 (3.5%) |
| $40,000 to $44,999 | 229 (7.8%) | 144 (4.6%) |
| $45,000 to $49,999 | 186 (6.3%) | 115 (3.7%) |
| $50,000 to $54,999 | 147 (5.0%) | 117 (3.7%) |
| $55,000 to $64,999 | 277 (9.4%) | 125 (4.0%) |
| $65,000 to $74,999 | 120 (4.1%) | 321 (10.3%) |
| $75,000 to $99,999 | 291 (9.9%) | 264 (8.4%) |
| $100,000+ | 902 (30.6%) | 1,295 (41.4%) |
| Total | 2,944 (100.0%) | 3,129 (100.0%) |
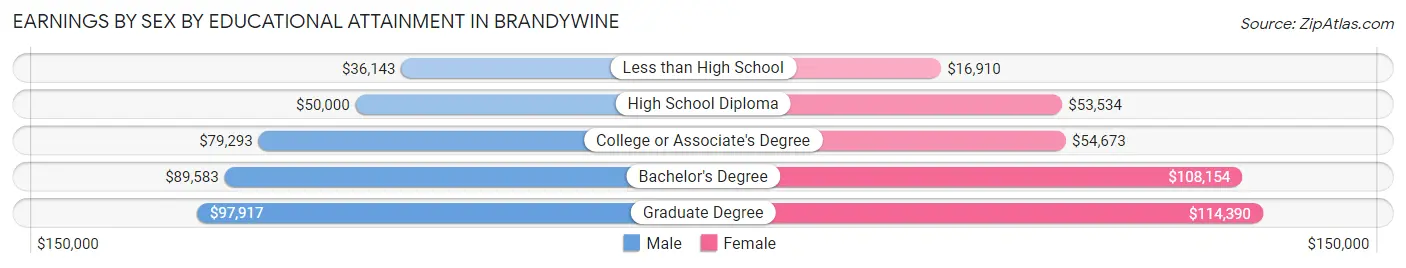
Earnings by Sex by Educational Attainment in Brandywine
Average earnings in Brandywine are $69,132 for men and $91,635 for women, a difference of 24.6%. Men with an educational attainment of graduate degree enjoy the highest average annual earnings of $97,917, while those with less than high school education earn the least with $36,143. Women with an educational attainment of graduate degree earn the most with the average annual earnings of $114,390, while those with less than high school education have the smallest earnings of $16,910.
| Educational Attainment | Male Income | Female Income |
| Less than High School | $36,143 | $16,910 |
| High School Diploma | $50,000 | $53,534 |
| College or Associate's Degree | $79,293 | $54,673 |
| Bachelor's Degree | $89,583 | $108,154 |
| Graduate Degree | $97,917 | $114,390 |
| Total | $69,132 | $91,635 |
Family Income in Brandywine
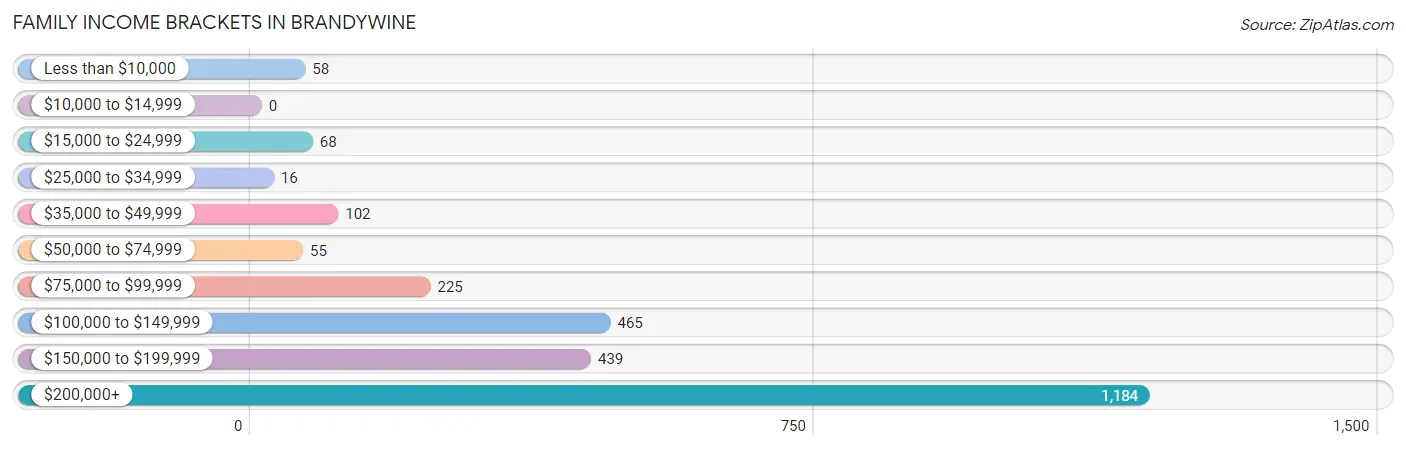
Family Income Brackets in Brandywine
According to the Brandywine family income data, there are 1,184 families falling into the $200,000+ income range, which is the most common income bracket and makes up 45.3% of all families.
| Income Bracket | # Families | % Families |
| Less than $10,000 | 58 | 2.2% |
| $10,000 to $14,999 | 0 | 0.0% |
| $15,000 to $24,999 | 68 | 2.6% |
| $25,000 to $34,999 | 16 | 0.6% |
| $35,000 to $49,999 | 102 | 3.9% |
| $50,000 to $74,999 | 55 | 2.1% |
| $75,000 to $99,999 | 225 | 8.6% |
| $100,000 to $149,999 | 465 | 17.8% |
| $150,000 to $199,999 | 439 | 16.8% |
| $200,000+ | 1,184 | 45.3% |
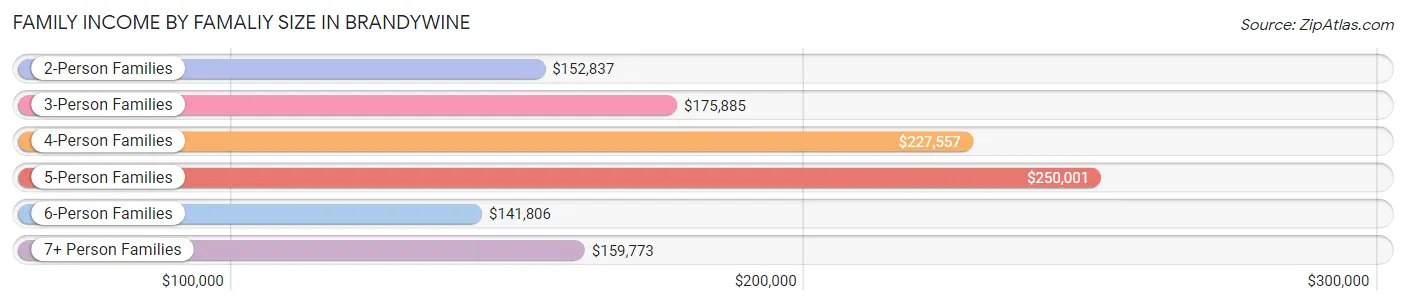
Family Income by Famaliy Size in Brandywine
5-person families (318 | 12.2%) account for the highest median family income in Brandywine with $250,001 per family, while 2-person families (1,069 | 40.9%) have the highest median income of $76,418 per family member.
| Income Bracket | # Families | Median Income |
| 2-Person Families | 1,069 (40.9%) | $152,837 |
| 3-Person Families | 601 (23.0%) | $175,885 |
| 4-Person Families | 459 (17.6%) | $227,557 |
| 5-Person Families | 318 (12.2%) | $250,001 |
| 6-Person Families | 119 (4.5%) | $141,806 |
| 7+ Person Families | 48 (1.8%) | $159,773 |
| Total | 2,614 (100.0%) | $181,389 |
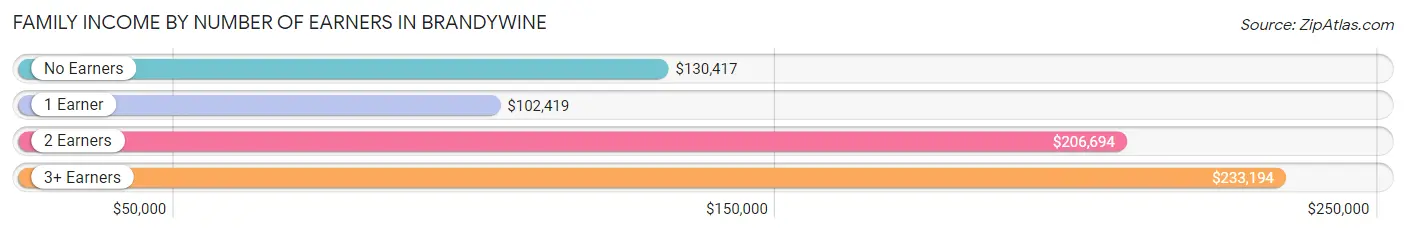
Family Income by Number of Earners in Brandywine
The median family income in Brandywine is $181,389, with families comprising 3+ earners (527) having the highest median family income of $233,194, while families with 1 earner (572) have the lowest median family income of $102,419, accounting for 20.2% and 21.9% of families, respectively.
| Number of Earners | # Families | Median Income |
| No Earners | 259 (9.9%) | $130,417 |
| 1 Earner | 572 (21.9%) | $102,419 |
| 2 Earners | 1,256 (48.0%) | $206,694 |
| 3+ Earners | 527 (20.2%) | $233,194 |
| Total | 2,614 (100.0%) | $181,389 |
Household Income in Brandywine
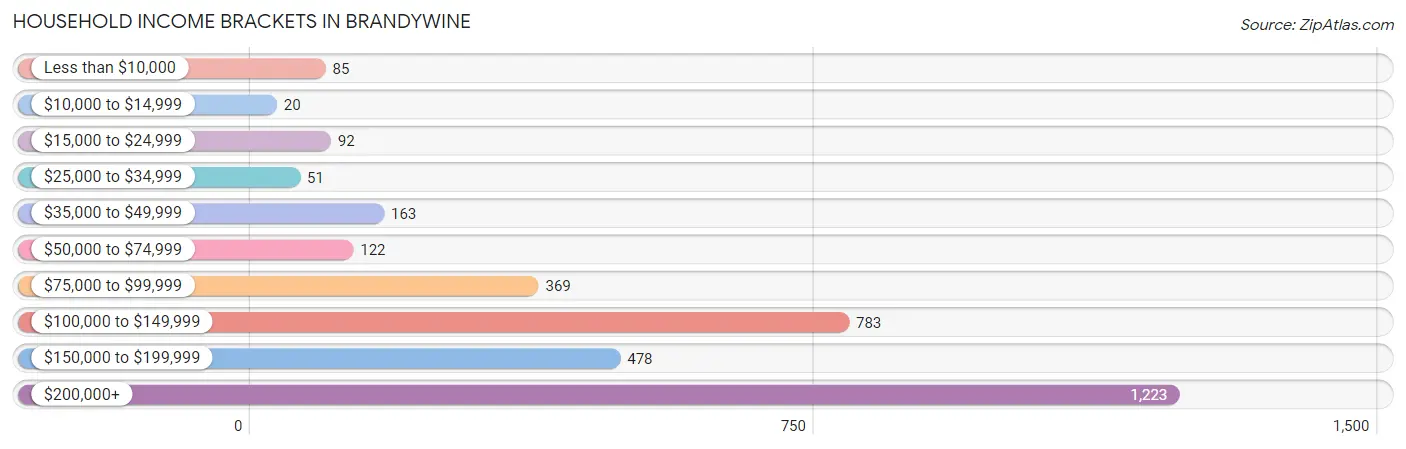
Household Income Brackets in Brandywine
With 1,223 households falling in the category, the $200,000+ income range is the most frequent in Brandywine, accounting for 36.1% of all households. In contrast, only 20 households (0.6%) fall into the $10,000 to $14,999 income bracket, making it the least populous group.
| Income Bracket | # Households | % Households |
| Less than $10,000 | 85 | 2.5% |
| $10,000 to $14,999 | 20 | 0.6% |
| $15,000 to $24,999 | 92 | 2.7% |
| $25,000 to $34,999 | 51 | 1.5% |
| $35,000 to $49,999 | 163 | 4.8% |
| $50,000 to $74,999 | 122 | 3.6% |
| $75,000 to $99,999 | 369 | 10.9% |
| $100,000 to $149,999 | 783 | 23.1% |
| $150,000 to $199,999 | 478 | 14.1% |
| $200,000+ | 1,223 | 36.1% |
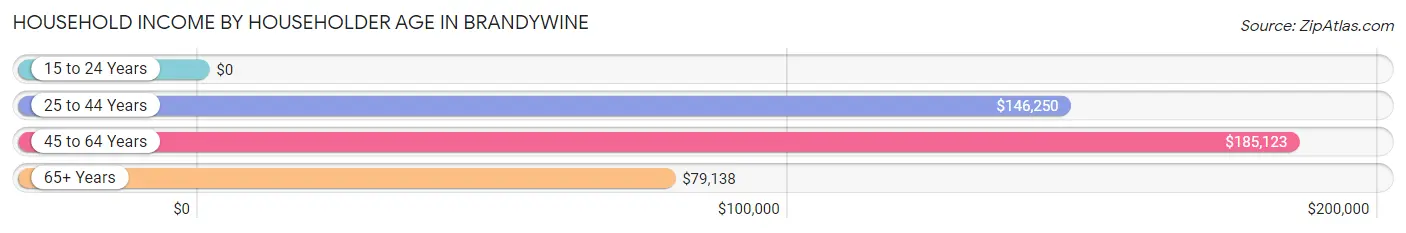
Household Income by Householder Age in Brandywine
The median household income in Brandywine is $150,494, with the highest median household income of $185,123 found in the 45 to 64 years age bracket for the primary householder. A total of 1,783 households (52.6%) fall into this category.
| Income Bracket | # Households | Median Income |
| 15 to 24 Years | 0 (0.0%) | $0 |
| 25 to 44 Years | 1,010 (29.8%) | $146,250 |
| 45 to 64 Years | 1,783 (52.6%) | $185,123 |
| 65+ Years | 596 (17.6%) | $79,138 |
| Total | 3,389 (100.0%) | $150,494 |
Poverty in Brandywine
Income Below Poverty by Sex and Age in Brandywine
With 4.8% poverty level for males and 6.9% for females among the residents of Brandywine, under 5 year old males and under 5 year old females are the most vulnerable to poverty, with 35 males (41.2%) and 32 females (15.1%) in their respective age groups living below the poverty level.
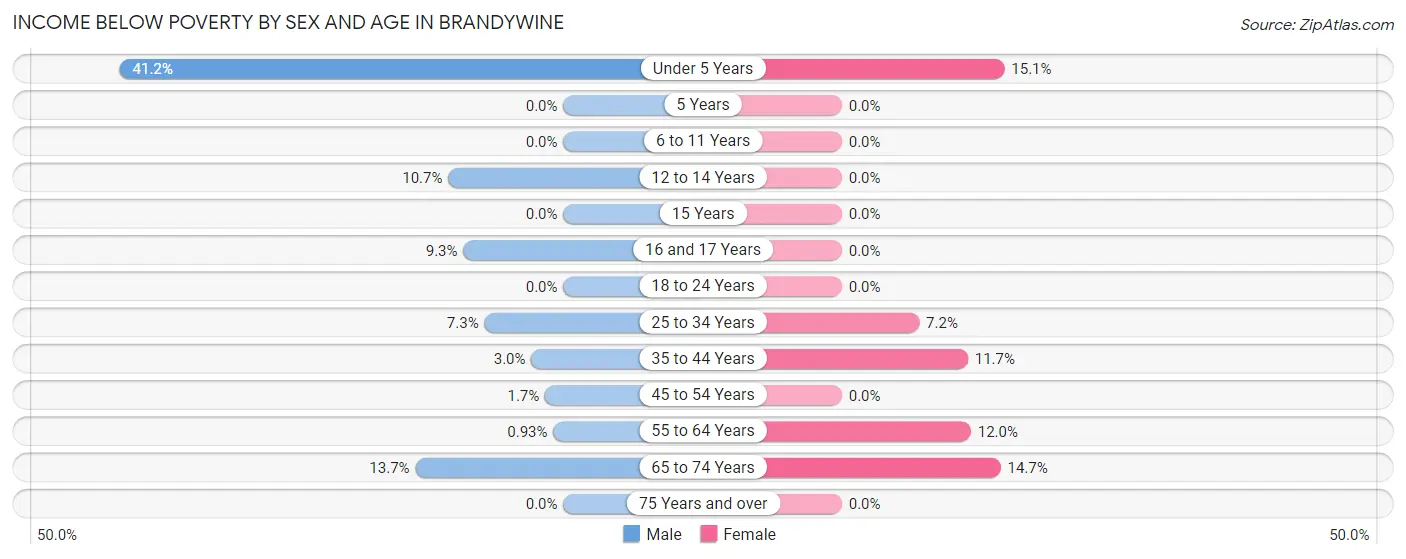
| Age Bracket | Male | Female |
| Under 5 Years | 35 (41.2%) | 32 (15.1%) |
| 5 Years | 0 (0.0%) | 0 (0.0%) |
| 6 to 11 Years | 0 (0.0%) | 0 (0.0%) |
| 12 to 14 Years | 30 (10.7%) | 0 (0.0%) |
| 15 Years | 0 (0.0%) | 0 (0.0%) |
| 16 and 17 Years | 22 (9.3%) | 0 (0.0%) |
| 18 to 24 Years | 0 (0.0%) | 0 (0.0%) |
| 25 to 34 Years | 42 (7.3%) | 38 (7.2%) |
| 35 to 44 Years | 17 (3.0%) | 105 (11.7%) |
| 45 to 54 Years | 11 (1.7%) | 0 (0.0%) |
| 55 to 64 Years | 8 (0.9%) | 114 (12.0%) |
| 65 to 74 Years | 67 (13.7%) | 71 (14.7%) |
| 75 Years and over | 0 (0.0%) | 0 (0.0%) |
| Total | 232 (4.8%) | 360 (6.9%) |
Income Above Poverty by Sex and Age in Brandywine
According to the poverty statistics in Brandywine, males aged 5 years and females aged 5 years are the age groups that are most secure financially, with 100.0% of males and 100.0% of females in these age groups living above the poverty line.
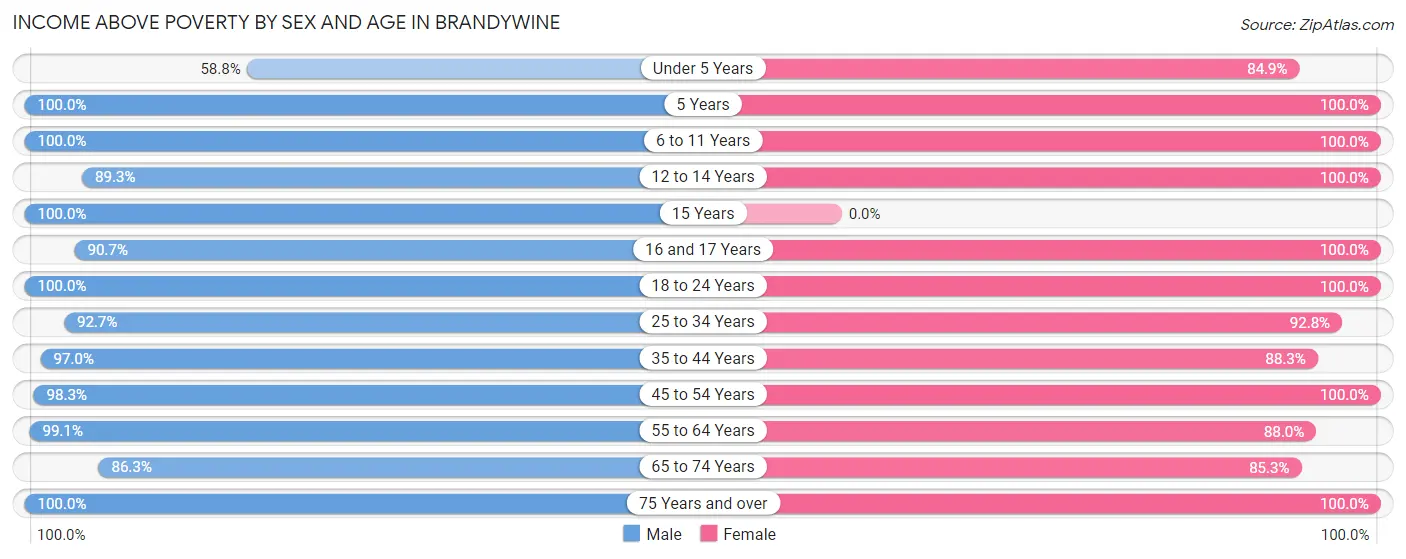
| Age Bracket | Male | Female |
| Under 5 Years | 50 (58.8%) | 180 (84.9%) |
| 5 Years | 142 (100.0%) | 120 (100.0%) |
| 6 to 11 Years | 352 (100.0%) | 270 (100.0%) |
| 12 to 14 Years | 251 (89.3%) | 157 (100.0%) |
| 15 Years | 42 (100.0%) | 0 (0.0%) |
| 16 and 17 Years | 215 (90.7%) | 188 (100.0%) |
| 18 to 24 Years | 525 (100.0%) | 230 (100.0%) |
| 25 to 34 Years | 532 (92.7%) | 491 (92.8%) |
| 35 to 44 Years | 556 (97.0%) | 793 (88.3%) |
| 45 to 54 Years | 639 (98.3%) | 948 (100.0%) |
| 55 to 64 Years | 854 (99.1%) | 838 (88.0%) |
| 65 to 74 Years | 421 (86.3%) | 411 (85.3%) |
| 75 Years and over | 71 (100.0%) | 220 (100.0%) |
| Total | 4,650 (95.3%) | 4,846 (93.1%) |
Income Below Poverty Among Married-Couple Families in Brandywine
The poverty statistics for married-couple families in Brandywine show that 1.6% or 29 of the total 1,840 families live below the poverty line. Families with 3 or 4 children have the highest poverty rate of 16.9%, comprising of 29 families. On the other hand, families with no children have the lowest poverty rate of 0.0%, which includes 0 families.
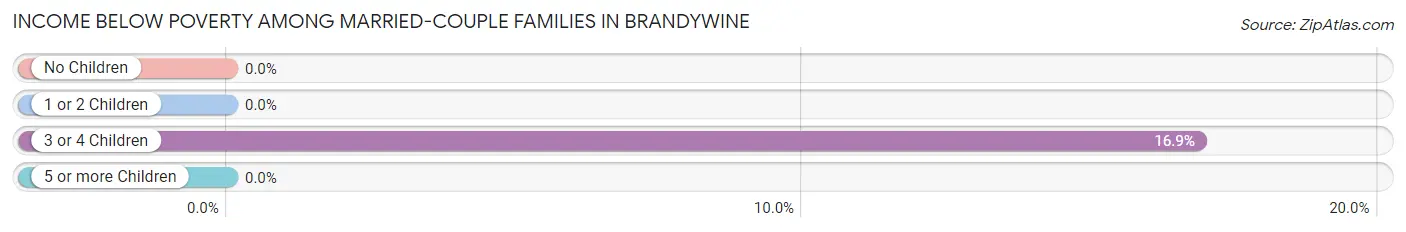
| Children | Above Poverty | Below Poverty |
| No Children | 1,121 (100.0%) | 0 (0.0%) |
| 1 or 2 Children | 547 (100.0%) | 0 (0.0%) |
| 3 or 4 Children | 143 (83.1%) | 29 (16.9%) |
| 5 or more Children | 0 (0.0%) | 0 (0.0%) |
| Total | 1,811 (98.4%) | 29 (1.6%) |
Income Below Poverty Among Single-Parent Households in Brandywine
According to the poverty data in Brandywine, 16.8% or 35 single-father households and 5.7% or 32 single-mother households are living below the poverty line. Among single-father households, those with no children have the highest poverty rate, with 35 households (21.7%) experiencing poverty. Likewise, among single-mother households, those with 1 or 2 children have the highest poverty rate, with 22 households (6.5%) falling below the poverty line.
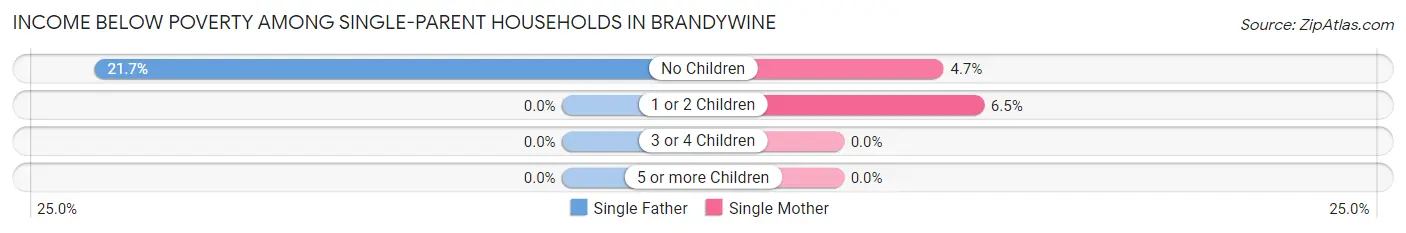
| Children | Single Father | Single Mother |
| No Children | 35 (21.7%) | 10 (4.6%) |
| 1 or 2 Children | 0 (0.0%) | 22 (6.5%) |
| 3 or 4 Children | 0 (0.0%) | 0 (0.0%) |
| 5 or more Children | 0 (0.0%) | 0 (0.0%) |
| Total | 35 (16.8%) | 32 (5.7%) |
Income Below Poverty Among Married-Couple vs Single-Parent Households in Brandywine
The poverty data for Brandywine shows that 29 of the married-couple family households (1.6%) and 67 of the single-parent households (8.7%) are living below the poverty level. Within the married-couple family households, those with 3 or 4 children have the highest poverty rate, with 29 households (16.9%) falling below the poverty line. Among the single-parent households, those with no children have the highest poverty rate, with 45 household (12.0%) living below poverty.
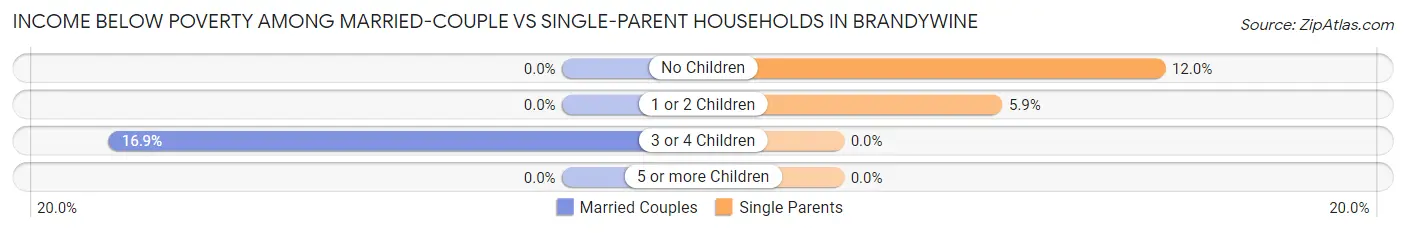
| Children | Married-Couple Families | Single-Parent Households |
| No Children | 0 (0.0%) | 45 (12.0%) |
| 1 or 2 Children | 0 (0.0%) | 22 (5.9%) |
| 3 or 4 Children | 29 (16.9%) | 0 (0.0%) |
| 5 or more Children | 0 (0.0%) | 0 (0.0%) |
| Total | 29 (1.6%) | 67 (8.7%) |
Employment Characteristics in Brandywine
Employment by Class of Employer in Brandywine
Among the 5,463 employed individuals in Brandywine, private company employees (2,382 | 43.6%), federal government employees (1,553 | 28.4%), and local government employees (637 | 11.7%) make up the most common classes of employment.
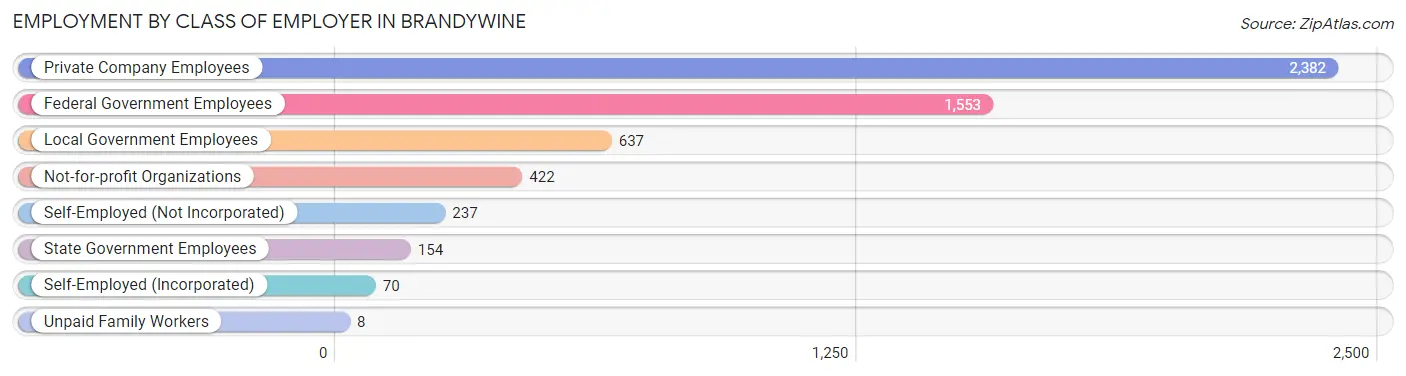
| Employer Class | # Employees | % Employees |
| Private Company Employees | 2,382 | 43.6% |
| Self-Employed (Incorporated) | 70 | 1.3% |
| Self-Employed (Not Incorporated) | 237 | 4.3% |
| Not-for-profit Organizations | 422 | 7.7% |
| Local Government Employees | 637 | 11.7% |
| State Government Employees | 154 | 2.8% |
| Federal Government Employees | 1,553 | 28.4% |
| Unpaid Family Workers | 8 | 0.2% |
| Total | 5,463 | 100.0% |
Employment Status by Age in Brandywine
According to the labor force statistics for Brandywine, out of the total population over 16 years of age (8,427), 70.6% or 5,949 individuals are in the labor force, with 6.2% or 369 of them unemployed. The age group with the highest labor force participation rate is 45 to 54 years, with 95.7% or 1,529 individuals in the labor force. Within the labor force, the 75 years and over age range has the highest percentage of unemployed individuals, with 45.5% or 10 of them being unemployed.
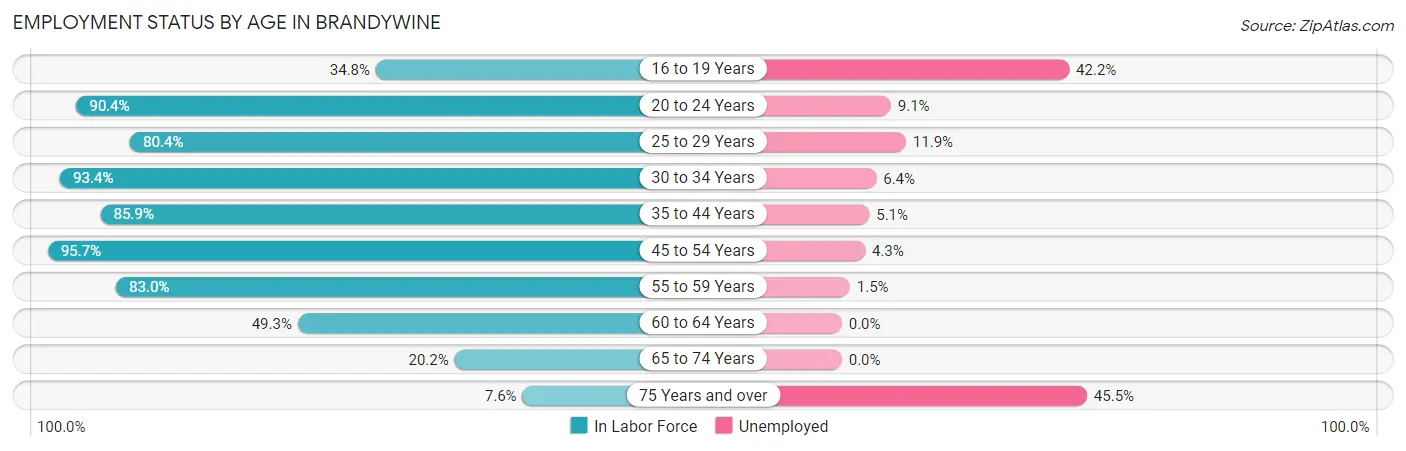
| Age Bracket | In Labor Force | Unemployed |
| 16 to 19 Years | 204 (34.8%) | 86 (42.2%) |
| 20 to 24 Years | 537 (90.4%) | 49 (9.1%) |
| 25 to 29 Years | 336 (80.4%) | 40 (11.9%) |
| 30 to 34 Years | 640 (93.4%) | 41 (6.4%) |
| 35 to 44 Years | 1,264 (85.9%) | 64 (5.1%) |
| 45 to 54 Years | 1,529 (95.7%) | 66 (4.3%) |
| 55 to 59 Years | 805 (83.0%) | 12 (1.5%) |
| 60 to 64 Years | 416 (49.3%) | 0 (0.0%) |
| 65 to 74 Years | 196 (20.2%) | 0 (0.0%) |
| 75 Years and over | 22 (7.6%) | 10 (45.5%) |
| Total | 5,949 (70.6%) | 369 (6.2%) |
Employment Status by Educational Attainment in Brandywine
According to labor force statistics for Brandywine, 83.4% of individuals (4,992) out of the total population between 25 and 64 years of age (5,986) are in the labor force, with 4.4% or 220 of them being unemployed. The group with the highest labor force participation rate are those with the educational attainment of bachelor's degree or higher, with 93.7% or 2,346 individuals in the labor force. Within the labor force, individuals with less than high school education have the highest percentage of unemployment, with 21.3% or 35 of them being unemployed.
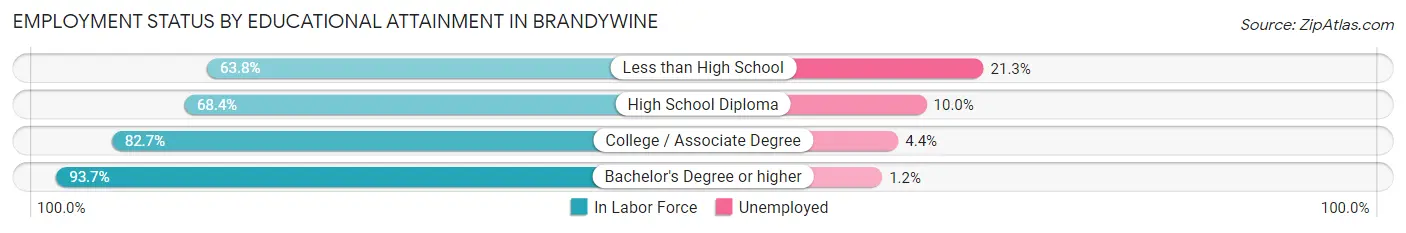
| Educational Attainment | In Labor Force | Unemployed |
| Less than High School | 164 (63.8%) | 55 (21.3%) |
| High School Diploma | 884 (68.4%) | 129 (10.0%) |
| College / Associate Degree | 1,598 (82.7%) | 85 (4.4%) |
| Bachelor's Degree or higher | 2,346 (93.7%) | 30 (1.2%) |
| Total | 4,992 (83.4%) | 263 (4.4%) |
Employment Occupations by Sex in Brandywine
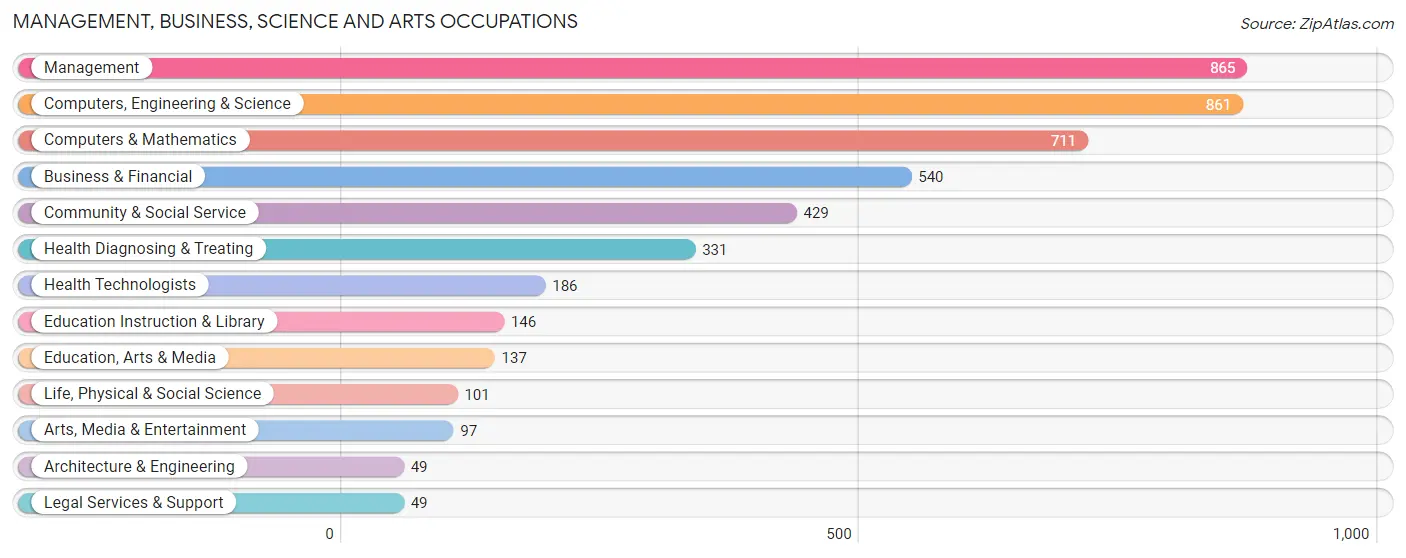
Management, Business, Science and Arts Occupations
The most common Management, Business, Science and Arts occupations in Brandywine are Management (865 | 15.9%), Computers, Engineering & Science (861 | 15.8%), Computers & Mathematics (711 | 13.1%), Business & Financial (540 | 9.9%), and Community & Social Service (429 | 7.9%).
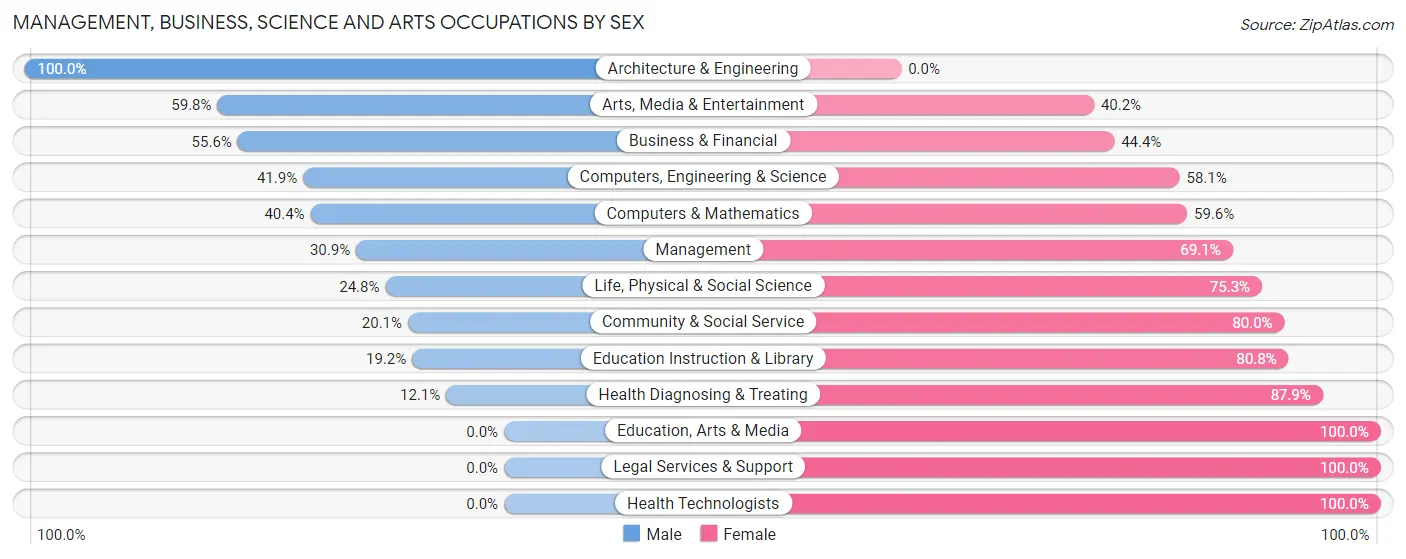
Management, Business, Science and Arts Occupations by Sex
Within the Management, Business, Science and Arts occupations in Brandywine, the most male-oriented occupations are Architecture & Engineering (100.0%), Arts, Media & Entertainment (59.8%), and Business & Financial (55.6%), while the most female-oriented occupations are Education, Arts & Media (100.0%), Legal Services & Support (100.0%), and Health Technologists (100.0%).
| Occupation | Male | Female |
| Management | 267 (30.9%) | 598 (69.1%) |
| Business & Financial | 300 (55.6%) | 240 (44.4%) |
| Computers, Engineering & Science | 361 (41.9%) | 500 (58.1%) |
| Computers & Mathematics | 287 (40.4%) | 424 (59.6%) |
| Architecture & Engineering | 49 (100.0%) | 0 (0.0%) |
| Life, Physical & Social Science | 25 (24.7%) | 76 (75.2%) |
| Community & Social Service | 86 (20.1%) | 343 (79.9%) |
| Education, Arts & Media | 0 (0.0%) | 137 (100.0%) |
| Legal Services & Support | 0 (0.0%) | 49 (100.0%) |
| Education Instruction & Library | 28 (19.2%) | 118 (80.8%) |
| Arts, Media & Entertainment | 58 (59.8%) | 39 (40.2%) |
| Health Diagnosing & Treating | 40 (12.1%) | 291 (87.9%) |
| Health Technologists | 0 (0.0%) | 186 (100.0%) |
| Total (Category) | 1,054 (34.8%) | 1,972 (65.2%) |
| Total (Overall) | 2,522 (46.4%) | 2,918 (53.6%) |
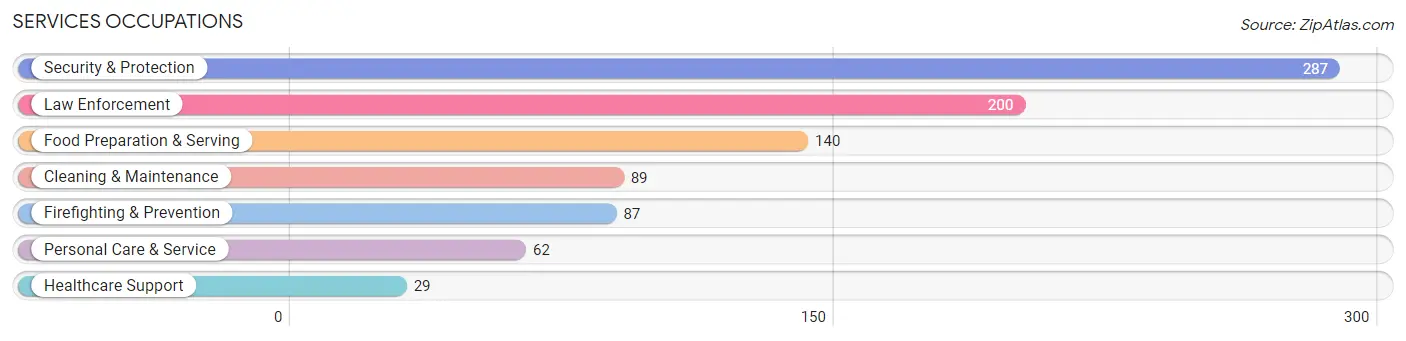
Services Occupations
The most common Services occupations in Brandywine are Security & Protection (287 | 5.3%), Law Enforcement (200 | 3.7%), Food Preparation & Serving (140 | 2.6%), Cleaning & Maintenance (89 | 1.6%), and Firefighting & Prevention (87 | 1.6%).
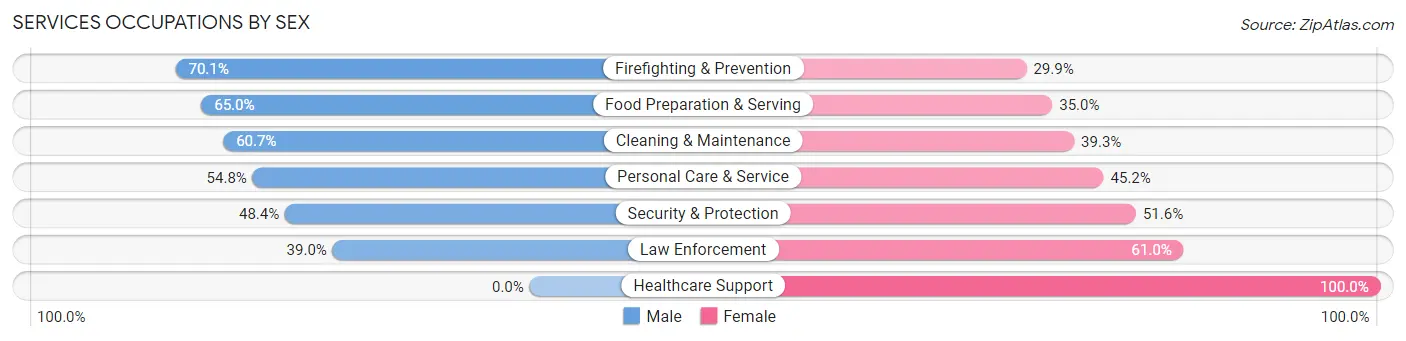
Services Occupations by Sex
Within the Services occupations in Brandywine, the most male-oriented occupations are Firefighting & Prevention (70.1%), Food Preparation & Serving (65.0%), and Cleaning & Maintenance (60.7%), while the most female-oriented occupations are Healthcare Support (100.0%), Law Enforcement (61.0%), and Security & Protection (51.6%).
| Occupation | Male | Female |
| Healthcare Support | 0 (0.0%) | 29 (100.0%) |
| Security & Protection | 139 (48.4%) | 148 (51.6%) |
| Firefighting & Prevention | 61 (70.1%) | 26 (29.9%) |
| Law Enforcement | 78 (39.0%) | 122 (61.0%) |
| Food Preparation & Serving | 91 (65.0%) | 49 (35.0%) |
| Cleaning & Maintenance | 54 (60.7%) | 35 (39.3%) |
| Personal Care & Service | 34 (54.8%) | 28 (45.2%) |
| Total (Category) | 318 (52.4%) | 289 (47.6%) |
| Total (Overall) | 2,522 (46.4%) | 2,918 (53.6%) |
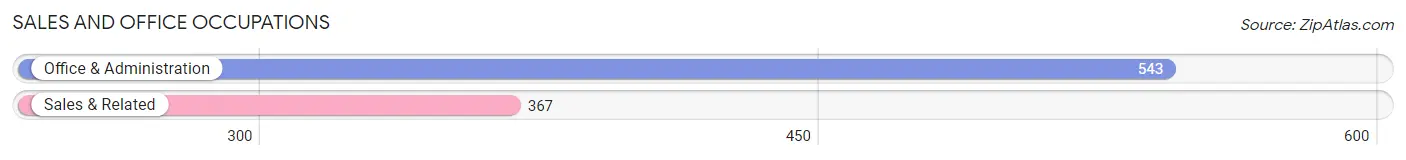
Sales and Office Occupations
The most common Sales and Office occupations in Brandywine are Office & Administration (543 | 10.0%), and Sales & Related (367 | 6.8%).
Sales and Office Occupations by Sex
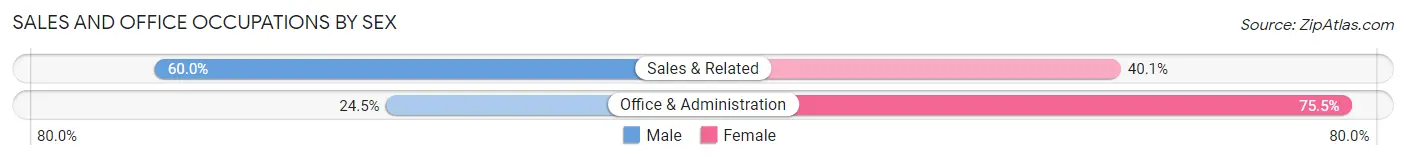
| Occupation | Male | Female |
| Sales & Related | 220 (60.0%) | 147 (40.1%) |
| Office & Administration | 133 (24.5%) | 410 (75.5%) |
| Total (Category) | 353 (38.8%) | 557 (61.2%) |
| Total (Overall) | 2,522 (46.4%) | 2,918 (53.6%) |
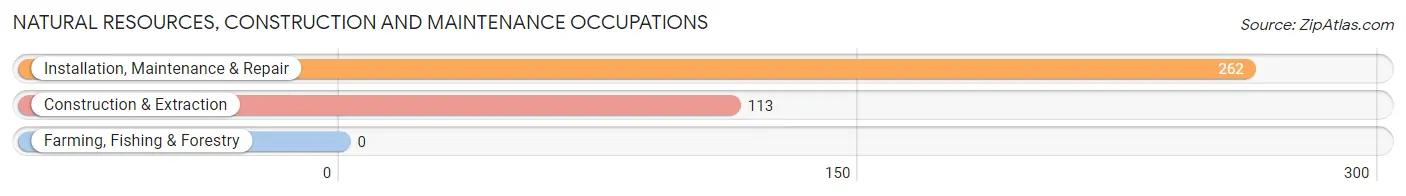
Natural Resources, Construction and Maintenance Occupations
The most common Natural Resources, Construction and Maintenance occupations in Brandywine are Installation, Maintenance & Repair (262 | 4.8%), and Construction & Extraction (113 | 2.1%).
Natural Resources, Construction and Maintenance Occupations by Sex
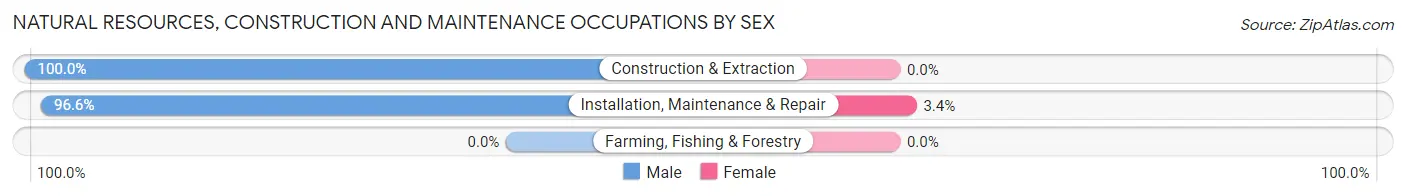
| Occupation | Male | Female |
| Farming, Fishing & Forestry | 0 (0.0%) | 0 (0.0%) |
| Construction & Extraction | 113 (100.0%) | 0 (0.0%) |
| Installation, Maintenance & Repair | 253 (96.6%) | 9 (3.4%) |
| Total (Category) | 366 (97.6%) | 9 (2.4%) |
| Total (Overall) | 2,522 (46.4%) | 2,918 (53.6%) |
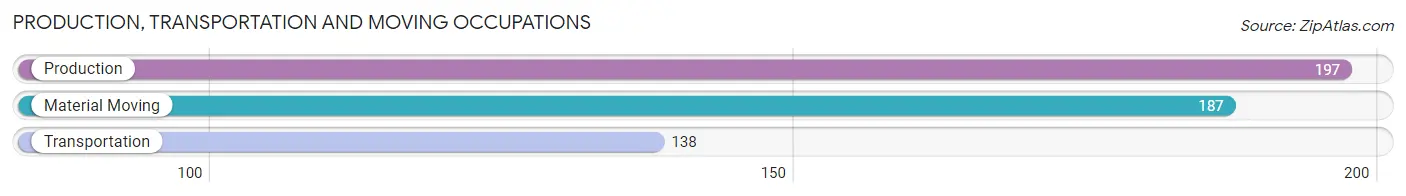
Production, Transportation and Moving Occupations
The most common Production, Transportation and Moving occupations in Brandywine are Production (197 | 3.6%), Material Moving (187 | 3.4%), and Transportation (138 | 2.5%).
Production, Transportation and Moving Occupations by Sex
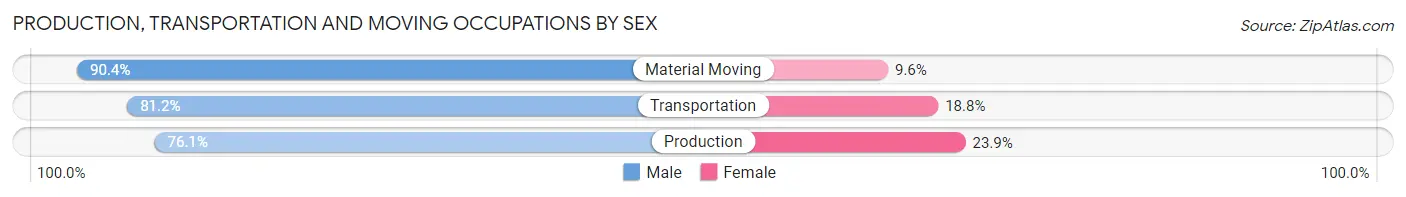
| Occupation | Male | Female |
| Production | 150 (76.1%) | 47 (23.9%) |
| Transportation | 112 (81.2%) | 26 (18.8%) |
| Material Moving | 169 (90.4%) | 18 (9.6%) |
| Total (Category) | 431 (82.6%) | 91 (17.4%) |
| Total (Overall) | 2,522 (46.4%) | 2,918 (53.6%) |
Employment Industries by Sex in Brandywine
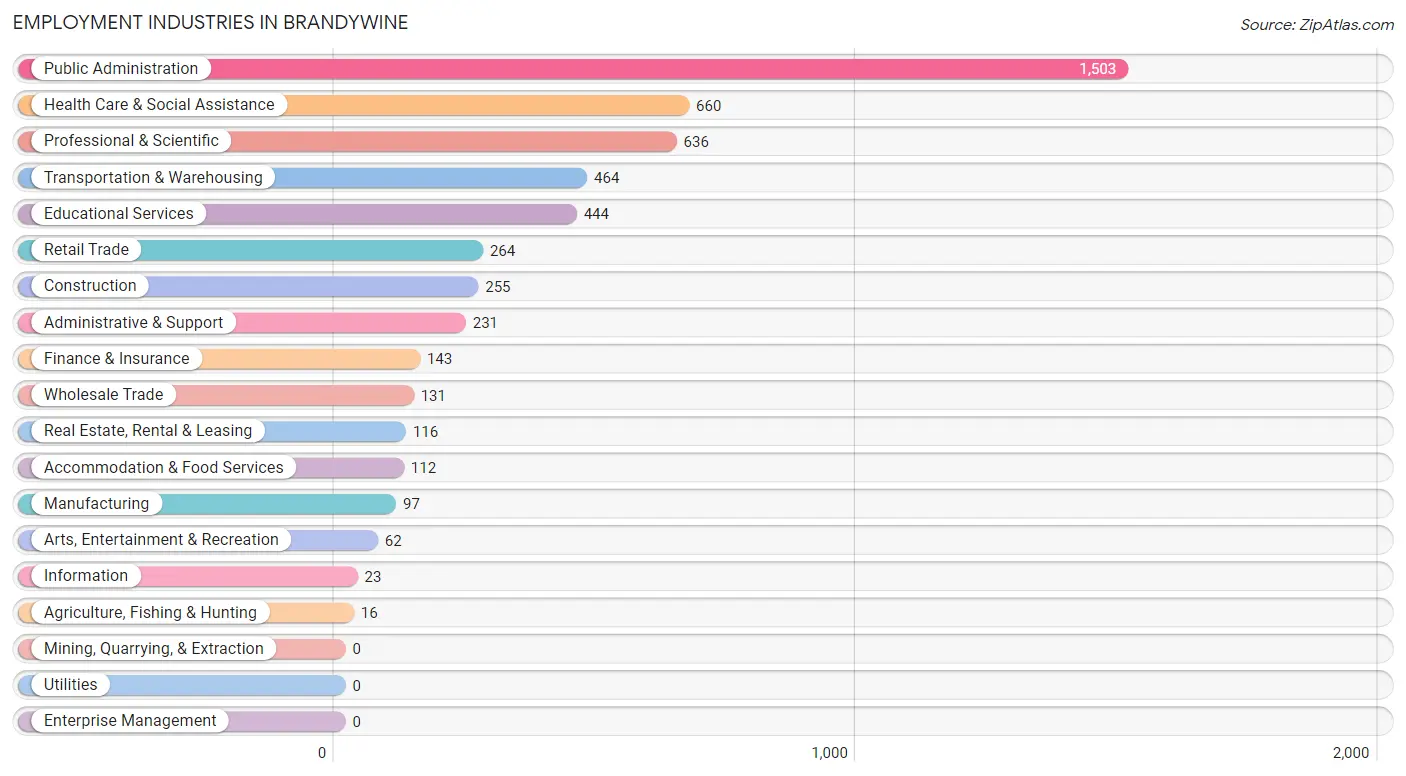
Employment Industries in Brandywine
The major employment industries in Brandywine include Public Administration (1,503 | 27.6%), Health Care & Social Assistance (660 | 12.1%), Professional & Scientific (636 | 11.7%), Transportation & Warehousing (464 | 8.5%), and Educational Services (444 | 8.2%).
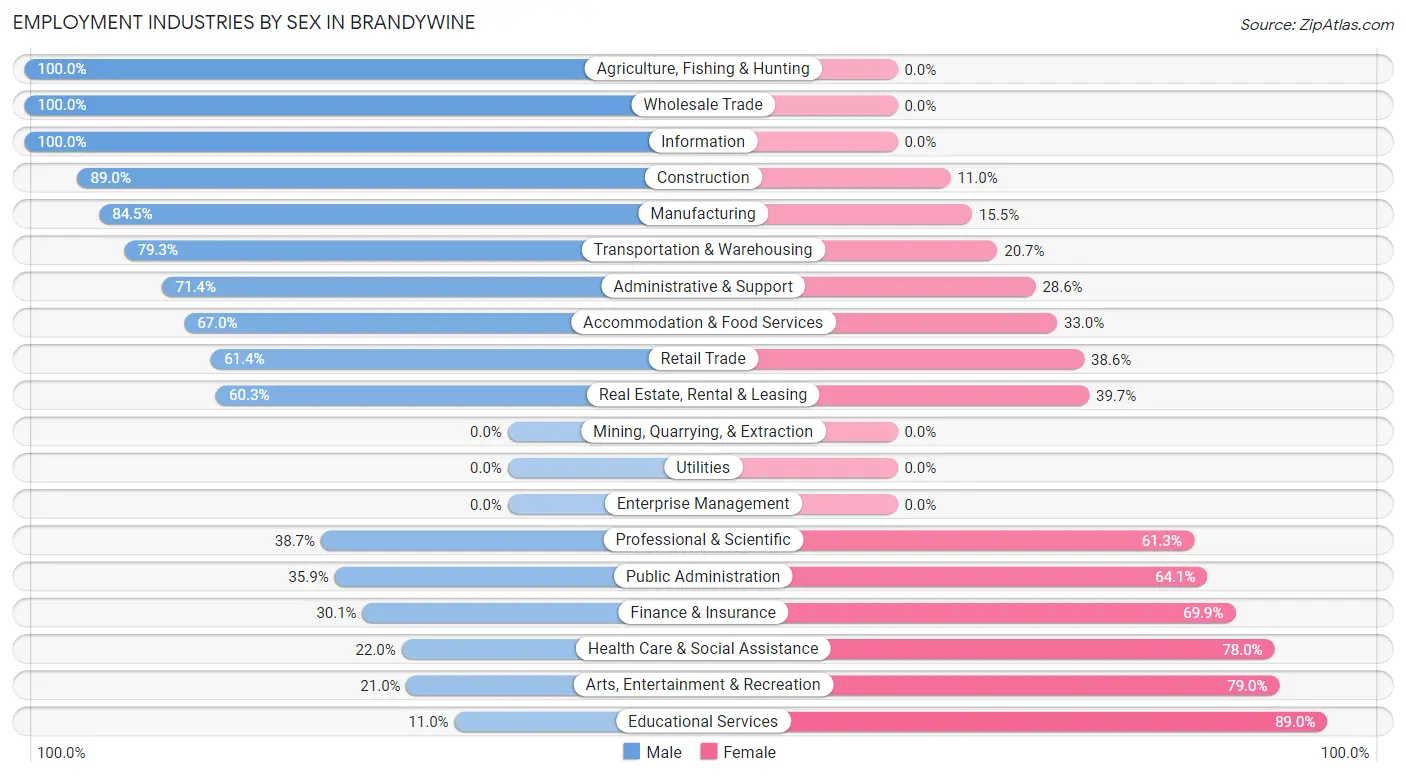
Employment Industries by Sex in Brandywine
The Brandywine industries that see more men than women are Agriculture, Fishing & Hunting (100.0%), Wholesale Trade (100.0%), and Information (100.0%), whereas the industries that tend to have a higher number of women are Educational Services (89.0%), Arts, Entertainment & Recreation (79.0%), and Health Care & Social Assistance (78.0%).
| Industry | Male | Female |
| Agriculture, Fishing & Hunting | 16 (100.0%) | 0 (0.0%) |
| Mining, Quarrying, & Extraction | 0 (0.0%) | 0 (0.0%) |
| Construction | 227 (89.0%) | 28 (11.0%) |
| Manufacturing | 82 (84.5%) | 15 (15.5%) |
| Wholesale Trade | 131 (100.0%) | 0 (0.0%) |
| Retail Trade | 162 (61.4%) | 102 (38.6%) |
| Transportation & Warehousing | 368 (79.3%) | 96 (20.7%) |
| Utilities | 0 (0.0%) | 0 (0.0%) |
| Information | 23 (100.0%) | 0 (0.0%) |
| Finance & Insurance | 43 (30.1%) | 100 (69.9%) |
| Real Estate, Rental & Leasing | 70 (60.3%) | 46 (39.7%) |
| Professional & Scientific | 246 (38.7%) | 390 (61.3%) |
| Enterprise Management | 0 (0.0%) | 0 (0.0%) |
| Administrative & Support | 165 (71.4%) | 66 (28.6%) |
| Educational Services | 49 (11.0%) | 395 (89.0%) |
| Health Care & Social Assistance | 145 (22.0%) | 515 (78.0%) |
| Arts, Entertainment & Recreation | 13 (21.0%) | 49 (79.0%) |
| Accommodation & Food Services | 75 (67.0%) | 37 (33.0%) |
| Public Administration | 539 (35.9%) | 964 (64.1%) |
| Total | 2,522 (46.4%) | 2,918 (53.6%) |
Education in Brandywine
School Enrollment in Brandywine
The most common levels of schooling among the 2,373 students in Brandywine are middle school (612 | 25.8%), high school (550 | 23.2%), and college / undergraduate (404 | 17.0%).
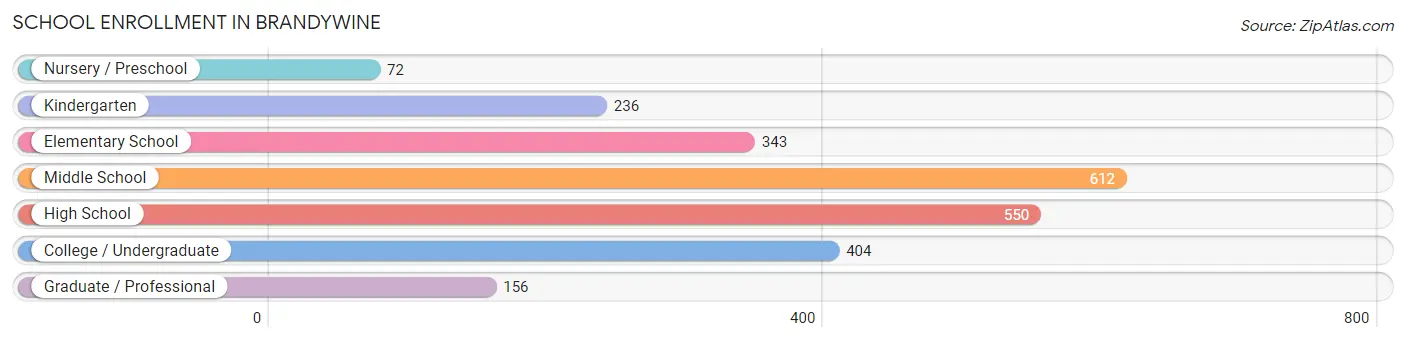
| School Level | # Students | % Students |
| Nursery / Preschool | 72 | 3.0% |
| Kindergarten | 236 | 10.0% |
| Elementary School | 343 | 14.4% |
| Middle School | 612 | 25.8% |
| High School | 550 | 23.2% |
| College / Undergraduate | 404 | 17.0% |
| Graduate / Professional | 156 | 6.6% |
| Total | 2,373 | 100.0% |
School Enrollment by Age by Funding Source in Brandywine
Out of a total of 2,373 students who are enrolled in schools in Brandywine, 522 (22.0%) attend a private institution, while the remaining 1,851 (78.0%) are enrolled in public schools. The age group of 3 to 4 year olds has the highest likelihood of being enrolled in private schools, with 45 (81.8% in the age bracket) enrolled. Conversely, the age group of 20 to 24 year olds has the lowest likelihood of being enrolled in a private school, with 154 (94.5% in the age bracket) attending a public institution.
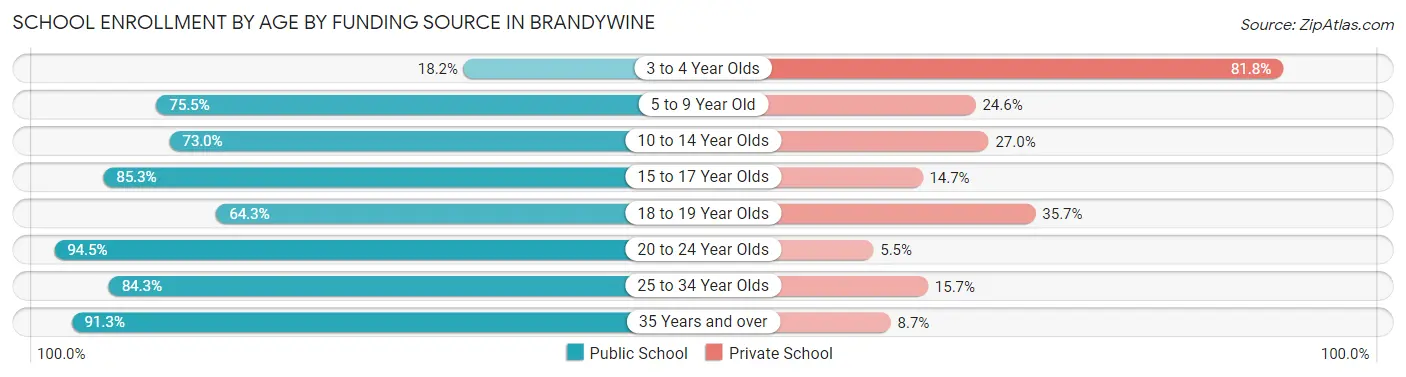
| Age Bracket | Public School | Private School |
| 3 to 4 Year Olds | 10 (18.2%) | 45 (81.8%) |
| 5 to 9 Year Old | 418 (75.4%) | 136 (24.5%) |
| 10 to 14 Year Olds | 490 (73.0%) | 181 (27.0%) |
| 15 to 17 Year Olds | 384 (85.3%) | 66 (14.7%) |
| 18 to 19 Year Olds | 72 (64.3%) | 40 (35.7%) |
| 20 to 24 Year Olds | 154 (94.5%) | 9 (5.5%) |
| 25 to 34 Year Olds | 156 (84.3%) | 29 (15.7%) |
| 35 Years and over | 167 (91.3%) | 16 (8.7%) |
| Total | 1,851 (78.0%) | 522 (22.0%) |
Educational Attainment by Field of Study in Brandywine
Business (750 | 23.5%), science & technology (405 | 12.7%), computers & mathematics (400 | 12.6%), arts & humanities (305 | 9.6%), and education (282 | 8.8%) are the most common fields of study among 3,188 individuals in Brandywine who have obtained a bachelor's degree or higher.
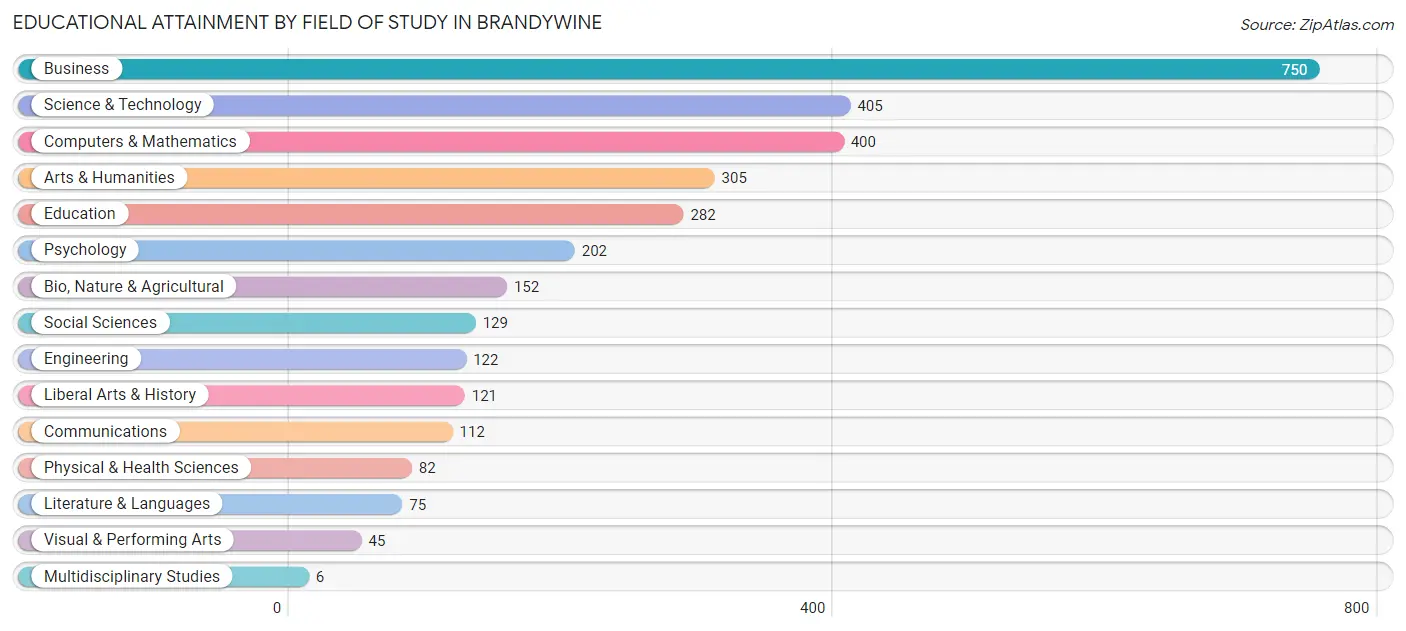
| Field of Study | # Graduates | % Graduates |
| Computers & Mathematics | 400 | 12.6% |
| Bio, Nature & Agricultural | 152 | 4.8% |
| Physical & Health Sciences | 82 | 2.6% |
| Psychology | 202 | 6.3% |
| Social Sciences | 129 | 4.1% |
| Engineering | 122 | 3.8% |
| Multidisciplinary Studies | 6 | 0.2% |
| Science & Technology | 405 | 12.7% |
| Business | 750 | 23.5% |
| Education | 282 | 8.8% |
| Literature & Languages | 75 | 2.4% |
| Liberal Arts & History | 121 | 3.8% |
| Visual & Performing Arts | 45 | 1.4% |
| Communications | 112 | 3.5% |
| Arts & Humanities | 305 | 9.6% |
| Total | 3,188 | 100.0% |
Transportation & Commute in Brandywine
Vehicle Availability by Sex in Brandywine
The most prevalent vehicle ownership categories in Brandywine are males with 2 vehicles (1,045, accounting for 41.0%) and females with 2 vehicles (814, making up 35.8%).
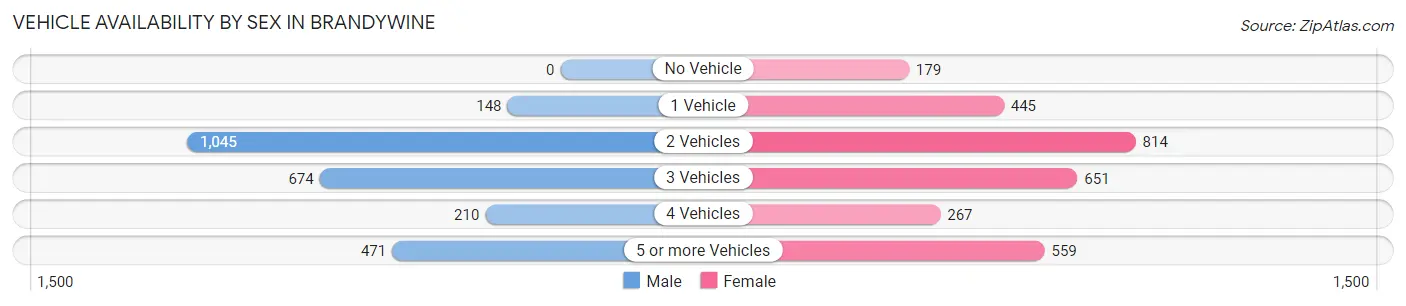
| Vehicles Available | Male | Female |
| No Vehicle | 0 (0.0%) | 179 (6.1%) |
| 1 Vehicle | 148 (5.8%) | 445 (15.3%) |
| 2 Vehicles | 1,045 (41.0%) | 814 (27.9%) |
| 3 Vehicles | 674 (26.5%) | 651 (22.3%) |
| 4 Vehicles | 210 (8.2%) | 267 (9.2%) |
| 5 or more Vehicles | 471 (18.5%) | 559 (19.2%) |
| Total | 2,548 (100.0%) | 2,915 (100.0%) |
Commute Time in Brandywine
The most frequently occuring commute durations in Brandywine are 45 to 59 minutes (971 commuters, 22.1%), 60 to 89 minutes (843 commuters, 19.2%), and 30 to 34 minutes (613 commuters, 14.0%).
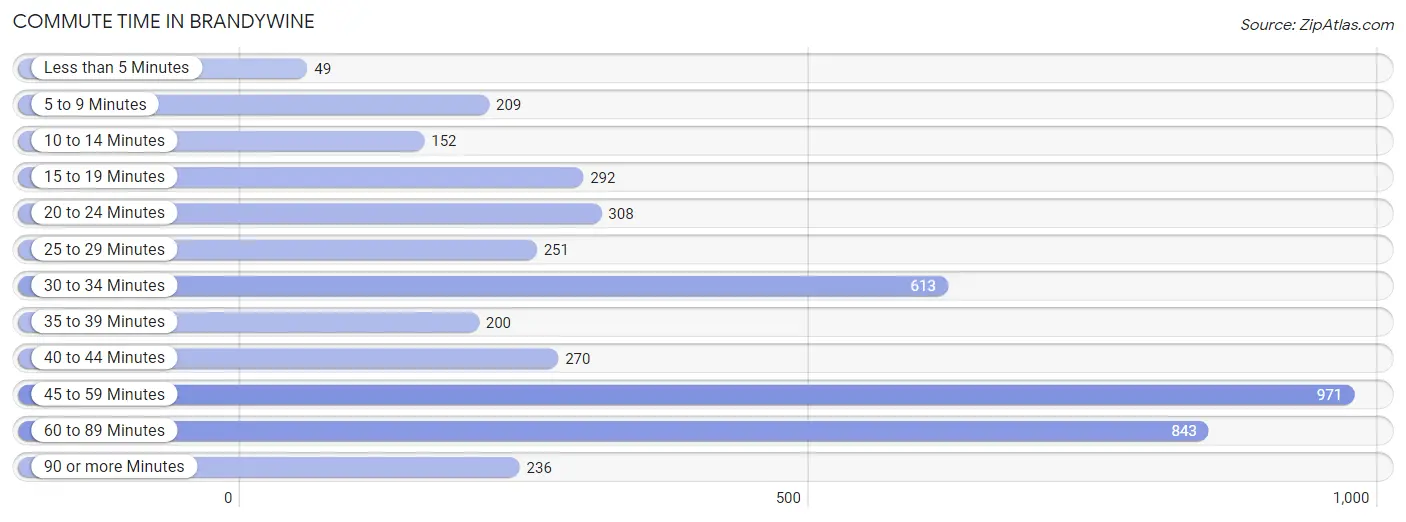
| Commute Time | # Commuters | % Commuters |
| Less than 5 Minutes | 49 | 1.1% |
| 5 to 9 Minutes | 209 | 4.8% |
| 10 to 14 Minutes | 152 | 3.5% |
| 15 to 19 Minutes | 292 | 6.7% |
| 20 to 24 Minutes | 308 | 7.0% |
| 25 to 29 Minutes | 251 | 5.7% |
| 30 to 34 Minutes | 613 | 14.0% |
| 35 to 39 Minutes | 200 | 4.5% |
| 40 to 44 Minutes | 270 | 6.1% |
| 45 to 59 Minutes | 971 | 22.1% |
| 60 to 89 Minutes | 843 | 19.2% |
| 90 or more Minutes | 236 | 5.4% |
Commute Time by Sex in Brandywine
The most common commute times in Brandywine are 45 to 59 minutes (553 commuters, 25.8%) for males and 60 to 89 minutes (505 commuters, 22.5%) for females.
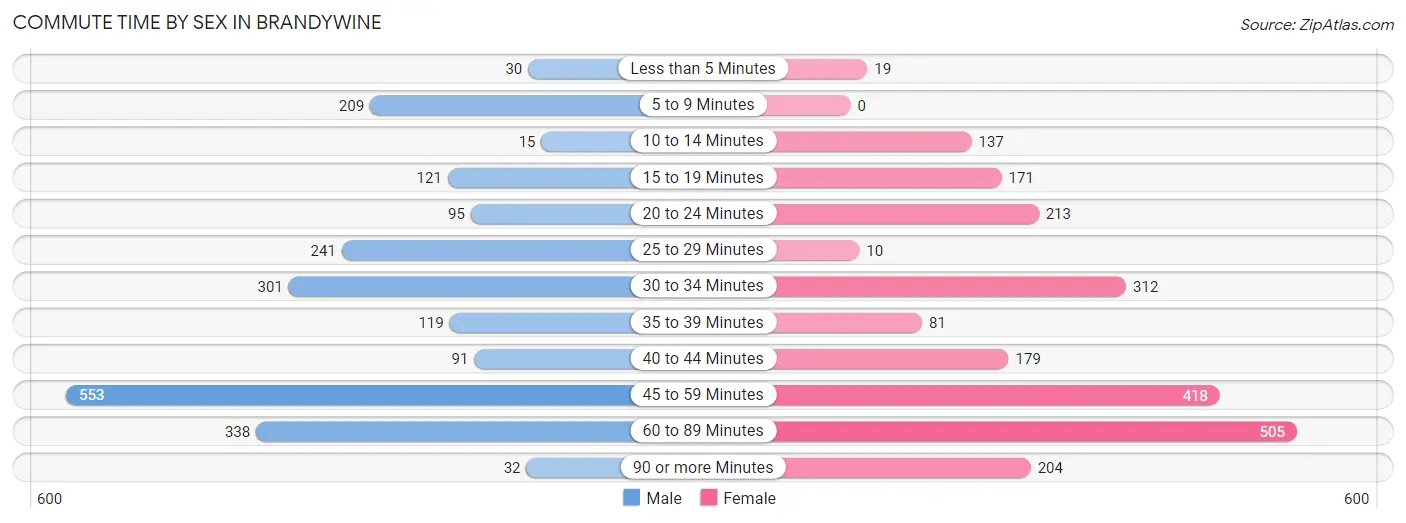
| Commute Time | Male | Female |
| Less than 5 Minutes | 30 (1.4%) | 19 (0.8%) |
| 5 to 9 Minutes | 209 (9.7%) | 0 (0.0%) |
| 10 to 14 Minutes | 15 (0.7%) | 137 (6.1%) |
| 15 to 19 Minutes | 121 (5.6%) | 171 (7.6%) |
| 20 to 24 Minutes | 95 (4.4%) | 213 (9.5%) |
| 25 to 29 Minutes | 241 (11.2%) | 10 (0.4%) |
| 30 to 34 Minutes | 301 (14.0%) | 312 (13.9%) |
| 35 to 39 Minutes | 119 (5.6%) | 81 (3.6%) |
| 40 to 44 Minutes | 91 (4.2%) | 179 (8.0%) |
| 45 to 59 Minutes | 553 (25.8%) | 418 (18.6%) |
| 60 to 89 Minutes | 338 (15.8%) | 505 (22.5%) |
| 90 or more Minutes | 32 (1.5%) | 204 (9.1%) |
Time of Departure to Work by Sex in Brandywine
The most frequent times of departure to work in Brandywine are 7:00 AM to 7:29 AM (324, 15.1%) for males and 6:30 AM to 6:59 AM (410, 18.2%) for females.
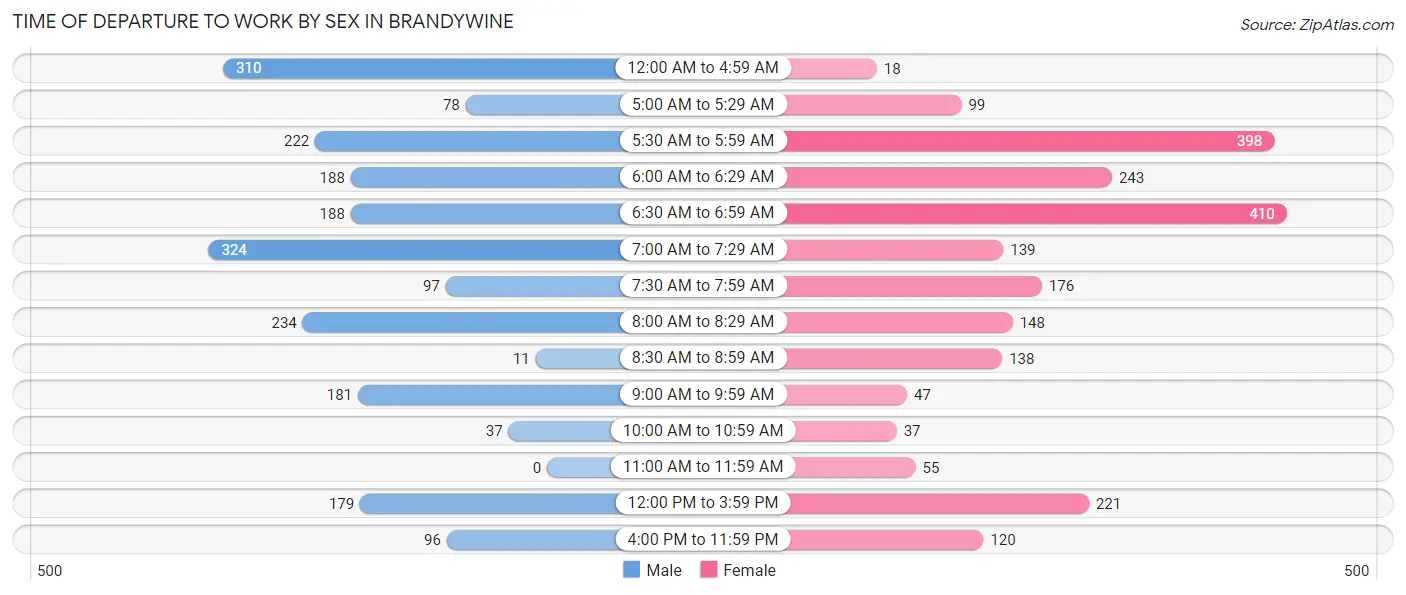
| Time of Departure | Male | Female |
| 12:00 AM to 4:59 AM | 310 (14.4%) | 18 (0.8%) |
| 5:00 AM to 5:29 AM | 78 (3.6%) | 99 (4.4%) |
| 5:30 AM to 5:59 AM | 222 (10.3%) | 398 (17.7%) |
| 6:00 AM to 6:29 AM | 188 (8.8%) | 243 (10.8%) |
| 6:30 AM to 6:59 AM | 188 (8.8%) | 410 (18.2%) |
| 7:00 AM to 7:29 AM | 324 (15.1%) | 139 (6.2%) |
| 7:30 AM to 7:59 AM | 97 (4.5%) | 176 (7.8%) |
| 8:00 AM to 8:29 AM | 234 (10.9%) | 148 (6.6%) |
| 8:30 AM to 8:59 AM | 11 (0.5%) | 138 (6.1%) |
| 9:00 AM to 9:59 AM | 181 (8.4%) | 47 (2.1%) |
| 10:00 AM to 10:59 AM | 37 (1.7%) | 37 (1.7%) |
| 11:00 AM to 11:59 AM | 0 (0.0%) | 55 (2.5%) |
| 12:00 PM to 3:59 PM | 179 (8.3%) | 221 (9.8%) |
| 4:00 PM to 11:59 PM | 96 (4.5%) | 120 (5.3%) |
| Total | 2,145 (100.0%) | 2,249 (100.0%) |
Housing Occupancy in Brandywine
Occupancy by Ownership in Brandywine
Of the total 3,389 dwellings in Brandywine, owner-occupied units account for 3,234 (95.4%), while renter-occupied units make up 155 (4.6%).
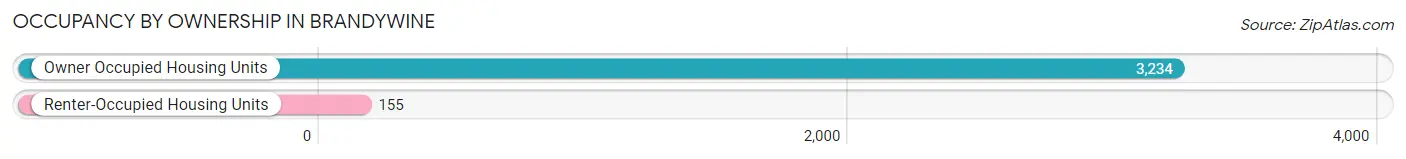
| Occupancy | # Housing Units | % Housing Units |
| Owner Occupied Housing Units | 3,234 | 95.4% |
| Renter-Occupied Housing Units | 155 | 4.6% |
| Total Occupied Housing Units | 3,389 | 100.0% |
Occupancy by Household Size in Brandywine
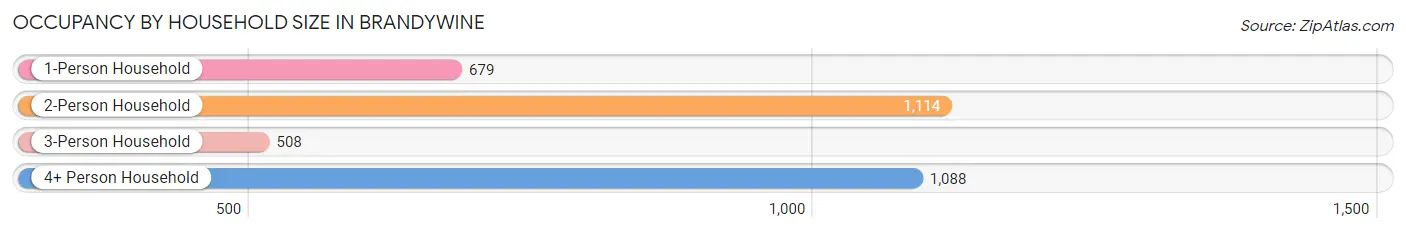
| Household Size | # Housing Units | % Housing Units |
| 1-Person Household | 679 | 20.0% |
| 2-Person Household | 1,114 | 32.9% |
| 3-Person Household | 508 | 15.0% |
| 4+ Person Household | 1,088 | 32.1% |
| Total Housing Units | 3,389 | 100.0% |
Occupancy by Ownership by Household Size in Brandywine
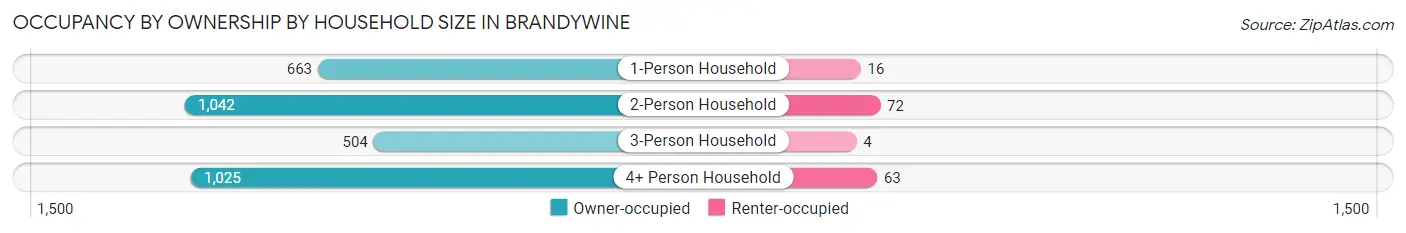
| Household Size | Owner-occupied | Renter-occupied |
| 1-Person Household | 663 (97.6%) | 16 (2.4%) |
| 2-Person Household | 1,042 (93.5%) | 72 (6.5%) |
| 3-Person Household | 504 (99.2%) | 4 (0.8%) |
| 4+ Person Household | 1,025 (94.2%) | 63 (5.8%) |
| Total Housing Units | 3,234 (95.4%) | 155 (4.6%) |
Occupancy by Educational Attainment in Brandywine
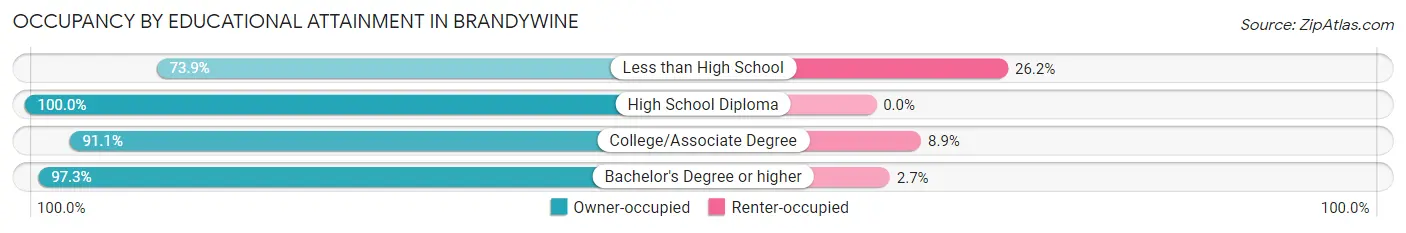
| Household Size | Owner-occupied | Renter-occupied |
| Less than High School | 48 (73.9%) | 17 (26.2%) |
| High School Diploma | 643 (100.0%) | 0 (0.0%) |
| College/Associate Degree | 961 (91.1%) | 94 (8.9%) |
| Bachelor's Degree or higher | 1,582 (97.3%) | 44 (2.7%) |
Occupancy by Age of Householder in Brandywine
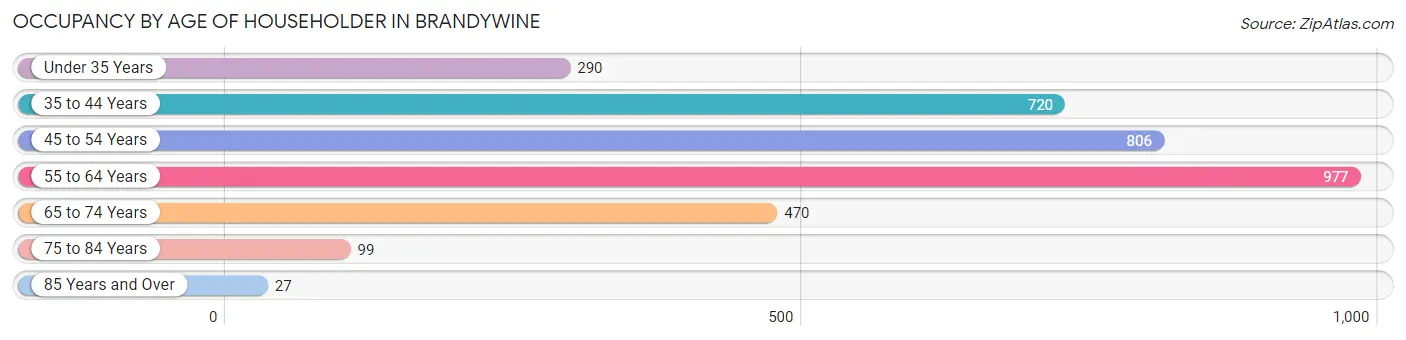
| Age Bracket | # Households | % Households |
| Under 35 Years | 290 | 8.6% |
| 35 to 44 Years | 720 | 21.2% |
| 45 to 54 Years | 806 | 23.8% |
| 55 to 64 Years | 977 | 28.8% |
| 65 to 74 Years | 470 | 13.9% |
| 75 to 84 Years | 99 | 2.9% |
| 85 Years and Over | 27 | 0.8% |
| Total | 3,389 | 100.0% |
Housing Finances in Brandywine
Median Income by Occupancy in Brandywine
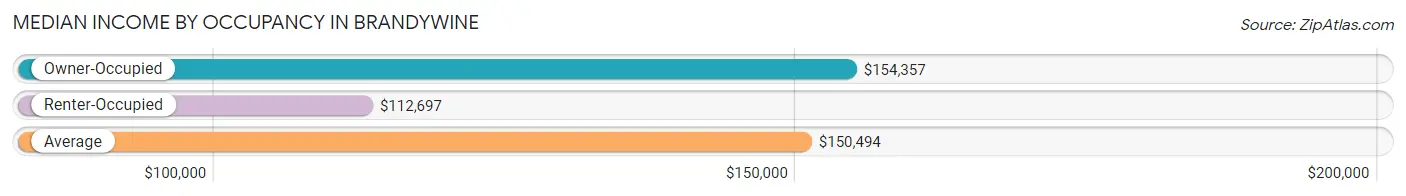
| Occupancy Type | # Households | Median Income |
| Owner-Occupied | 3,234 (95.4%) | $154,357 |
| Renter-Occupied | 155 (4.6%) | $112,697 |
| Average | 3,389 (100.0%) | $150,494 |
Occupancy by Householder Income Bracket in Brandywine
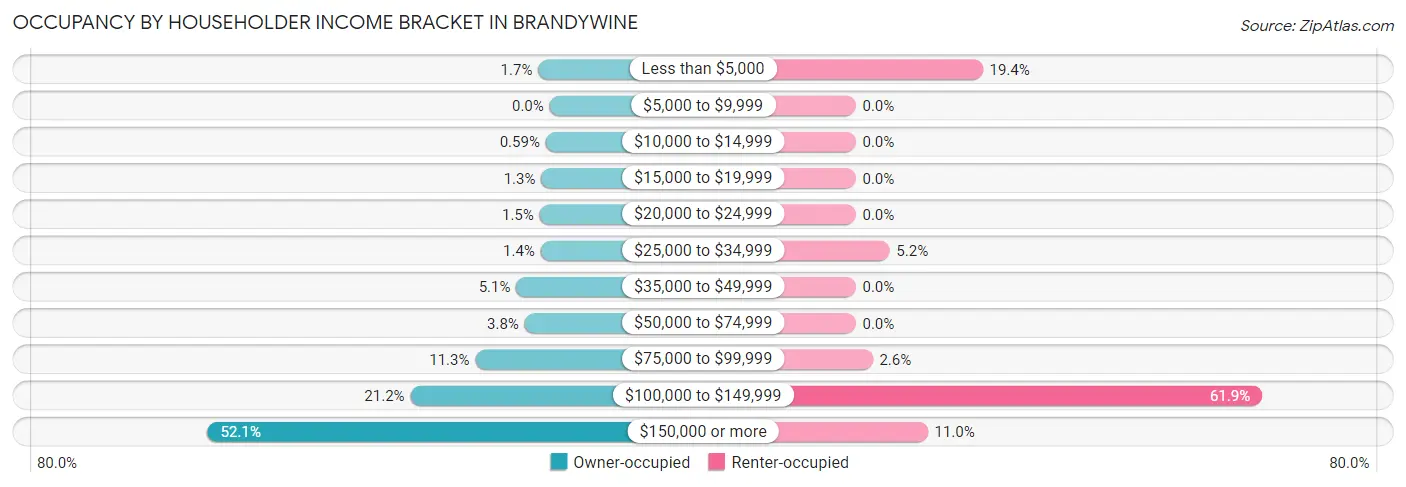
| Income Bracket | Owner-occupied | Renter-occupied |
| Less than $5,000 | 56 (1.7%) | 30 (19.4%) |
| $5,000 to $9,999 | 0 (0.0%) | 0 (0.0%) |
| $10,000 to $14,999 | 19 (0.6%) | 0 (0.0%) |
| $15,000 to $19,999 | 41 (1.3%) | 0 (0.0%) |
| $20,000 to $24,999 | 49 (1.5%) | 0 (0.0%) |
| $25,000 to $34,999 | 44 (1.4%) | 8 (5.2%) |
| $35,000 to $49,999 | 164 (5.1%) | 0 (0.0%) |
| $50,000 to $74,999 | 123 (3.8%) | 0 (0.0%) |
| $75,000 to $99,999 | 366 (11.3%) | 4 (2.6%) |
| $100,000 to $149,999 | 686 (21.2%) | 96 (61.9%) |
| $150,000 or more | 1,686 (52.1%) | 17 (11.0%) |
| Total | 3,234 (100.0%) | 155 (100.0%) |
Monthly Housing Cost Tiers in Brandywine
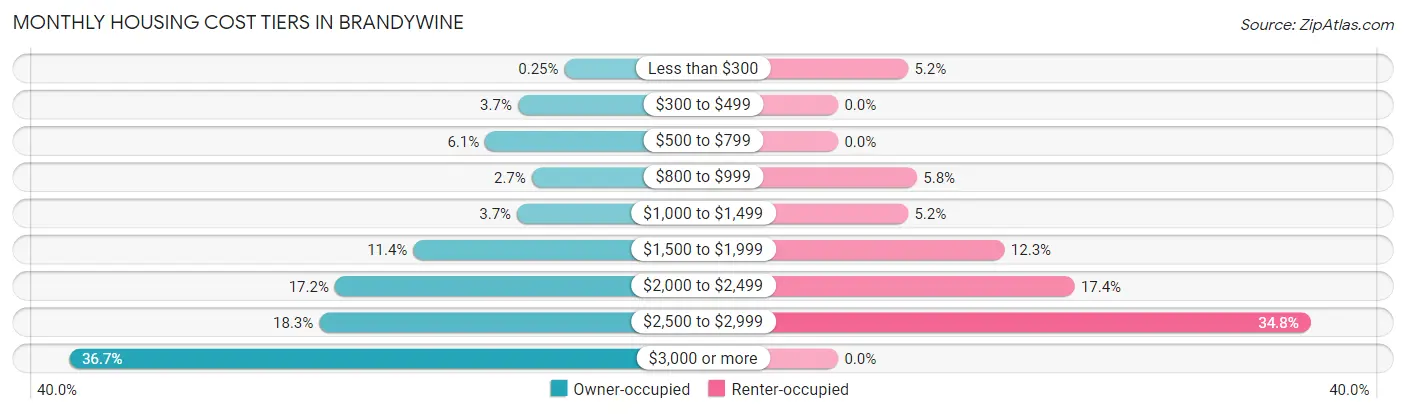
| Monthly Cost | Owner-occupied | Renter-occupied |
| Less than $300 | 8 (0.3%) | 8 (5.2%) |
| $300 to $499 | 119 (3.7%) | 0 (0.0%) |
| $500 to $799 | 197 (6.1%) | 0 (0.0%) |
| $800 to $999 | 86 (2.7%) | 9 (5.8%) |
| $1,000 to $1,499 | 121 (3.7%) | 8 (5.2%) |
| $1,500 to $1,999 | 368 (11.4%) | 19 (12.3%) |
| $2,000 to $2,499 | 555 (17.2%) | 27 (17.4%) |
| $2,500 to $2,999 | 592 (18.3%) | 54 (34.8%) |
| $3,000 or more | 1,188 (36.7%) | 0 (0.0%) |
| Total | 3,234 (100.0%) | 155 (100.0%) |
Physical Housing Characteristics in Brandywine
Housing Structures in Brandywine
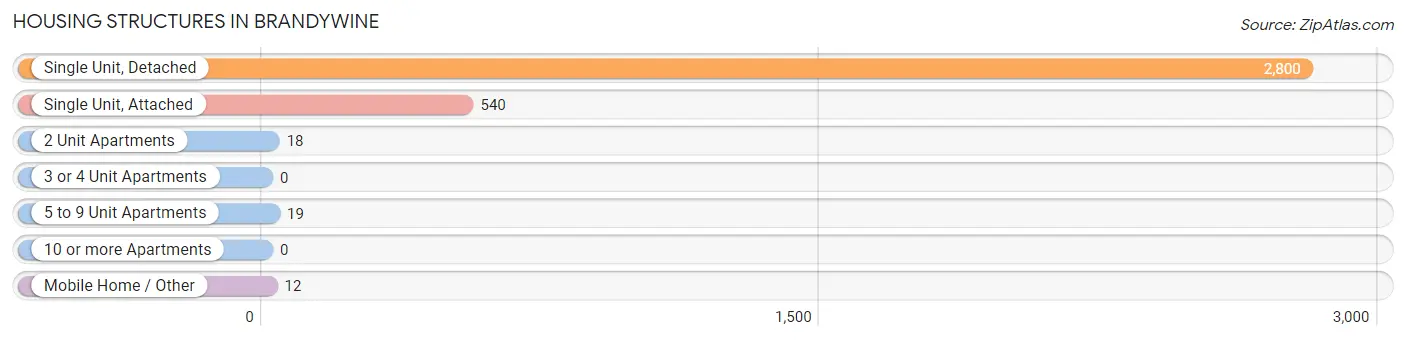
| Structure Type | # Housing Units | % Housing Units |
| Single Unit, Detached | 2,800 | 82.6% |
| Single Unit, Attached | 540 | 15.9% |
| 2 Unit Apartments | 18 | 0.5% |
| 3 or 4 Unit Apartments | 0 | 0.0% |
| 5 to 9 Unit Apartments | 19 | 0.6% |
| 10 or more Apartments | 0 | 0.0% |
| Mobile Home / Other | 12 | 0.4% |
| Total | 3,389 | 100.0% |
Housing Structures by Occupancy in Brandywine
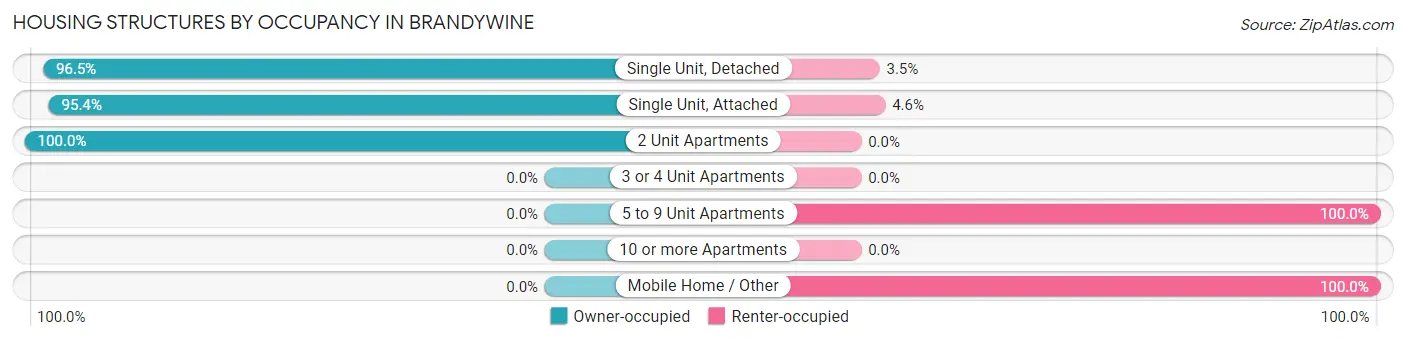
| Structure Type | Owner-occupied | Renter-occupied |
| Single Unit, Detached | 2,701 (96.5%) | 99 (3.5%) |
| Single Unit, Attached | 515 (95.4%) | 25 (4.6%) |
| 2 Unit Apartments | 18 (100.0%) | 0 (0.0%) |
| 3 or 4 Unit Apartments | 0 (0.0%) | 0 (0.0%) |
| 5 to 9 Unit Apartments | 0 (0.0%) | 19 (100.0%) |
| 10 or more Apartments | 0 (0.0%) | 0 (0.0%) |
| Mobile Home / Other | 0 (0.0%) | 12 (100.0%) |
| Total | 3,234 (95.4%) | 155 (4.6%) |
Housing Structures by Number of Rooms in Brandywine
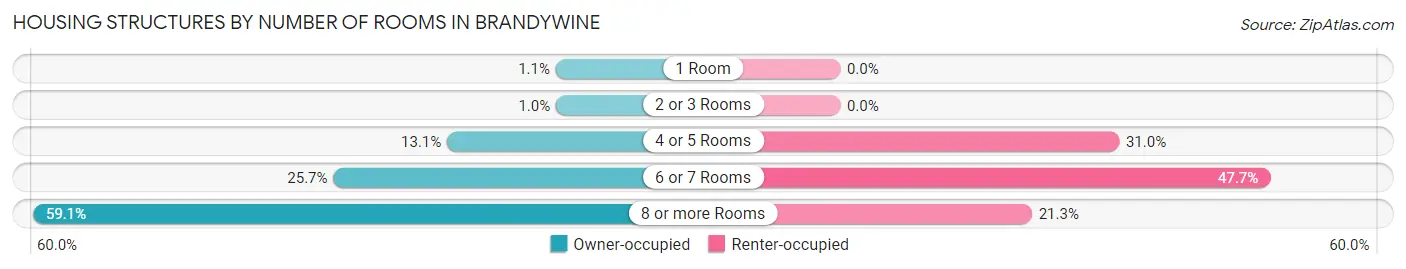
| Number of Rooms | Owner-occupied | Renter-occupied |
| 1 Room | 34 (1.1%) | 0 (0.0%) |
| 2 or 3 Rooms | 33 (1.0%) | 0 (0.0%) |
| 4 or 5 Rooms | 424 (13.1%) | 48 (31.0%) |
| 6 or 7 Rooms | 832 (25.7%) | 74 (47.7%) |
| 8 or more Rooms | 1,911 (59.1%) | 33 (21.3%) |
| Total | 3,234 (100.0%) | 155 (100.0%) |
Housing Structure by Heating Type in Brandywine
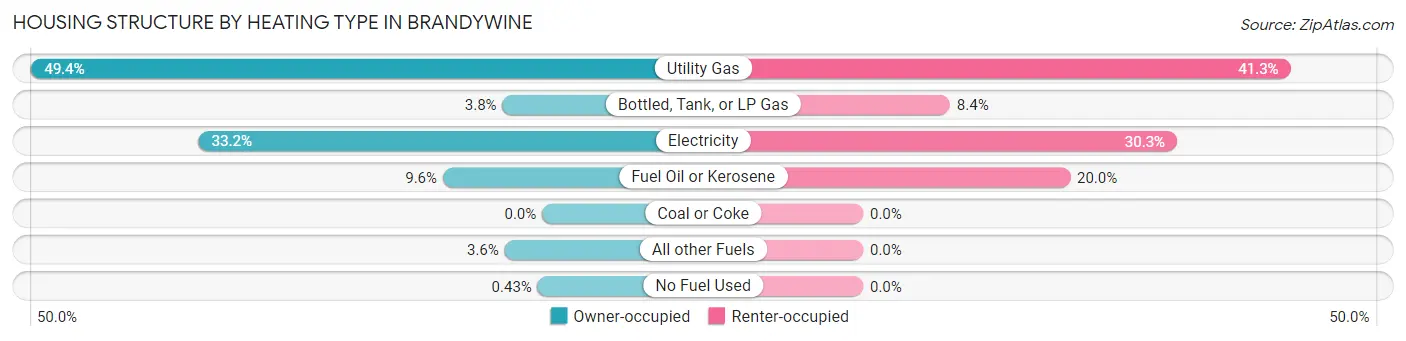
| Heating Type | Owner-occupied | Renter-occupied |
| Utility Gas | 1,596 (49.3%) | 64 (41.3%) |
| Bottled, Tank, or LP Gas | 124 (3.8%) | 13 (8.4%) |
| Electricity | 1,073 (33.2%) | 47 (30.3%) |
| Fuel Oil or Kerosene | 310 (9.6%) | 31 (20.0%) |
| Coal or Coke | 0 (0.0%) | 0 (0.0%) |
| All other Fuels | 117 (3.6%) | 0 (0.0%) |
| No Fuel Used | 14 (0.4%) | 0 (0.0%) |
| Total | 3,234 (100.0%) | 155 (100.0%) |
Household Vehicle Usage in Brandywine
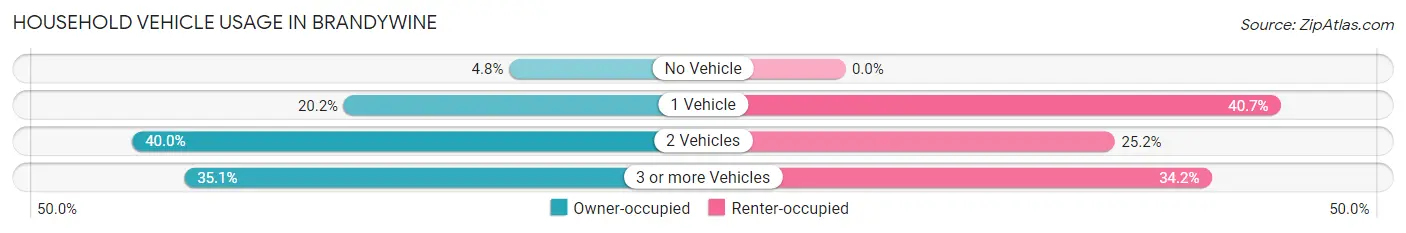
| Vehicles per Household | Owner-occupied | Renter-occupied |
| No Vehicle | 154 (4.8%) | 0 (0.0%) |
| 1 Vehicle | 653 (20.2%) | 63 (40.6%) |
| 2 Vehicles | 1,292 (40.0%) | 39 (25.2%) |
| 3 or more Vehicles | 1,135 (35.1%) | 53 (34.2%) |
| Total | 3,234 (100.0%) | 155 (100.0%) |
Real Estate & Mortgages in Brandywine
Real Estate and Mortgage Overview in Brandywine
| Characteristic | Without Mortgage | With Mortgage |
| Housing Units | 432 | 2,802 |
| Median Property Value | $482,100 | $502,200 |
| Median Household Income | $96,974 | $1,561 |
| Monthly Housing Costs | $785 | $1,188 |
| Real Estate Taxes | $5,393 | $122 |
Property Value by Mortgage Status in Brandywine
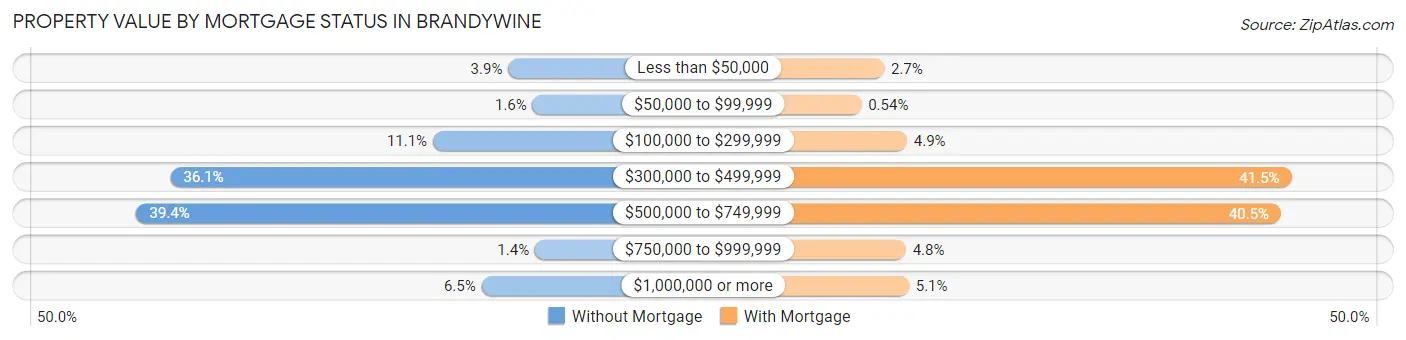
| Property Value | Without Mortgage | With Mortgage |
| Less than $50,000 | 17 (3.9%) | 76 (2.7%) |
| $50,000 to $99,999 | 7 (1.6%) | 15 (0.5%) |
| $100,000 to $299,999 | 48 (11.1%) | 137 (4.9%) |
| $300,000 to $499,999 | 156 (36.1%) | 1,163 (41.5%) |
| $500,000 to $749,999 | 170 (39.4%) | 1,135 (40.5%) |
| $750,000 to $999,999 | 6 (1.4%) | 134 (4.8%) |
| $1,000,000 or more | 28 (6.5%) | 142 (5.1%) |
| Total | 432 (100.0%) | 2,802 (100.0%) |
Household Income by Mortgage Status in Brandywine
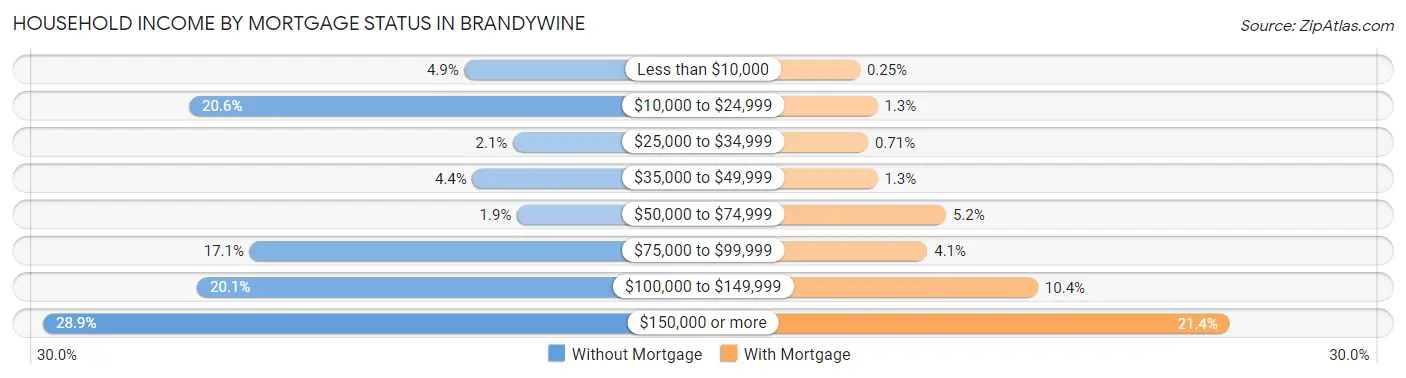
| Household Income | Without Mortgage | With Mortgage |
| Less than $10,000 | 21 (4.9%) | 7 (0.3%) |
| $10,000 to $24,999 | 89 (20.6%) | 35 (1.3%) |
| $25,000 to $34,999 | 9 (2.1%) | 20 (0.7%) |
| $35,000 to $49,999 | 19 (4.4%) | 35 (1.3%) |
| $50,000 to $74,999 | 8 (1.8%) | 145 (5.2%) |
| $75,000 to $99,999 | 74 (17.1%) | 115 (4.1%) |
| $100,000 to $149,999 | 87 (20.1%) | 292 (10.4%) |
| $150,000 or more | 125 (28.9%) | 599 (21.4%) |
| Total | 432 (100.0%) | 2,802 (100.0%) |
Property Value to Household Income Ratio in Brandywine
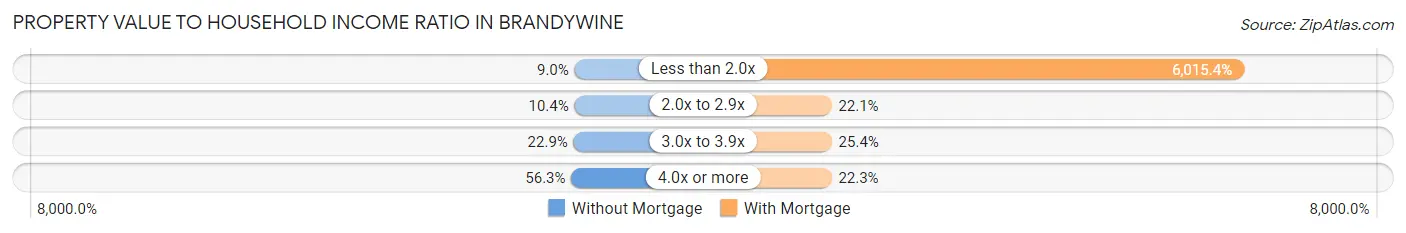
| Value-to-Income Ratio | Without Mortgage | With Mortgage |
| Less than 2.0x | 39 (9.0%) | 168,550 (6,015.4%) |
| 2.0x to 2.9x | 45 (10.4%) | 619 (22.1%) |
| 3.0x to 3.9x | 99 (22.9%) | 712 (25.4%) |
| 4.0x or more | 243 (56.2%) | 625 (22.3%) |
| Total | 432 (100.0%) | 2,802 (100.0%) |
Real Estate Taxes by Mortgage Status in Brandywine
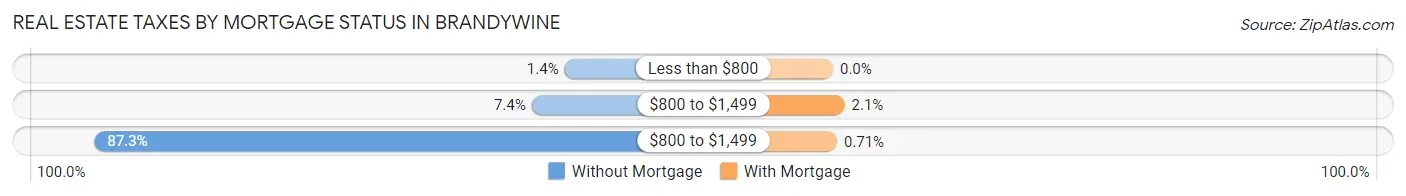
| Property Taxes | Without Mortgage | With Mortgage |
| Less than $800 | 6 (1.4%) | 0 (0.0%) |
| $800 to $1,499 | 32 (7.4%) | 59 (2.1%) |
| $800 to $1,499 | 377 (87.3%) | 20 (0.7%) |
| Total | 432 (100.0%) | 2,802 (100.0%) |
Health & Disability in Brandywine
Health Insurance Coverage by Age in Brandywine
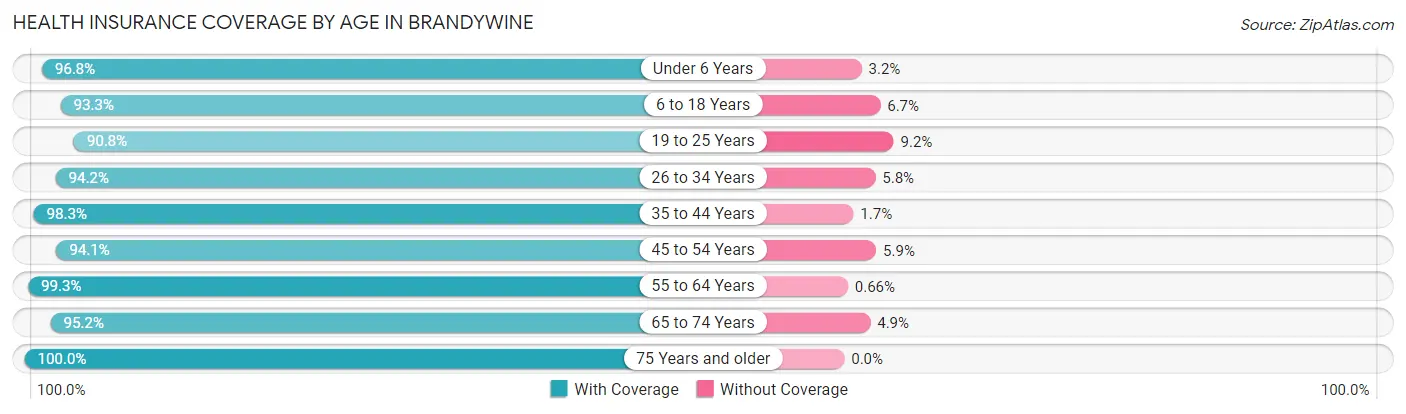
| Age Bracket | With Coverage | Without Coverage |
| Under 6 Years | 541 (96.8%) | 18 (3.2%) |
| 6 to 18 Years | 1,516 (93.3%) | 109 (6.7%) |
| 19 to 25 Years | 692 (90.8%) | 70 (9.2%) |
| 26 to 34 Years | 798 (94.2%) | 49 (5.8%) |
| 35 to 44 Years | 1,446 (98.3%) | 25 (1.7%) |
| 45 to 54 Years | 1,503 (94.1%) | 95 (5.9%) |
| 55 to 64 Years | 1,802 (99.3%) | 12 (0.7%) |
| 65 to 74 Years | 923 (95.2%) | 47 (4.9%) |
| 75 Years and older | 291 (100.0%) | 0 (0.0%) |
| Total | 9,512 (95.7%) | 425 (4.3%) |
Health Insurance Coverage by Citizenship Status in Brandywine
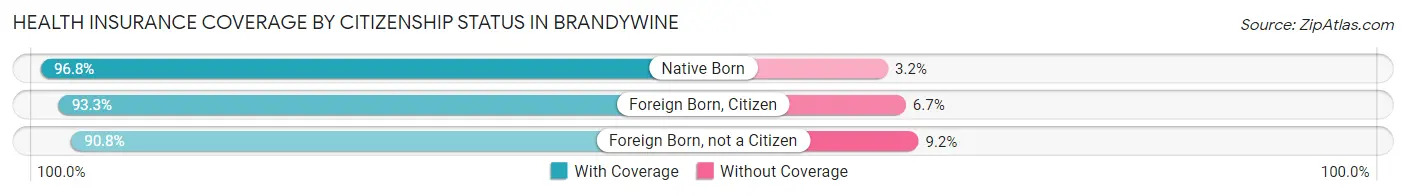
| Citizenship Status | With Coverage | Without Coverage |
| Native Born | 541 (96.8%) | 18 (3.2%) |
| Foreign Born, Citizen | 1,516 (93.3%) | 109 (6.7%) |
| Foreign Born, not a Citizen | 692 (90.8%) | 70 (9.2%) |
Health Insurance Coverage by Household Income in Brandywine
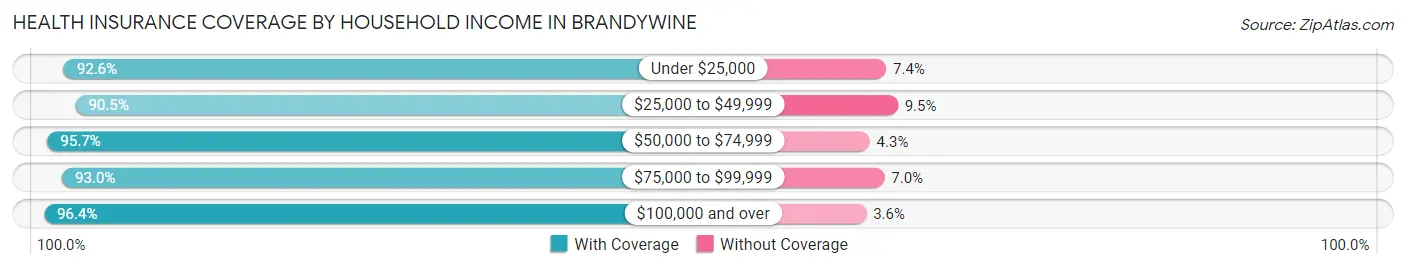
| Household Income | With Coverage | Without Coverage |
| Under $25,000 | 478 (92.6%) | 38 (7.4%) |
| $25,000 to $49,999 | 237 (90.5%) | 25 (9.5%) |
| $50,000 to $74,999 | 425 (95.7%) | 19 (4.3%) |
| $75,000 to $99,999 | 700 (93.0%) | 53 (7.0%) |
| $100,000 and over | 7,672 (96.4%) | 290 (3.6%) |
Public vs Private Health Insurance Coverage by Age in Brandywine
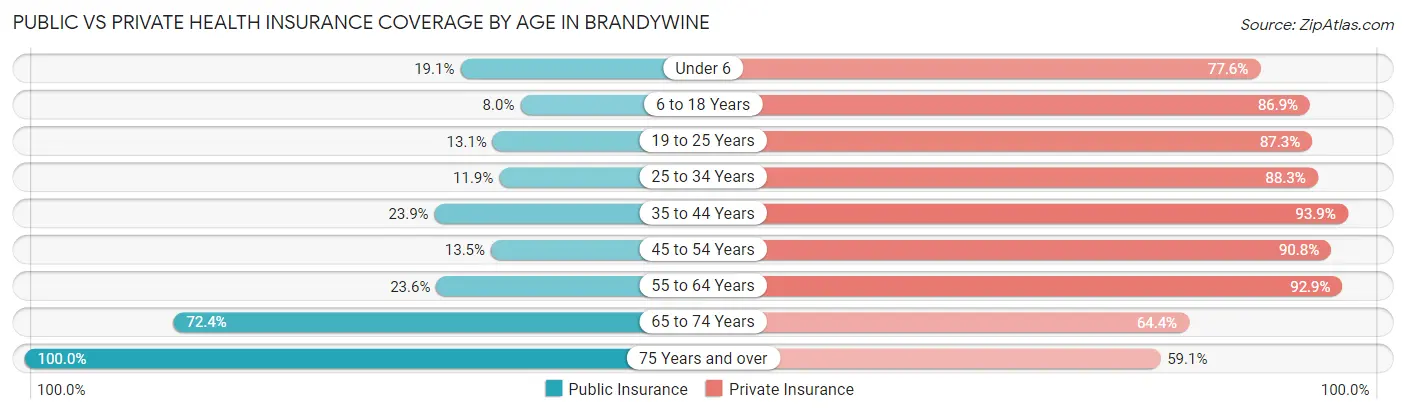
| Age Bracket | Public Insurance | Private Insurance |
| Under 6 | 107 (19.1%) | 434 (77.6%) |
| 6 to 18 Years | 130 (8.0%) | 1,412 (86.9%) |
| 19 to 25 Years | 100 (13.1%) | 665 (87.3%) |
| 25 to 34 Years | 101 (11.9%) | 748 (88.3%) |
| 35 to 44 Years | 352 (23.9%) | 1,381 (93.9%) |
| 45 to 54 Years | 215 (13.5%) | 1,451 (90.8%) |
| 55 to 64 Years | 428 (23.6%) | 1,685 (92.9%) |
| 65 to 74 Years | 702 (72.4%) | 625 (64.4%) |
| 75 Years and over | 291 (100.0%) | 172 (59.1%) |
| Total | 2,426 (24.4%) | 8,573 (86.3%) |
Disability Status by Sex by Age in Brandywine
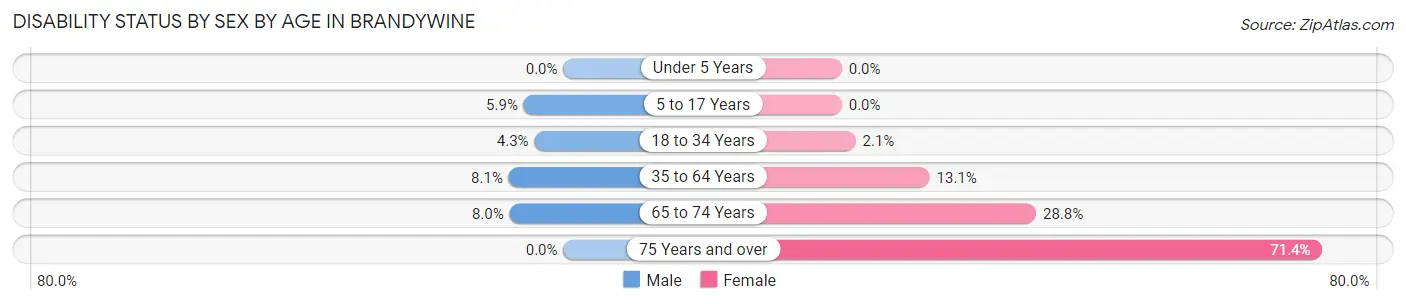
| Age Bracket | Male | Female |
| Under 5 Years | 0 (0.0%) | 0 (0.0%) |
| 5 to 17 Years | 62 (5.9%) | 0 (0.0%) |
| 18 to 34 Years | 44 (4.3%) | 14 (2.1%) |
| 35 to 64 Years | 169 (8.1%) | 365 (13.1%) |
| 65 to 74 Years | 39 (8.0%) | 139 (28.8%) |
| 75 Years and over | 0 (0.0%) | 157 (71.4%) |
Disability Class by Sex by Age in Brandywine
Disability Class: Hearing Difficulty
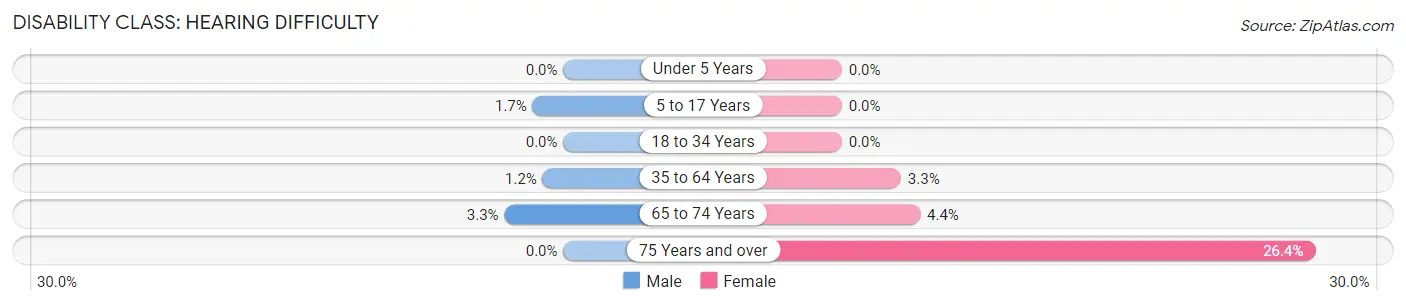
| Age Bracket | Male | Female |
| Under 5 Years | 0 (0.0%) | 0 (0.0%) |
| 5 to 17 Years | 18 (1.7%) | 0 (0.0%) |
| 18 to 34 Years | 0 (0.0%) | 0 (0.0%) |
| 35 to 64 Years | 24 (1.1%) | 92 (3.3%) |
| 65 to 74 Years | 16 (3.3%) | 21 (4.4%) |
| 75 Years and over | 0 (0.0%) | 58 (26.4%) |
Disability Class: Vision Difficulty
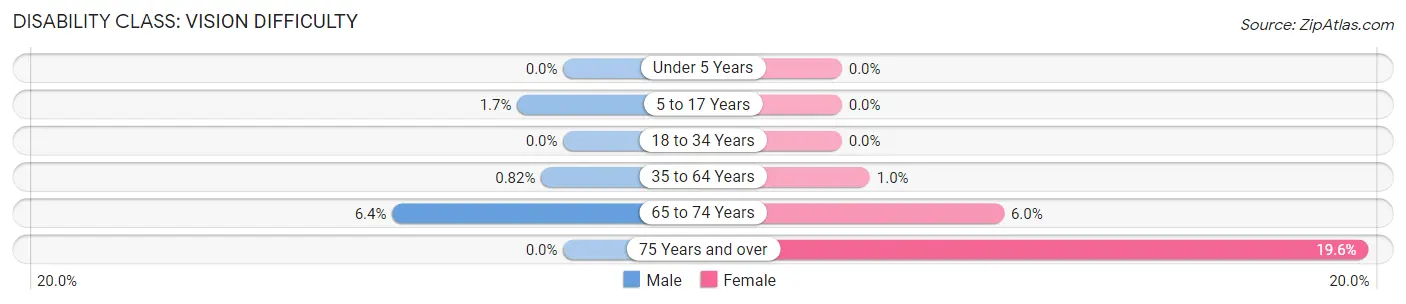
| Age Bracket | Male | Female |
| Under 5 Years | 0 (0.0%) | 0 (0.0%) |
| 5 to 17 Years | 18 (1.7%) | 0 (0.0%) |
| 18 to 34 Years | 0 (0.0%) | 0 (0.0%) |
| 35 to 64 Years | 17 (0.8%) | 29 (1.0%) |
| 65 to 74 Years | 31 (6.4%) | 29 (6.0%) |
| 75 Years and over | 0 (0.0%) | 43 (19.6%) |
Disability Class: Cognitive Difficulty
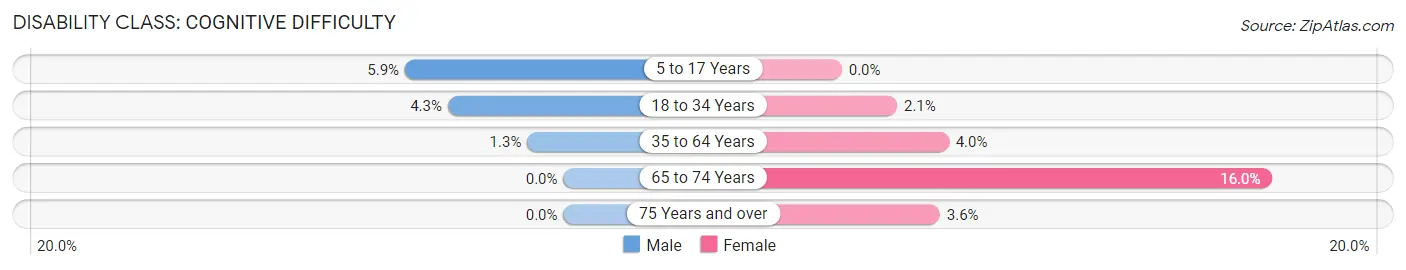
| Age Bracket | Male | Female |
| 5 to 17 Years | 62 (5.9%) | 0 (0.0%) |
| 18 to 34 Years | 44 (4.3%) | 14 (2.1%) |
| 35 to 64 Years | 28 (1.3%) | 111 (4.0%) |
| 65 to 74 Years | 0 (0.0%) | 77 (16.0%) |
| 75 Years and over | 0 (0.0%) | 8 (3.6%) |
Disability Class: Ambulatory Difficulty
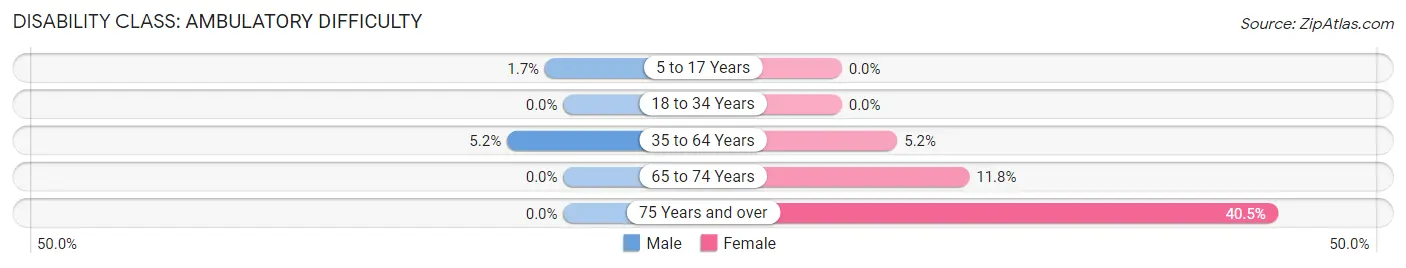
| Age Bracket | Male | Female |
| 5 to 17 Years | 18 (1.7%) | 0 (0.0%) |
| 18 to 34 Years | 0 (0.0%) | 0 (0.0%) |
| 35 to 64 Years | 109 (5.2%) | 144 (5.1%) |
| 65 to 74 Years | 0 (0.0%) | 57 (11.8%) |
| 75 Years and over | 0 (0.0%) | 89 (40.5%) |
Disability Class: Self-Care Difficulty
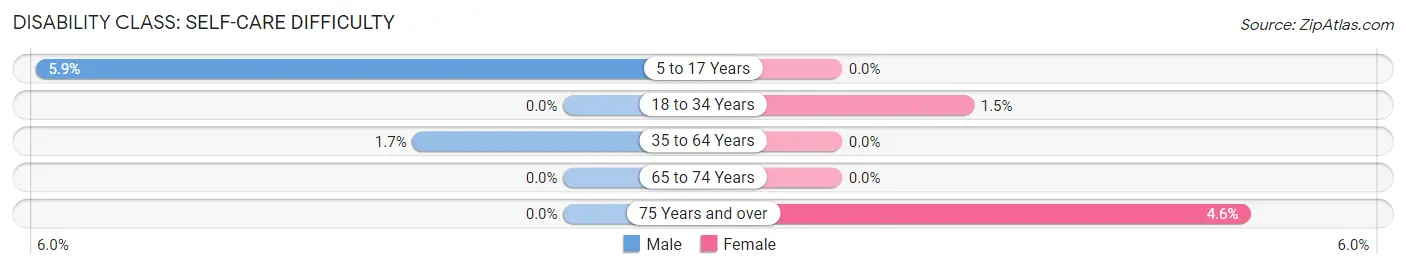
| Age Bracket | Male | Female |
| 5 to 17 Years | 62 (5.9%) | 0 (0.0%) |
| 18 to 34 Years | 0 (0.0%) | 10 (1.5%) |
| 35 to 64 Years | 35 (1.7%) | 0 (0.0%) |
| 65 to 74 Years | 0 (0.0%) | 0 (0.0%) |
| 75 Years and over | 0 (0.0%) | 10 (4.5%) |
Technology Access in Brandywine
Computing Device Access in Brandywine
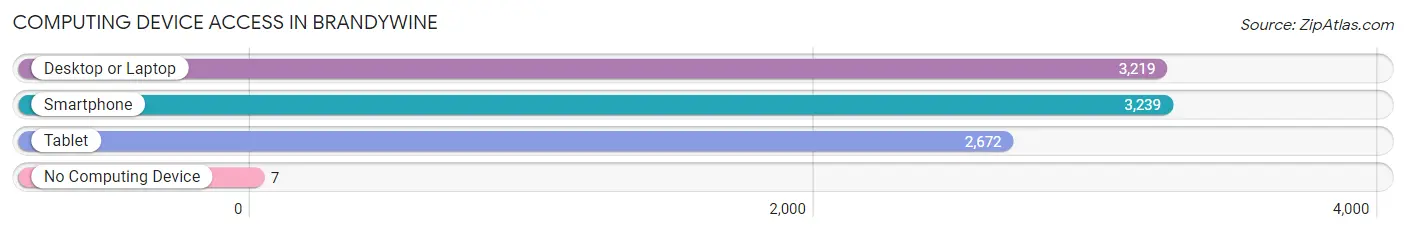
| Device Type | # Households | % Households |
| Desktop or Laptop | 3,219 | 95.0% |
| Smartphone | 3,239 | 95.6% |
| Tablet | 2,672 | 78.8% |
| No Computing Device | 7 | 0.2% |
| Total | 3,389 | 100.0% |
Internet Access in Brandywine
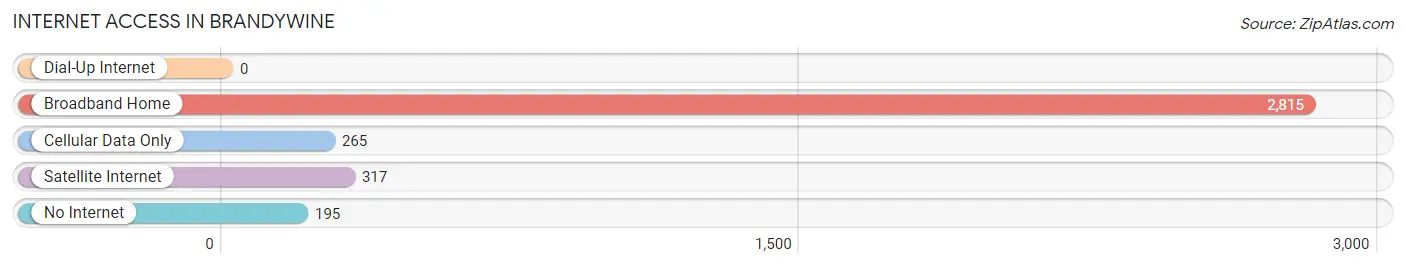
| Internet Type | # Households | % Households |
| Dial-Up Internet | 0 | 0.0% |
| Broadband Home | 2,815 | 83.1% |
| Cellular Data Only | 265 | 7.8% |
| Satellite Internet | 317 | 9.3% |
| No Internet | 195 | 5.8% |
| Total | 3,389 | 100.0% |
Brandywine Summary
Brandywine, Maryland is a small unincorporated community located in Prince George’s County, Maryland. It is situated about 25 miles south of Washington, D.C. and is part of the Washington Metropolitan Area. The community is bordered by the Patuxent River to the east and the Potomac River to the south.
History
The area that is now Brandywine was first settled in the late 1600s by English settlers. The community was originally known as “Brandywine Hundred” and was part of Charles County. In 1748, the area was split off from Charles County and became part of Prince George’s County. The community was named after the Brandywine Creek, which runs through the area.
In the late 1700s, the area was home to a large number of tobacco plantations. The plantations were owned by wealthy families such as the Calverts, the Digges, and the Carters. The plantations were worked by enslaved African Americans.
In the early 1800s, the area was home to a number of small villages and towns. These included Brandywine Town, which was located near the present-day intersection of Brandywine Road and Brandywine Drive. The town was home to a post office, a blacksmith shop, and a general store.
In the late 1800s, the area began to experience rapid growth. The population increased from about 500 in 1880 to over 1,000 in 1900. This growth was due to the construction of the Washington, Baltimore and Annapolis Electric Railway, which ran through the area.
Geography
Brandywine is located in the Piedmont region of Maryland. The area is characterized by rolling hills and valleys. The highest point in the area is located at the intersection of Brandywine Road and Brandywine Drive, which is about 400 feet above sea level.
The area is home to a number of creeks and streams, including the Brandywine Creek, the Patuxent River, and the Potomac River. The area is also home to a number of parks, including the Brandywine Creek State Park and the Patuxent River State Park.
Economy
The economy of Brandywine is largely based on agriculture. The area is home to a number of farms, which produce a variety of crops, including corn, soybeans, wheat, and hay. The area is also home to a number of nurseries, which produce a variety of plants and flowers.
In addition to agriculture, the area is home to a number of small businesses, including restaurants, retail stores, and auto repair shops. The area is also home to a number of government offices, including the Prince George’s County Police Department and the Prince George’s County Fire Department.
Demographics
As of the 2010 census, the population of Brandywine was 2,845. The racial makeup of the area was 79.3% White, 14.2% African American, 0.3% Native American, 1.2% Asian, and 4.9% from other races. The median household income was $76,944, and the median home value was $310,000.
Brandywine is a small, rural community with a rich history and a diverse population. The area is home to a number of farms and businesses, and is a popular destination for outdoor recreation. The area is also home to a number of government offices, making it an important part of the Washington Metropolitan Area.
Common Questions
What is the Total Population of Brandywine?
Total Population of Brandywine is 10,088.
What is the Total Male Population of Brandywine?
Total Male Population of Brandywine is 4,882.
What is the Total Female Population of Brandywine?
Total Female Population of Brandywine is 5,206.
What is the Ratio of Males per 100 Females in Brandywine?
There are 93.78 Males per 100 Females in Brandywine.
What is the Ratio of Females per 100 Males in Brandywine?
There are 106.64 Females per 100 Males in Brandywine.
What is the Median Population Age in Brandywine?
Median Population Age in Brandywine is 43.1 Years.
What is the Average Family Size in Brandywine
Average Family Size in Brandywine is 3.4 People.
What is the Average Household Size in Brandywine
Average Household Size in Brandywine is 3.0 People.
What is Per Capita Income in Brandywine?
Per Capita income in Brandywine is $56,182.
What is the Median Family Income in Brandywine?
Median Family Income in Brandywine is $181,389.
What is the Median Household income in Brandywine?
Median Household Income in Brandywine is $150,494.
What is Income or Wage Gap in Brandywine?
Income or Wage Gap in Brandywine is 20.0%.
Women in Brandywine earn 80.0 cents for every dollar earned by a man.
What is Inequality or Gini Index in Brandywine?
Inequality or Gini Index in Brandywine is 0.32.
How Large is the Labor Force in Brandywine?
There are 5,949 People in the Labor Forcein in Brandywine.
What is the Percentage of People in the Labor Force in Brandywine?
70.6% of People are in the Labor Force in Brandywine.
What is the Unemployment Rate in Brandywine?
Unemployment Rate in Brandywine is 6.2%.