Edgemere, MD
Edgemere Map
Edgemere Overview
8,879
TOTAL POPULATION
4,251
MALE POPULATION
4,628
FEMALE POPULATION
91.85
MALES / 100 FEMALES
108.87
FEMALES / 100 MALES
44.1
MEDIAN AGE
3.0
AVG FAMILY SIZE
2.6
AVG HOUSEHOLD SIZE
$57,019
PER CAPITA INCOME
$121,494
AVG FAMILY INCOME
$103,790
AVG HOUSEHOLD INCOME
8.4%
WAGE / INCOME GAP [ % ]
91.6¢/ $1
WAGE / INCOME GAP [ $ ]
0.50
INEQUALITY / GINI INDEX
4,316
LABOR FORCE [ PEOPLE ]
59.5%
PERCENT IN LABOR FORCE
3.1%
UNEMPLOYMENT RATE
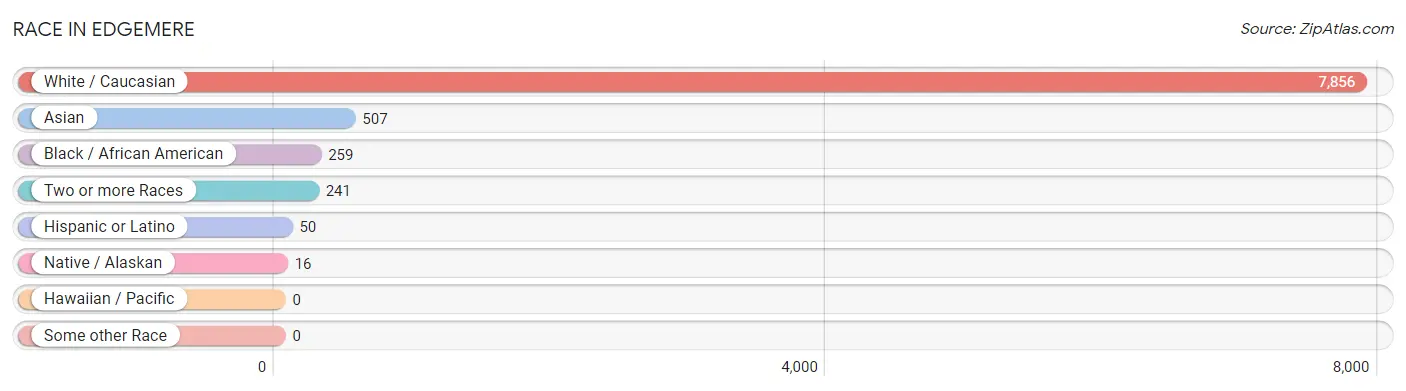
Race in Edgemere
The most populous races in Edgemere are White / Caucasian (7,856 | 88.5%), Asian (507 | 5.7%), and Black / African American (259 | 2.9%).
| Race | # Population | % Population |
| Asian | 507 | 5.7% |
| Black / African American | 259 | 2.9% |
| Hawaiian / Pacific | 0 | 0.0% |
| Hispanic or Latino | 50 | 0.6% |
| Native / Alaskan | 16 | 0.2% |
| White / Caucasian | 7,856 | 88.5% |
| Two or more Races | 241 | 2.7% |
| Some other Race | 0 | 0.0% |
| Total | 8,879 | 100.0% |
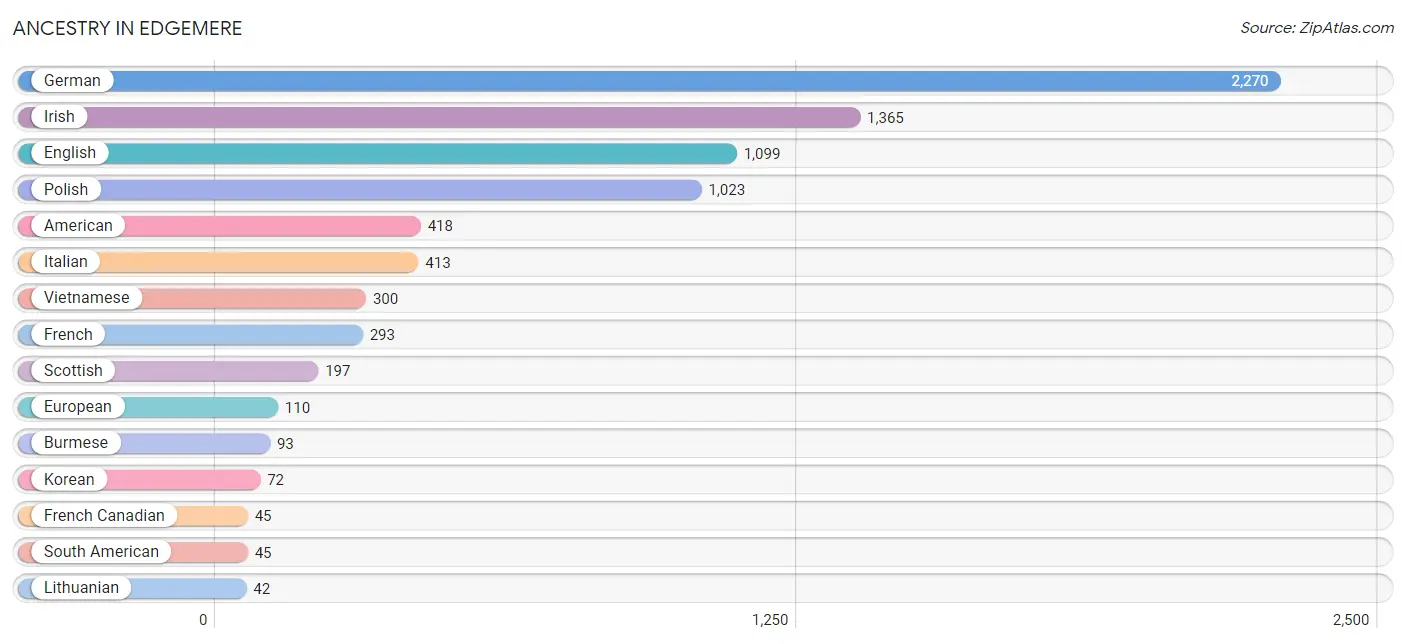
Ancestry in Edgemere
The most populous ancestries reported in Edgemere are German (2,270 | 25.6%), Irish (1,365 | 15.4%), English (1,099 | 12.4%), Polish (1,023 | 11.5%), and American (418 | 4.7%), together accounting for 69.6% of all Edgemere residents.
| Ancestry | # Population | % Population |
| African | 12 | 0.1% |
| American | 418 | 4.7% |
| Argentinean | 11 | 0.1% |
| Armenian | 18 | 0.2% |
| Bhutanese | 18 | 0.2% |
| Blackfeet | 3 | 0.0% |
| Bolivian | 17 | 0.2% |
| British | 10 | 0.1% |
| Burmese | 93 | 1.1% |
| Canadian | 1 | 0.0% |
| Cherokee | 16 | 0.2% |
| Czech | 27 | 0.3% |
| Dutch | 36 | 0.4% |
| Eastern European | 22 | 0.3% |
| English | 1,099 | 12.4% |
| European | 110 | 1.2% |
| Finnish | 11 | 0.1% |
| French | 293 | 3.3% |
| French Canadian | 45 | 0.5% |
| German | 2,270 | 25.6% |
| Ghanaian | 20 | 0.2% |
| Greek | 30 | 0.3% |
| Hungarian | 8 | 0.1% |
| Irish | 1,365 | 15.4% |
| Israeli | 12 | 0.1% |
| Italian | 413 | 4.6% |
| Japanese | 15 | 0.2% |
| Korean | 72 | 0.8% |
| Latvian | 1 | 0.0% |
| Lithuanian | 42 | 0.5% |
| Norwegian | 6 | 0.1% |
| Peruvian | 17 | 0.2% |
| Polish | 1,023 | 11.5% |
| Portuguese | 9 | 0.1% |
| Russian | 19 | 0.2% |
| Scotch-Irish | 30 | 0.3% |
| Scottish | 197 | 2.2% |
| Slovak | 8 | 0.1% |
| South American | 45 | 0.5% |
| Spanish | 5 | 0.1% |
| Subsaharan African | 20 | 0.2% |
| Swedish | 28 | 0.3% |
| Swiss | 10 | 0.1% |
| Ukrainian | 25 | 0.3% |
| Vietnamese | 300 | 3.4% |
| Welsh | 15 | 0.2% | View All 46 Rows |
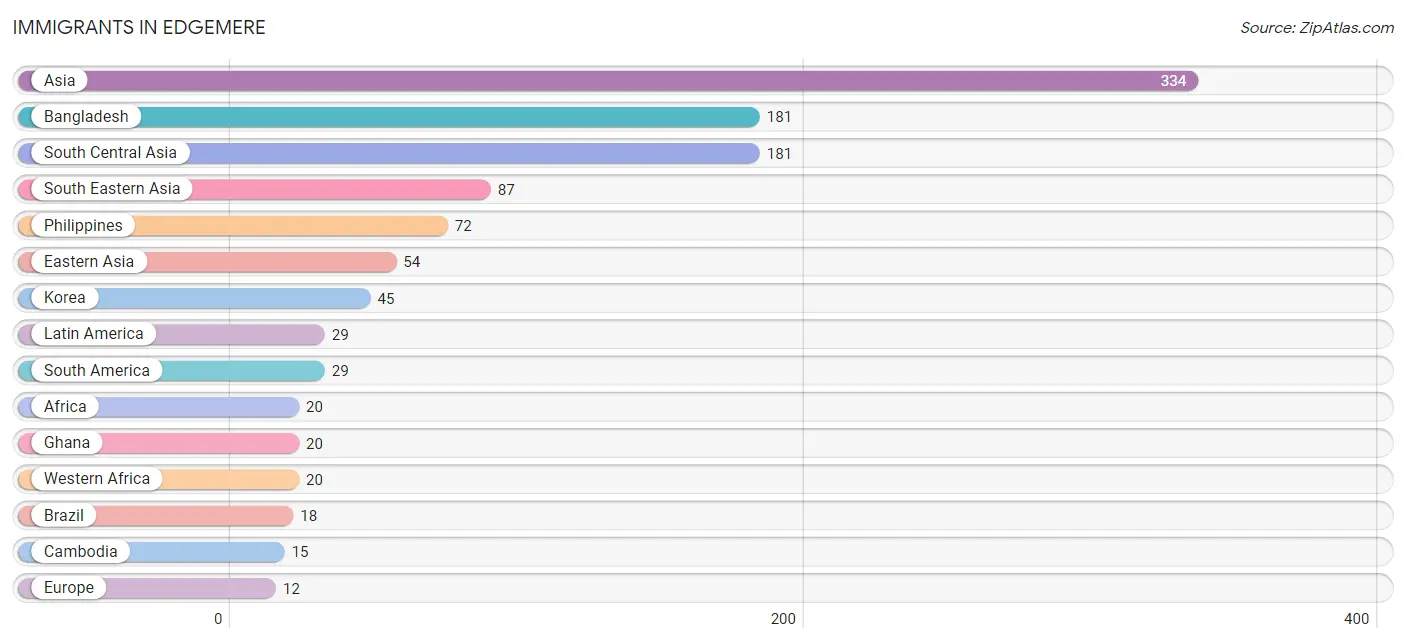
Immigrants in Edgemere
The most numerous immigrant groups reported in Edgemere came from Asia (334 | 3.8%), Bangladesh (181 | 2.0%), South Central Asia (181 | 2.0%), South Eastern Asia (87 | 1.0%), and Philippines (72 | 0.8%), together accounting for 9.6% of all Edgemere residents.
| Immigration Origin | # Population | % Population |
| Africa | 20 | 0.2% |
| Argentina | 11 | 0.1% |
| Asia | 334 | 3.8% |
| Bangladesh | 181 | 2.0% |
| Brazil | 18 | 0.2% |
| Cambodia | 15 | 0.2% |
| Eastern Asia | 54 | 0.6% |
| Eastern Europe | 1 | 0.0% |
| Europe | 12 | 0.1% |
| France | 11 | 0.1% |
| Ghana | 20 | 0.2% |
| Israel | 12 | 0.1% |
| Japan | 9 | 0.1% |
| Korea | 45 | 0.5% |
| Latin America | 29 | 0.3% |
| Latvia | 1 | 0.0% |
| Philippines | 72 | 0.8% |
| South America | 29 | 0.3% |
| South Central Asia | 181 | 2.0% |
| South Eastern Asia | 87 | 1.0% |
| Western Africa | 20 | 0.2% |
| Western Asia | 12 | 0.1% |
| Western Europe | 11 | 0.1% | View All 23 Rows |
Sex and Age in Edgemere
Sex and Age in Edgemere
The most populous age groups in Edgemere are 60 to 64 Years (417 | 9.8%) for men and 40 to 44 Years (415 | 9.0%) for women.
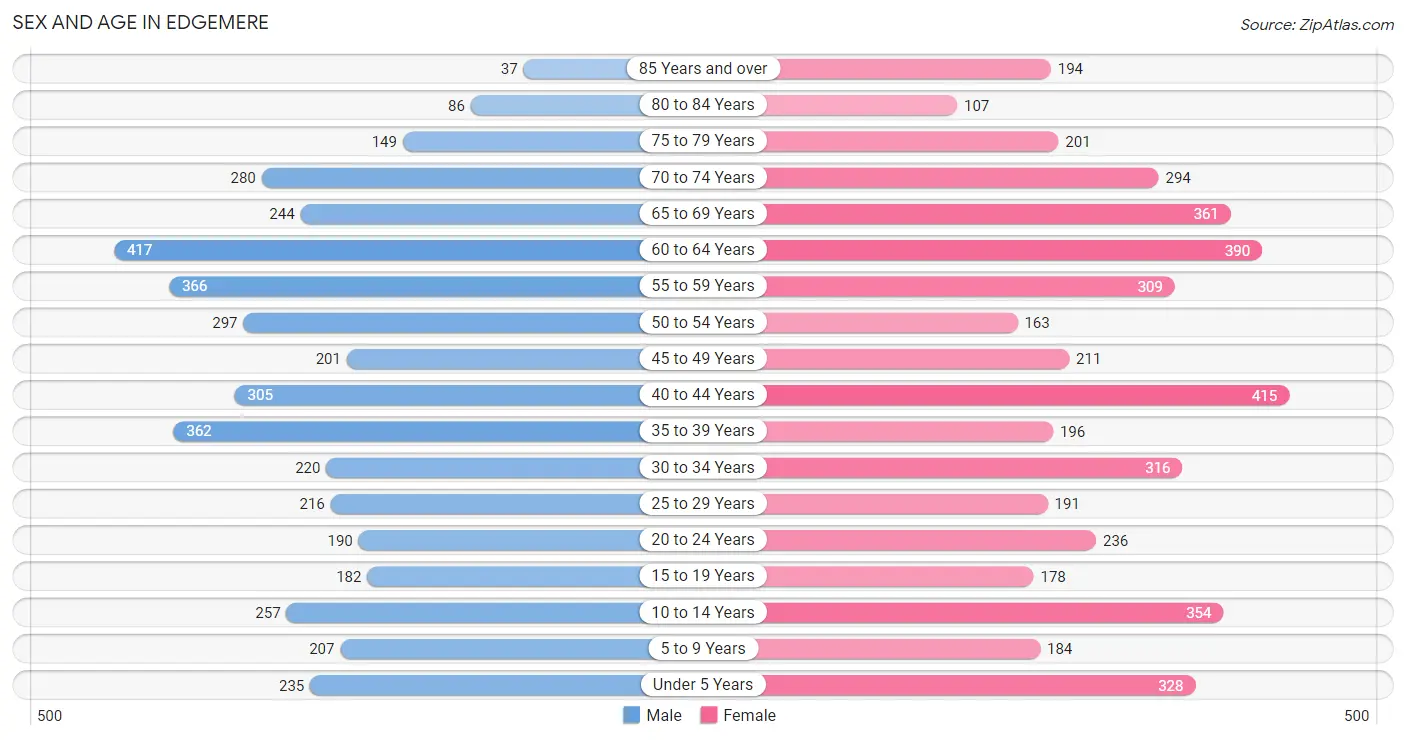
| Age Bracket | Male | Female |
| Under 5 Years | 235 (5.5%) | 328 (7.1%) |
| 5 to 9 Years | 207 (4.9%) | 184 (4.0%) |
| 10 to 14 Years | 257 (6.0%) | 354 (7.6%) |
| 15 to 19 Years | 182 (4.3%) | 178 (3.8%) |
| 20 to 24 Years | 190 (4.5%) | 236 (5.1%) |
| 25 to 29 Years | 216 (5.1%) | 191 (4.1%) |
| 30 to 34 Years | 220 (5.2%) | 316 (6.8%) |
| 35 to 39 Years | 362 (8.5%) | 196 (4.2%) |
| 40 to 44 Years | 305 (7.2%) | 415 (9.0%) |
| 45 to 49 Years | 201 (4.7%) | 211 (4.6%) |
| 50 to 54 Years | 297 (7.0%) | 163 (3.5%) |
| 55 to 59 Years | 366 (8.6%) | 309 (6.7%) |
| 60 to 64 Years | 417 (9.8%) | 390 (8.4%) |
| 65 to 69 Years | 244 (5.7%) | 361 (7.8%) |
| 70 to 74 Years | 280 (6.6%) | 294 (6.4%) |
| 75 to 79 Years | 149 (3.5%) | 201 (4.3%) |
| 80 to 84 Years | 86 (2.0%) | 107 (2.3%) |
| 85 Years and over | 37 (0.9%) | 194 (4.2%) |
| Total | 4,251 (100.0%) | 4,628 (100.0%) |
Families and Households in Edgemere
Median Family Size in Edgemere
The median family size in Edgemere is 2.97 persons per family, with married-couple families (1,732 | 67.1%) accounting for the largest median family size of 3.07 persons per family. On the other hand, single male/father families (410 | 15.9%) represent the smallest median family size with 2.56 persons per family.
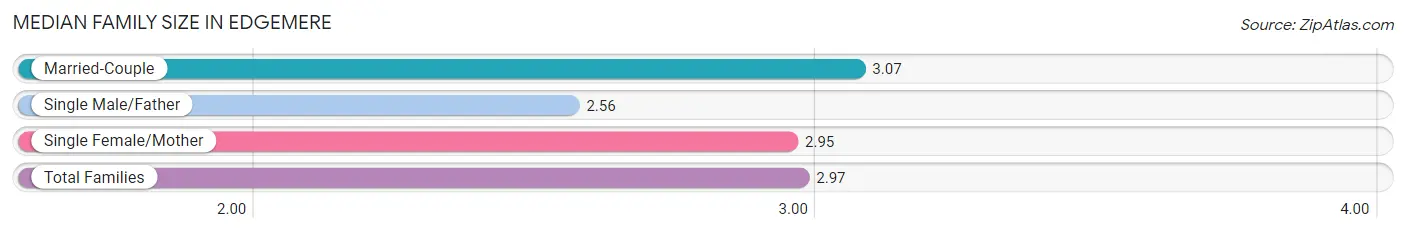
| Family Type | # Families | Family Size |
| Married-Couple | 1,732 (67.1%) | 3.07 |
| Single Male/Father | 410 (15.9%) | 2.56 |
| Single Female/Mother | 440 (17.0%) | 2.95 |
| Total Families | 2,582 (100.0%) | 2.97 |
Median Household Size in Edgemere
The median household size in Edgemere is 2.60 persons per household, with married-couple households (1,732 | 50.7%) accounting for the largest median household size of 3.1 persons per household. non-family households (832 | 24.4%) represent the smallest median household size with 1.16 persons per household.
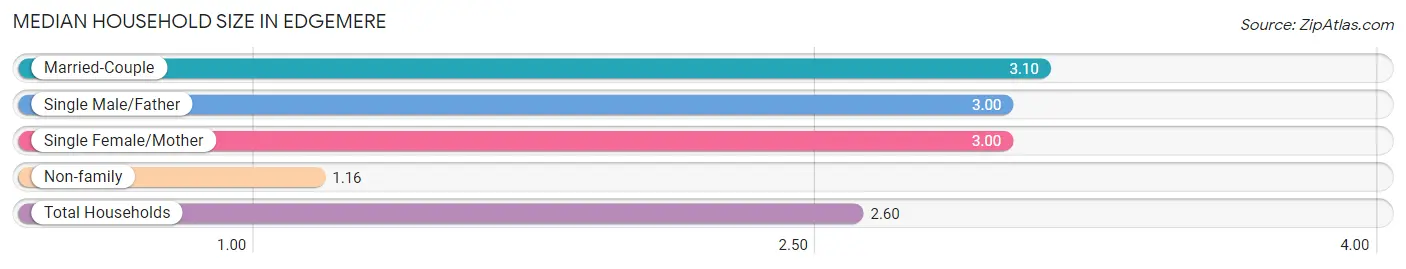
| Household Type | # Households | Household Size |
| Married-Couple | 1,732 (50.7%) | 3.10 |
| Single Male/Father | 410 (12.0%) | 3.00 |
| Single Female/Mother | 440 (12.9%) | 3.00 |
| Non-family | 832 (24.4%) | 1.16 |
| Total Households | 3,414 (100.0%) | 2.60 |
Household Size by Marriage Status in Edgemere
Out of a total of 3,414 households in Edgemere, 2,582 (75.6%) are family households, while 832 (24.4%) are nonfamily households. The most numerous type of family households are 2-person households, comprising 1,210, and the most common type of nonfamily households are 1-person households, comprising 702.
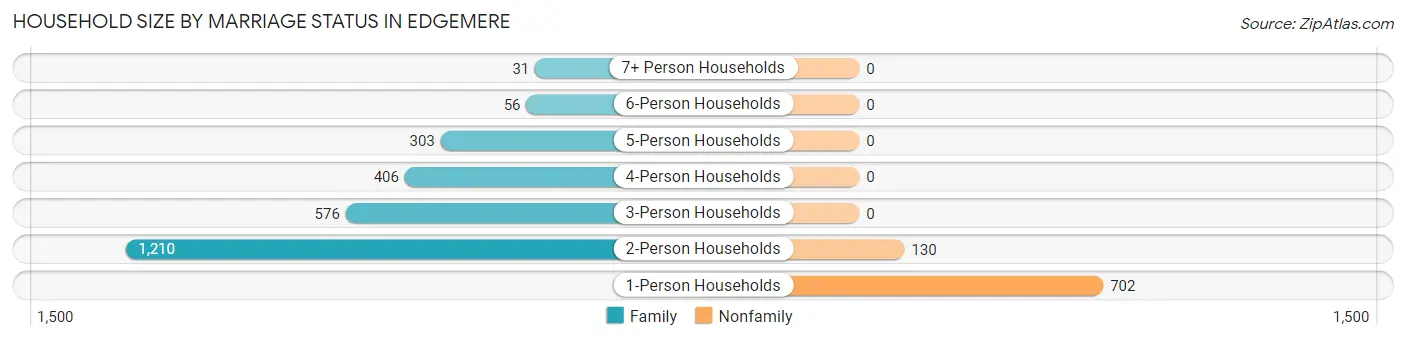
| Household Size | Family Households | Nonfamily Households |
| 1-Person Households | - | 702 (20.6%) |
| 2-Person Households | 1,210 (35.4%) | 130 (3.8%) |
| 3-Person Households | 576 (16.9%) | 0 (0.0%) |
| 4-Person Households | 406 (11.9%) | 0 (0.0%) |
| 5-Person Households | 303 (8.9%) | 0 (0.0%) |
| 6-Person Households | 56 (1.6%) | 0 (0.0%) |
| 7+ Person Households | 31 (0.9%) | 0 (0.0%) |
| Total | 2,582 (75.6%) | 832 (24.4%) |
Female Fertility in Edgemere
Fertility by Age in Edgemere
Average fertility rate in Edgemere is 18.0 births per 1,000 women. Women in the age bracket of 20 to 34 years have the highest fertility rate with 43.0 births per 1,000 women. Women in the age bracket of 20 to 34 years acount for 100.0% of all women with births.
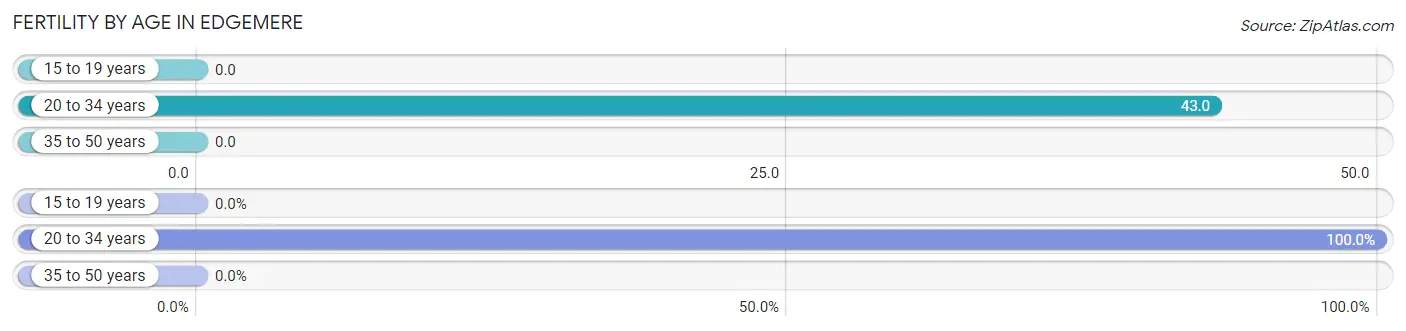
| Age Bracket | Women with Births | Births / 1,000 Women |
| 15 to 19 years | 0 (0.0%) | 0.0 |
| 20 to 34 years | 32 (100.0%) | 43.0 |
| 35 to 50 years | 0 (0.0%) | 0.0 |
| Total | 32 (100.0%) | 18.0 |
Fertility by Age by Marriage Status in Edgemere
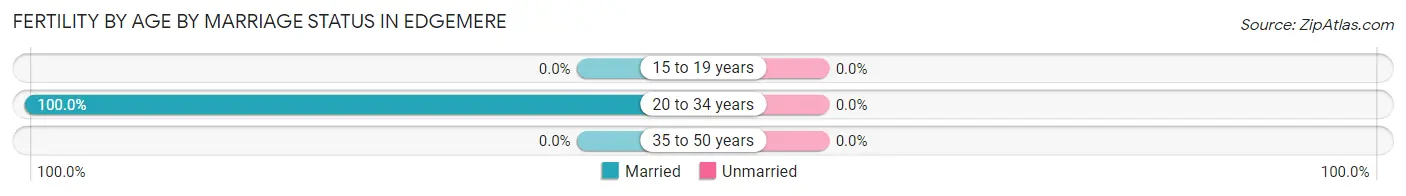
| Age Bracket | Married | Unmarried |
| 15 to 19 years | 0 (0.0%) | 0 (0.0%) |
| 20 to 34 years | 32 (100.0%) | 0 (0.0%) |
| 35 to 50 years | 0 (0.0%) | 0 (0.0%) |
| Total | 32 (100.0%) | 0 (0.0%) |
Fertility by Education in Edgemere
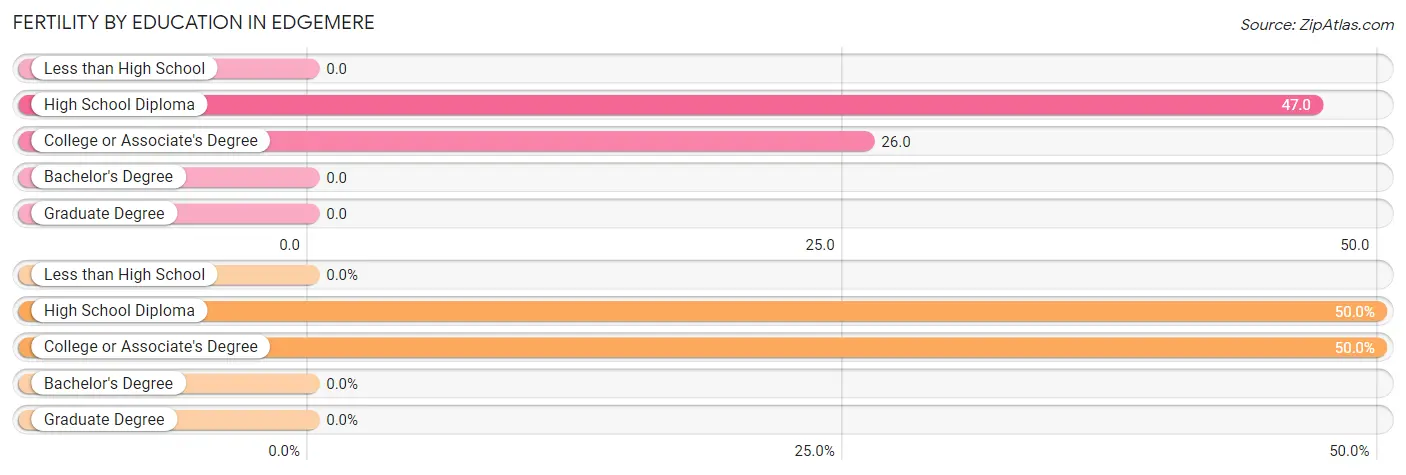
| Educational Attainment | Women with Births | Births / 1,000 Women |
| Less than High School | 0 (0.0%) | 0.0 |
| High School Diploma | 16 (50.0%) | 47.0 |
| College or Associate's Degree | 16 (50.0%) | 26.0 |
| Bachelor's Degree | 0 (0.0%) | 0.0 |
| Graduate Degree | 0 (0.0%) | 0.0 |
| Total | 32 (100.0%) | 18.0 |
Fertility by Education by Marriage Status in Edgemere
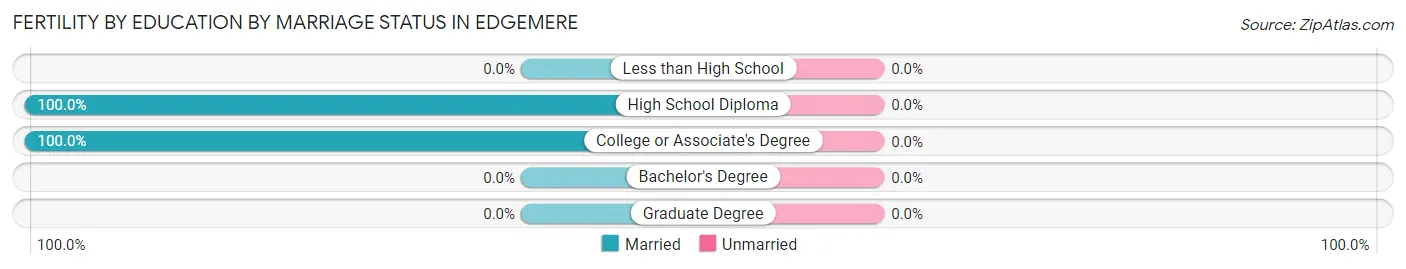
| Educational Attainment | Married | Unmarried |
| Less than High School | 0 (0.0%) | 0 (0.0%) |
| High School Diploma | 16 (100.0%) | 0 (0.0%) |
| College or Associate's Degree | 16 (100.0%) | 0 (0.0%) |
| Bachelor's Degree | 0 (0.0%) | 0 (0.0%) |
| Graduate Degree | 0 (0.0%) | 0 (0.0%) |
| Total | 32 (100.0%) | 0 (0.0%) |
Income in Edgemere
Income Overview in Edgemere
Per Capita Income in Edgemere is $57,019, while median incomes of families and households are $121,494 and $103,790 respectively.
| Characteristic | Number | Measure |
| Per Capita Income | 8,879 | $57,019 |
| Median Family Income | 2,582 | $121,494 |
| Mean Family Income | 2,582 | $167,639 |
| Median Household Income | 3,414 | $103,790 |
| Mean Household Income | 3,414 | $148,554 |
| Income Deficit | 2,582 | $0 |
| Wage / Income Gap (%) | 8,879 | 8.37% |
| Wage / Income Gap ($) | 8,879 | 91.63¢ per $1 |
| Gini / Inequality Index | 8,879 | 0.50 |
Earnings by Sex in Edgemere
Average Earnings in Edgemere are $59,084, $62,027 for men and $56,834 for women, a difference of 8.4%.
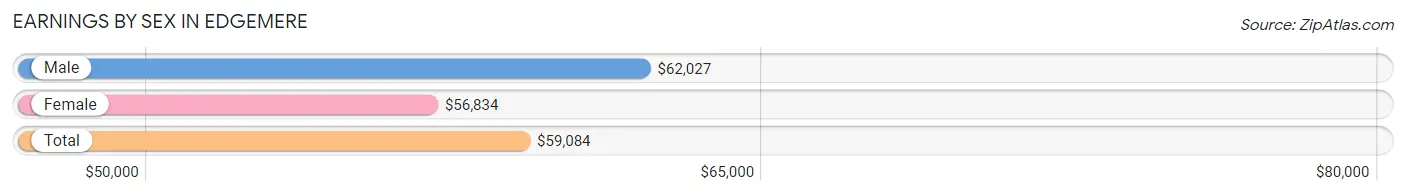
| Sex | Number | Average Earnings |
| Male | 2,476 (55.8%) | $62,027 |
| Female | 1,957 (44.2%) | $56,834 |
| Total | 4,433 (100.0%) | $59,084 |
Earnings by Sex by Income Bracket in Edgemere
The most common earnings brackets in Edgemere are $100,000+ for men (570 | 23.0%) and $75,000 to $99,999 for women (372 | 19.0%).
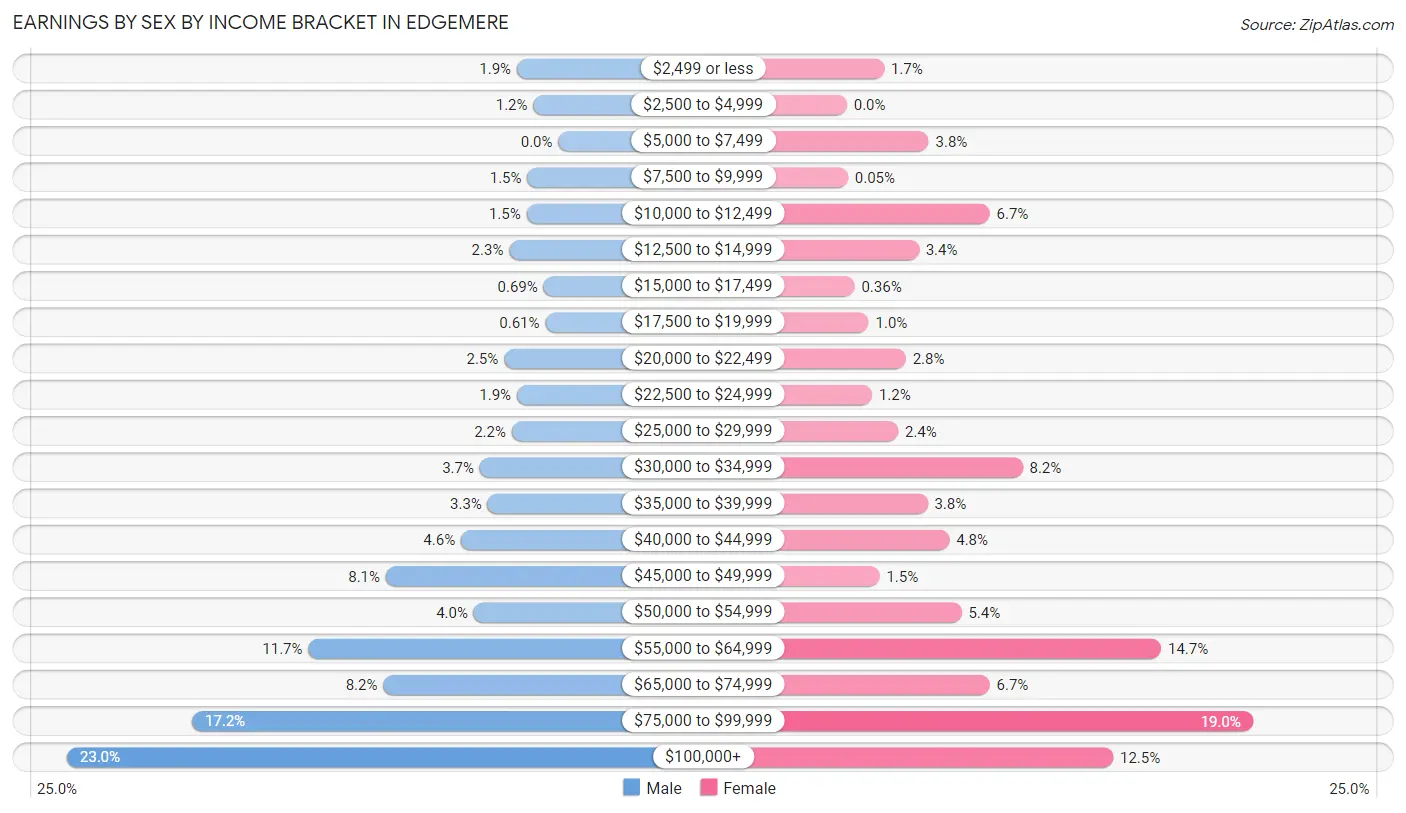
| Income | Male | Female |
| $2,499 or less | 48 (1.9%) | 34 (1.7%) |
| $2,500 to $4,999 | 29 (1.2%) | 0 (0.0%) |
| $5,000 to $7,499 | 0 (0.0%) | 75 (3.8%) |
| $7,500 to $9,999 | 36 (1.5%) | 1 (0.1%) |
| $10,000 to $12,499 | 37 (1.5%) | 131 (6.7%) |
| $12,500 to $14,999 | 57 (2.3%) | 66 (3.4%) |
| $15,000 to $17,499 | 17 (0.7%) | 7 (0.4%) |
| $17,500 to $19,999 | 15 (0.6%) | 20 (1.0%) |
| $20,000 to $22,499 | 63 (2.5%) | 54 (2.8%) |
| $22,500 to $24,999 | 48 (1.9%) | 23 (1.2%) |
| $25,000 to $29,999 | 54 (2.2%) | 47 (2.4%) |
| $30,000 to $34,999 | 91 (3.7%) | 161 (8.2%) |
| $35,000 to $39,999 | 82 (3.3%) | 74 (3.8%) |
| $40,000 to $44,999 | 113 (4.6%) | 94 (4.8%) |
| $45,000 to $49,999 | 200 (8.1%) | 30 (1.5%) |
| $50,000 to $54,999 | 98 (4.0%) | 105 (5.4%) |
| $55,000 to $64,999 | 290 (11.7%) | 288 (14.7%) |
| $65,000 to $74,999 | 203 (8.2%) | 131 (6.7%) |
| $75,000 to $99,999 | 425 (17.2%) | 372 (19.0%) |
| $100,000+ | 570 (23.0%) | 244 (12.5%) |
| Total | 2,476 (100.0%) | 1,957 (100.0%) |
Earnings by Sex by Educational Attainment in Edgemere
Average earnings in Edgemere are $68,972 for men and $60,573 for women, a difference of 12.2%. Men with an educational attainment of bachelor's degree enjoy the highest average annual earnings of $85,202, while those with high school diploma education earn the least with $56,797. Women with an educational attainment of graduate degree earn the most with the average annual earnings of $96,296, while those with high school diploma education have the smallest earnings of $34,063.
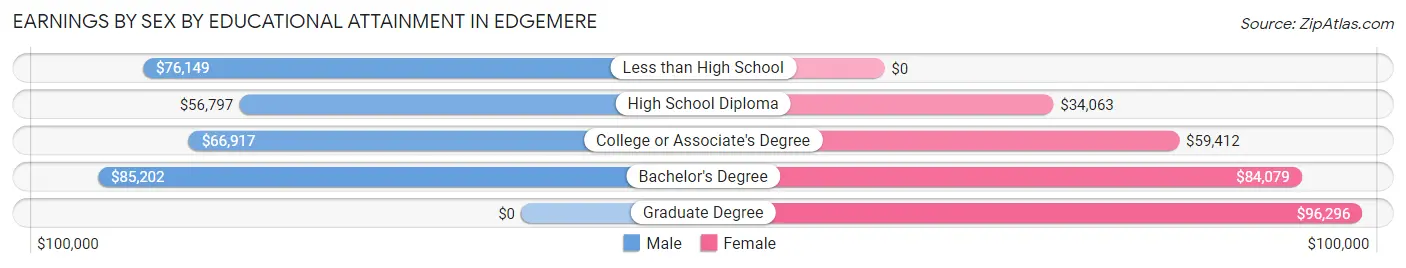
| Educational Attainment | Male Income | Female Income |
| Less than High School | $76,149 | $0 |
| High School Diploma | $56,797 | $34,063 |
| College or Associate's Degree | $66,917 | $59,412 |
| Bachelor's Degree | $85,202 | $84,079 |
| Graduate Degree | - | - |
| Total | $68,972 | $60,573 |
Family Income in Edgemere
Family Income Brackets in Edgemere
According to the Edgemere family income data, there are 638 families falling into the $100,000 to $149,999 income range, which is the most common income bracket and makes up 24.7% of all families. Conversely, the $10,000 to $14,999 income bracket is the least frequent group with only 21 families (0.8%) belonging to this category.
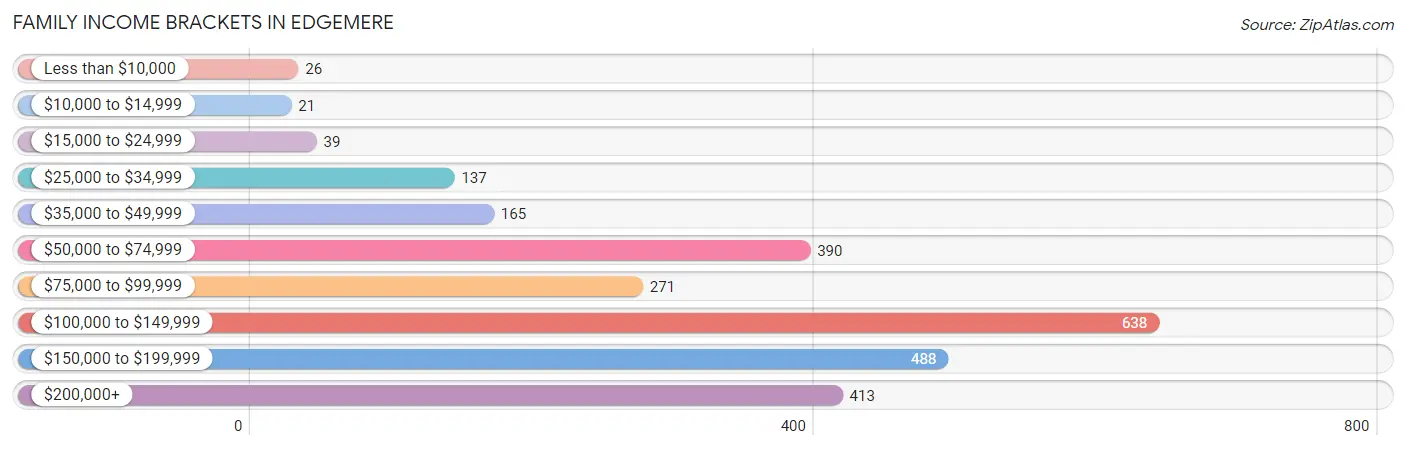
| Income Bracket | # Families | % Families |
| Less than $10,000 | 26 | 1.0% |
| $10,000 to $14,999 | 21 | 0.8% |
| $15,000 to $24,999 | 39 | 1.5% |
| $25,000 to $34,999 | 137 | 5.3% |
| $35,000 to $49,999 | 165 | 6.4% |
| $50,000 to $74,999 | 390 | 15.1% |
| $75,000 to $99,999 | 271 | 10.5% |
| $100,000 to $149,999 | 638 | 24.7% |
| $150,000 to $199,999 | 488 | 18.9% |
| $200,000+ | 413 | 16.0% |
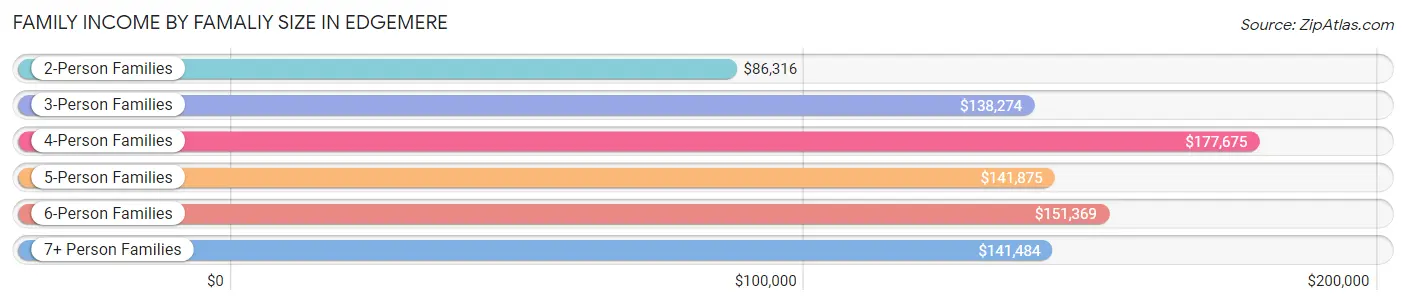
Family Income by Famaliy Size in Edgemere
4-person families (387 | 15.0%) account for the highest median family income in Edgemere with $177,675 per family, while 3-person families (591 | 22.9%) have the highest median income of $46,091 per family member.
| Income Bracket | # Families | Median Income |
| 2-Person Families | 1,268 (49.1%) | $86,316 |
| 3-Person Families | 591 (22.9%) | $138,274 |
| 4-Person Families | 387 (15.0%) | $177,675 |
| 5-Person Families | 262 (10.2%) | $141,875 |
| 6-Person Families | 43 (1.7%) | $151,369 |
| 7+ Person Families | 31 (1.2%) | $141,484 |
| Total | 2,582 (100.0%) | $121,494 |
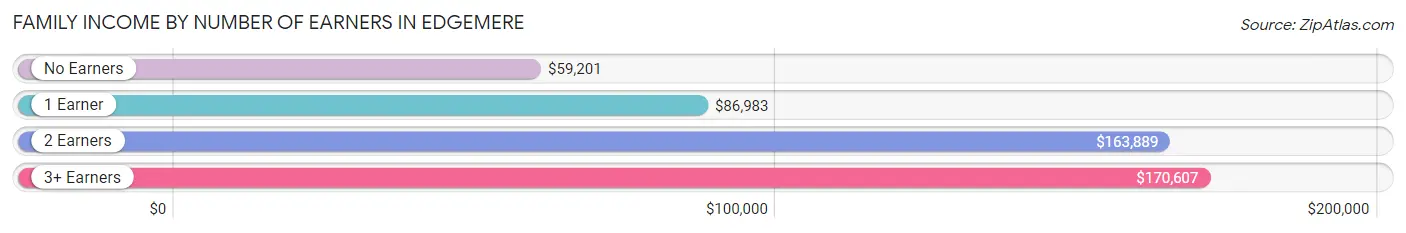
Family Income by Number of Earners in Edgemere
The median family income in Edgemere is $121,494, with families comprising 3+ earners (329) having the highest median family income of $170,607, while families with no earners (533) have the lowest median family income of $59,201, accounting for 12.7% and 20.6% of families, respectively.
| Number of Earners | # Families | Median Income |
| No Earners | 533 (20.6%) | $59,201 |
| 1 Earner | 708 (27.4%) | $86,983 |
| 2 Earners | 1,012 (39.2%) | $163,889 |
| 3+ Earners | 329 (12.7%) | $170,607 |
| Total | 2,582 (100.0%) | $121,494 |
Household Income in Edgemere
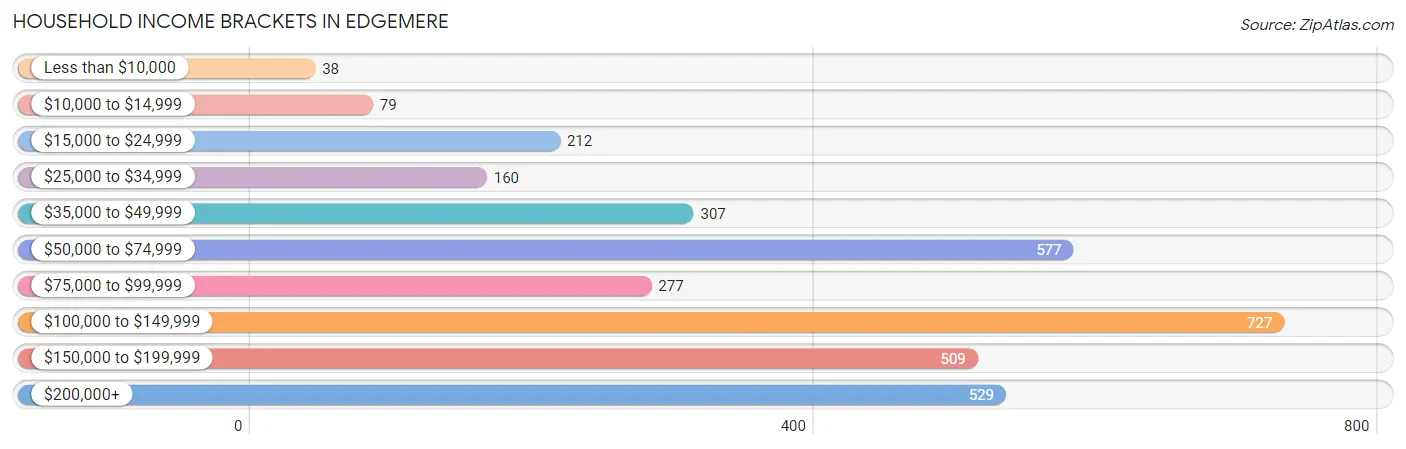
Household Income Brackets in Edgemere
With 727 households falling in the category, the $100,000 to $149,999 income range is the most frequent in Edgemere, accounting for 21.3% of all households. In contrast, only 38 households (1.1%) fall into the less than $10,000 income bracket, making it the least populous group.
| Income Bracket | # Households | % Households |
| Less than $10,000 | 38 | 1.1% |
| $10,000 to $14,999 | 79 | 2.3% |
| $15,000 to $24,999 | 212 | 6.2% |
| $25,000 to $34,999 | 160 | 4.7% |
| $35,000 to $49,999 | 307 | 9.0% |
| $50,000 to $74,999 | 577 | 16.9% |
| $75,000 to $99,999 | 277 | 8.1% |
| $100,000 to $149,999 | 727 | 21.3% |
| $150,000 to $199,999 | 509 | 14.9% |
| $200,000+ | 529 | 15.5% |
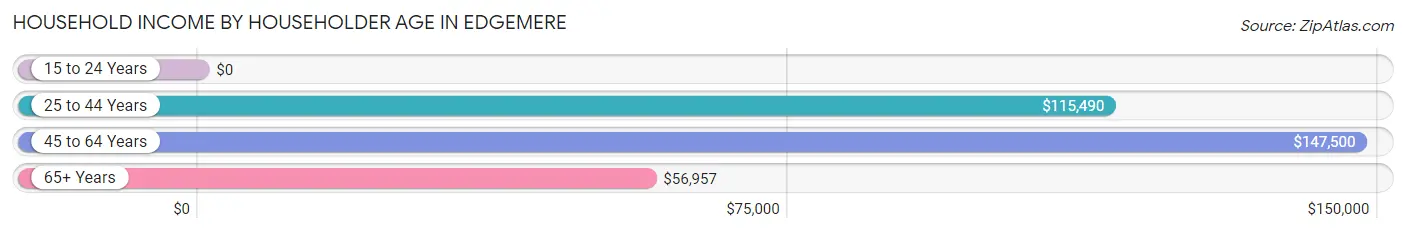
Household Income by Householder Age in Edgemere
The median household income in Edgemere is $103,790, with the highest median household income of $147,500 found in the 45 to 64 years age bracket for the primary householder. A total of 1,276 households (37.4%) fall into this category.
| Income Bracket | # Households | Median Income |
| 15 to 24 Years | 0 (0.0%) | $0 |
| 25 to 44 Years | 978 (28.6%) | $115,490 |
| 45 to 64 Years | 1,276 (37.4%) | $147,500 |
| 65+ Years | 1,160 (34.0%) | $56,957 |
| Total | 3,414 (100.0%) | $103,790 |
Poverty in Edgemere
Income Below Poverty by Sex and Age in Edgemere
With 4.0% poverty level for males and 7.6% for females among the residents of Edgemere, 75 year old and over males and 15 year old females are the most vulnerable to poverty, with 31 males (11.4%) and 17 females (100.0%) in their respective age groups living below the poverty level.
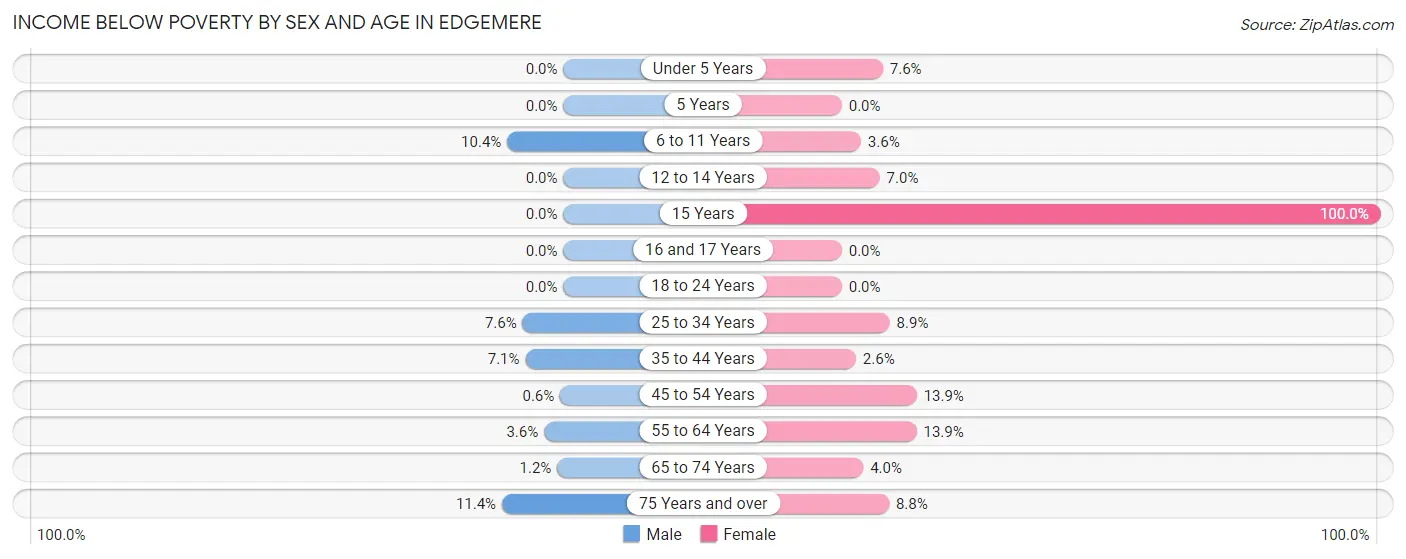
| Age Bracket | Male | Female |
| Under 5 Years | 0 (0.0%) | 25 (7.6%) |
| 5 Years | 0 (0.0%) | 0 (0.0%) |
| 6 to 11 Years | 22 (10.4%) | 10 (3.5%) |
| 12 to 14 Years | 0 (0.0%) | 18 (7.0%) |
| 15 Years | 0 (0.0%) | 17 (100.0%) |
| 16 and 17 Years | 0 (0.0%) | 0 (0.0%) |
| 18 to 24 Years | 0 (0.0%) | 0 (0.0%) |
| 25 to 34 Years | 33 (7.6%) | 45 (8.9%) |
| 35 to 44 Years | 47 (7.0%) | 16 (2.6%) |
| 45 to 54 Years | 3 (0.6%) | 52 (13.9%) |
| 55 to 64 Years | 28 (3.6%) | 97 (13.9%) |
| 65 to 74 Years | 6 (1.1%) | 26 (4.0%) |
| 75 Years and over | 31 (11.4%) | 44 (8.8%) |
| Total | 170 (4.0%) | 350 (7.6%) |
Income Above Poverty by Sex and Age in Edgemere
According to the poverty statistics in Edgemere, males aged under 5 years and females aged 16 and 17 years are the age groups that are most secure financially, with 100.0% of males and 100.0% of females in these age groups living above the poverty line.
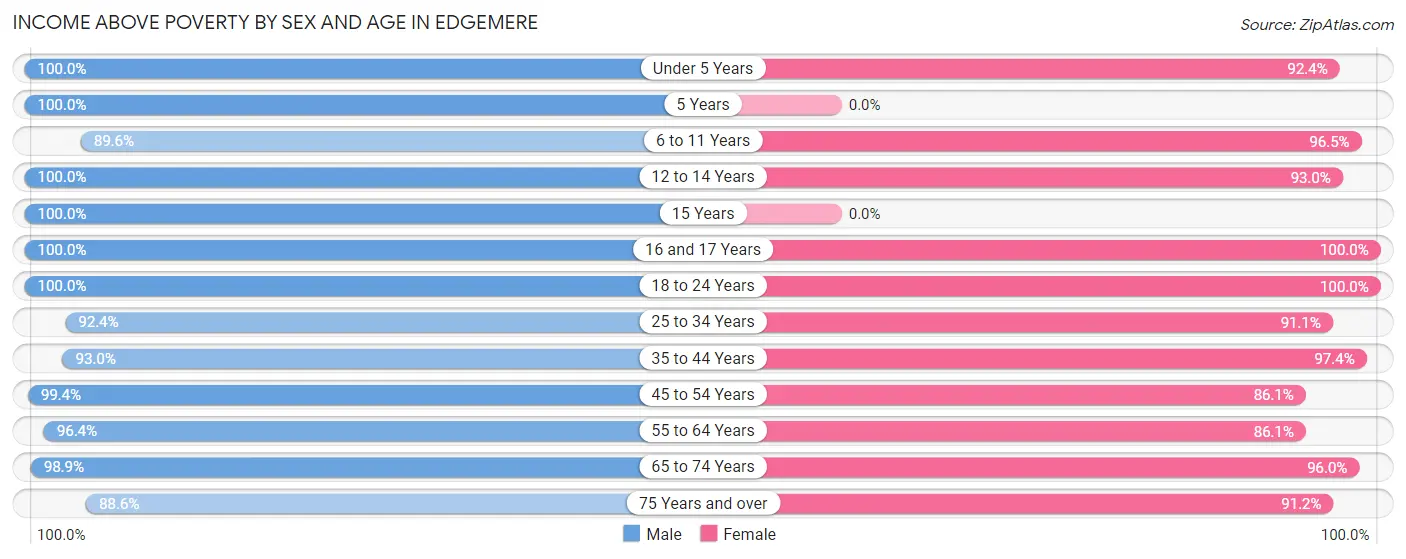
| Age Bracket | Male | Female |
| Under 5 Years | 235 (100.0%) | 303 (92.4%) |
| 5 Years | 32 (100.0%) | 0 (0.0%) |
| 6 to 11 Years | 189 (89.6%) | 272 (96.5%) |
| 12 to 14 Years | 221 (100.0%) | 238 (93.0%) |
| 15 Years | 44 (100.0%) | 0 (0.0%) |
| 16 and 17 Years | 93 (100.0%) | 81 (100.0%) |
| 18 to 24 Years | 235 (100.0%) | 316 (100.0%) |
| 25 to 34 Years | 403 (92.4%) | 462 (91.1%) |
| 35 to 44 Years | 620 (92.9%) | 595 (97.4%) |
| 45 to 54 Years | 495 (99.4%) | 322 (86.1%) |
| 55 to 64 Years | 755 (96.4%) | 602 (86.1%) |
| 65 to 74 Years | 518 (98.9%) | 629 (96.0%) |
| 75 Years and over | 241 (88.6%) | 458 (91.2%) |
| Total | 4,081 (96.0%) | 4,278 (92.4%) |
Income Below Poverty Among Married-Couple Families in Edgemere
The poverty statistics for married-couple families in Edgemere show that 0.9% or 15 of the total 1,732 families live below the poverty line. Families with 3 or 4 children have the highest poverty rate of 16.0%, comprising of 15 families. On the other hand, families with no children have the lowest poverty rate of 0.0%, which includes 0 families.
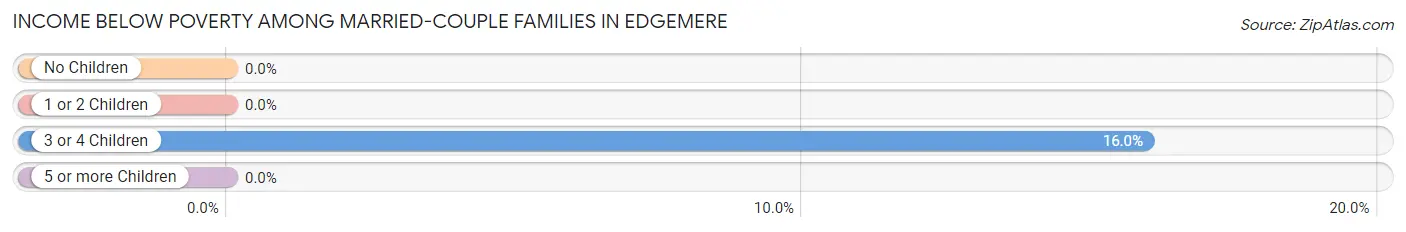
| Children | Above Poverty | Below Poverty |
| No Children | 1,076 (100.0%) | 0 (0.0%) |
| 1 or 2 Children | 553 (100.0%) | 0 (0.0%) |
| 3 or 4 Children | 79 (84.0%) | 15 (16.0%) |
| 5 or more Children | 9 (100.0%) | 0 (0.0%) |
| Total | 1,717 (99.1%) | 15 (0.9%) |
Income Below Poverty Among Single-Parent Households in Edgemere
According to the poverty data in Edgemere, 1.5% or 6 single-father households and 14.5% or 64 single-mother households are living below the poverty line. Among single-father households, those with no children have the highest poverty rate, with 6 households (3.1%) experiencing poverty. Likewise, among single-mother households, those with 1 or 2 children have the highest poverty rate, with 42 households (23.0%) falling below the poverty line.
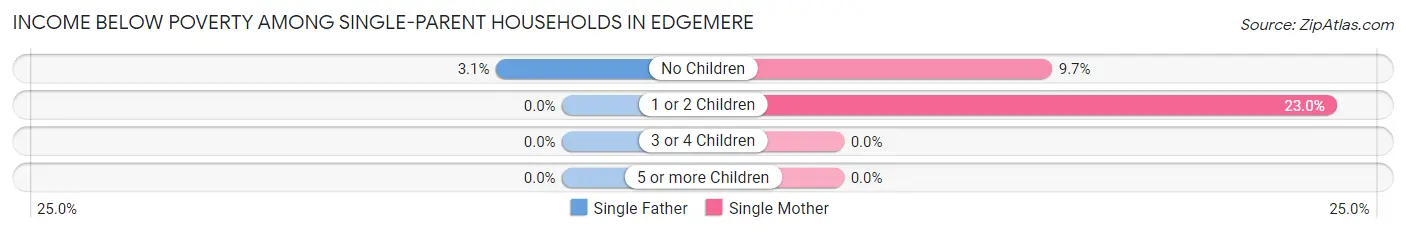
| Children | Single Father | Single Mother |
| No Children | 6 (3.1%) | 22 (9.7%) |
| 1 or 2 Children | 0 (0.0%) | 42 (23.0%) |
| 3 or 4 Children | 0 (0.0%) | 0 (0.0%) |
| 5 or more Children | 0 (0.0%) | 0 (0.0%) |
| Total | 6 (1.5%) | 64 (14.5%) |
Income Below Poverty Among Married-Couple vs Single-Parent Households in Edgemere
The poverty data for Edgemere shows that 15 of the married-couple family households (0.9%) and 70 of the single-parent households (8.2%) are living below the poverty level. Within the married-couple family households, those with 3 or 4 children have the highest poverty rate, with 15 households (16.0%) falling below the poverty line. Among the single-parent households, those with 1 or 2 children have the highest poverty rate, with 42 household (10.8%) living below poverty.
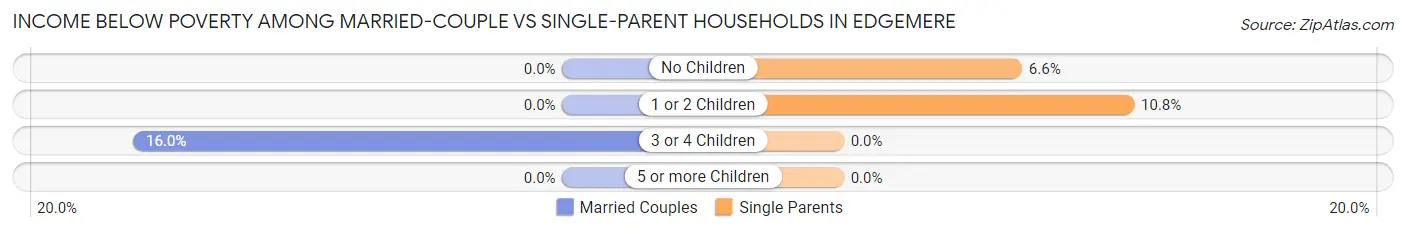
| Children | Married-Couple Families | Single-Parent Households |
| No Children | 0 (0.0%) | 28 (6.6%) |
| 1 or 2 Children | 0 (0.0%) | 42 (10.8%) |
| 3 or 4 Children | 15 (16.0%) | 0 (0.0%) |
| 5 or more Children | 0 (0.0%) | 0 (0.0%) |
| Total | 15 (0.9%) | 70 (8.2%) |
Employment Characteristics in Edgemere
Employment by Class of Employer in Edgemere
Among the 4,147 employed individuals in Edgemere, private company employees (2,595 | 62.6%), local government employees (363 | 8.7%), and federal government employees (279 | 6.7%) make up the most common classes of employment.
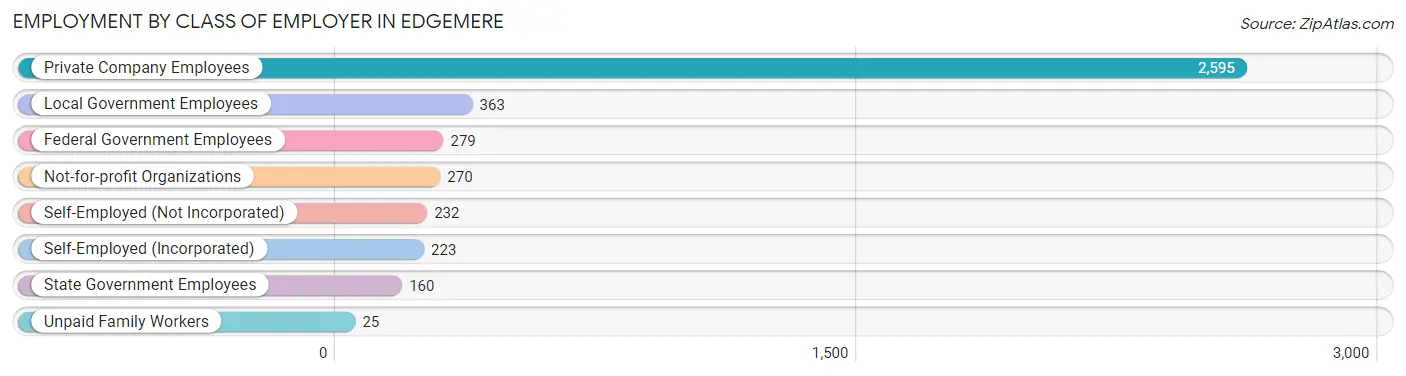
| Employer Class | # Employees | % Employees |
| Private Company Employees | 2,595 | 62.6% |
| Self-Employed (Incorporated) | 223 | 5.4% |
| Self-Employed (Not Incorporated) | 232 | 5.6% |
| Not-for-profit Organizations | 270 | 6.5% |
| Local Government Employees | 363 | 8.7% |
| State Government Employees | 160 | 3.9% |
| Federal Government Employees | 279 | 6.7% |
| Unpaid Family Workers | 25 | 0.6% |
| Total | 4,147 | 100.0% |
Employment Status by Age in Edgemere
According to the labor force statistics for Edgemere, out of the total population over 16 years of age (7,253), 59.5% or 4,316 individuals are in the labor force, with 3.1% or 134 of them unemployed. The age group with the highest labor force participation rate is 55 to 59 years, with 93.6% or 632 individuals in the labor force. Within the labor force, the 16 to 19 years age range has the highest percentage of unemployed individuals, with 44.2% or 50 of them being unemployed.
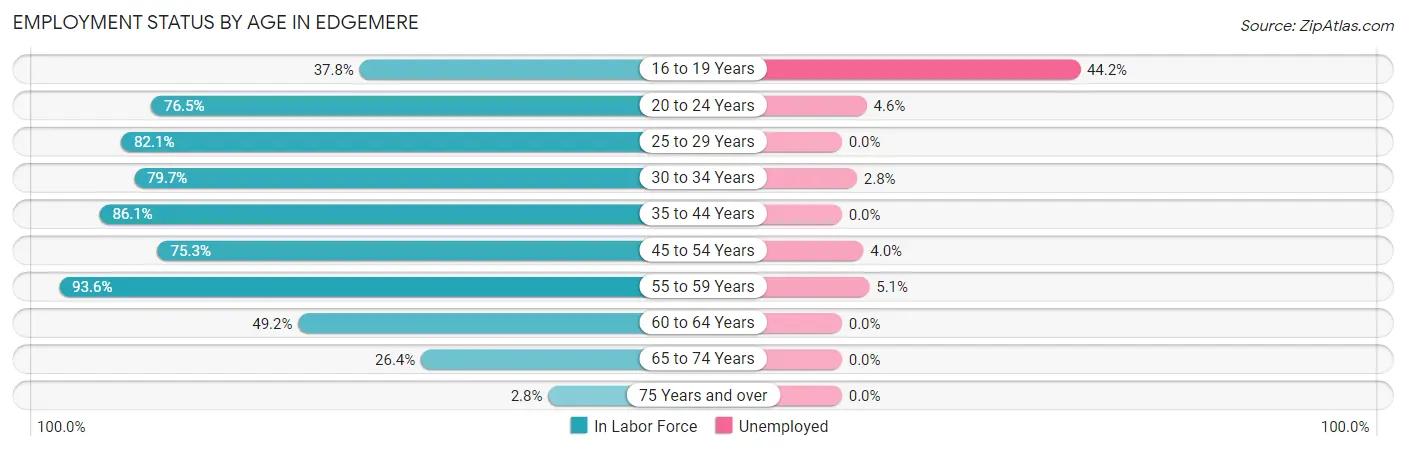
| Age Bracket | In Labor Force | Unemployed |
| 16 to 19 Years | 113 (37.8%) | 50 (44.2%) |
| 20 to 24 Years | 326 (76.5%) | 15 (4.6%) |
| 25 to 29 Years | 334 (82.1%) | 0 (0.0%) |
| 30 to 34 Years | 427 (79.7%) | 12 (2.8%) |
| 35 to 44 Years | 1,100 (86.1%) | 0 (0.0%) |
| 45 to 54 Years | 657 (75.3%) | 26 (4.0%) |
| 55 to 59 Years | 632 (93.6%) | 32 (5.1%) |
| 60 to 64 Years | 397 (49.2%) | 0 (0.0%) |
| 65 to 74 Years | 311 (26.4%) | 0 (0.0%) |
| 75 Years and over | 22 (2.8%) | 0 (0.0%) |
| Total | 4,316 (59.5%) | 134 (3.1%) |
Employment Status by Educational Attainment in Edgemere
According to labor force statistics for Edgemere, 77.5% of individuals (3,546) out of the total population between 25 and 64 years of age (4,575) are in the labor force, with 2.0% or 71 of them being unemployed. The group with the highest labor force participation rate are those with the educational attainment of bachelor's degree or higher, with 82.5% or 1,233 individuals in the labor force. Within the labor force, individuals with high school diploma education have the highest percentage of unemployment, with 3.4% or 38 of them being unemployed.
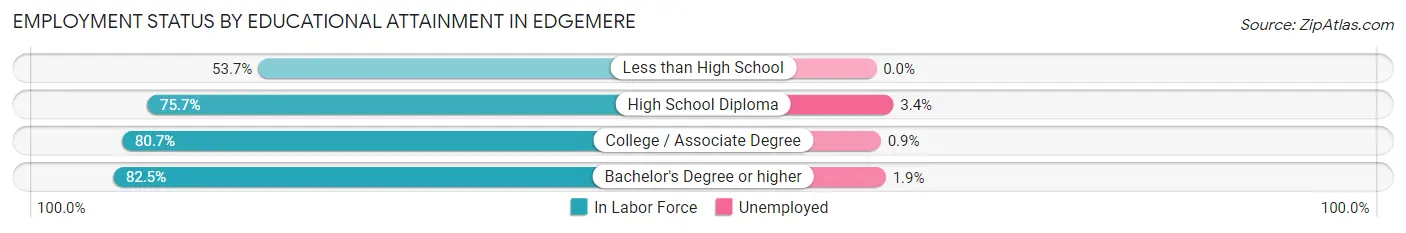
| Educational Attainment | In Labor Force | Unemployed |
| Less than High School | 194 (53.7%) | 0 (0.0%) |
| High School Diploma | 1,126 (75.7%) | 51 (3.4%) |
| College / Associate Degree | 994 (80.7%) | 11 (0.9%) |
| Bachelor's Degree or higher | 1,233 (82.5%) | 28 (1.9%) |
| Total | 3,546 (77.5%) | 92 (2.0%) |
Employment Occupations by Sex in Edgemere
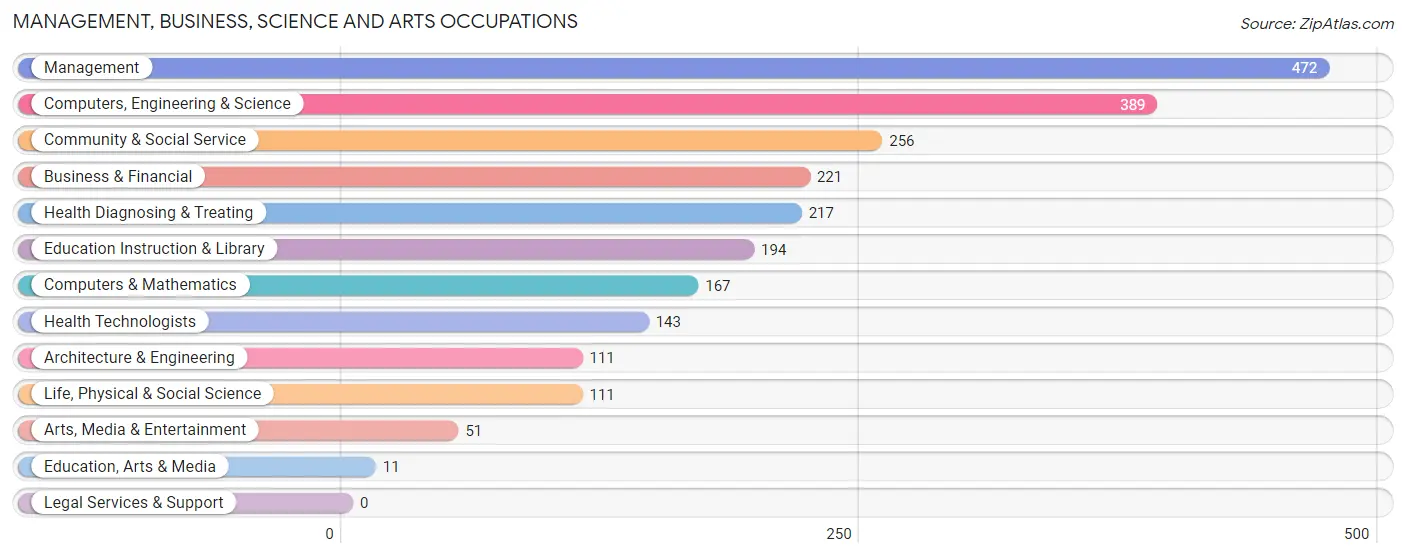
Management, Business, Science and Arts Occupations
The most common Management, Business, Science and Arts occupations in Edgemere are Management (472 | 11.3%), Computers, Engineering & Science (389 | 9.3%), Community & Social Service (256 | 6.1%), Business & Financial (221 | 5.3%), and Health Diagnosing & Treating (217 | 5.2%).
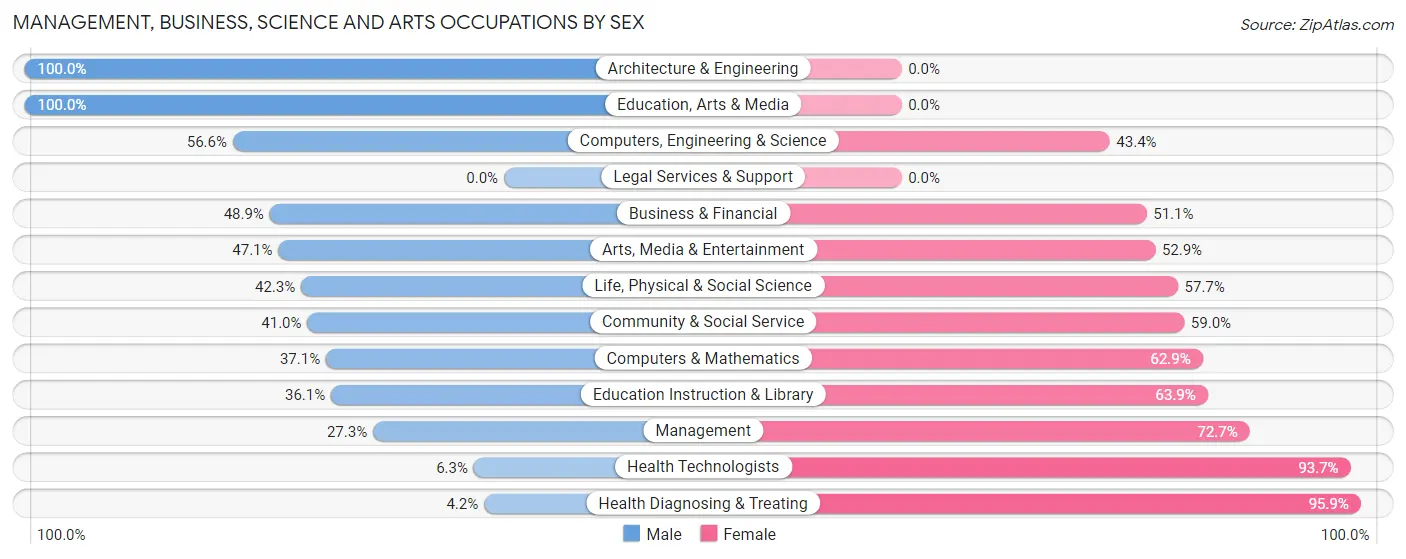
Management, Business, Science and Arts Occupations by Sex
Within the Management, Business, Science and Arts occupations in Edgemere, the most male-oriented occupations are Architecture & Engineering (100.0%), Education, Arts & Media (100.0%), and Computers, Engineering & Science (56.6%), while the most female-oriented occupations are Health Diagnosing & Treating (95.9%), Health Technologists (93.7%), and Management (72.7%).
| Occupation | Male | Female |
| Management | 129 (27.3%) | 343 (72.7%) |
| Business & Financial | 108 (48.9%) | 113 (51.1%) |
| Computers, Engineering & Science | 220 (56.6%) | 169 (43.4%) |
| Computers & Mathematics | 62 (37.1%) | 105 (62.9%) |
| Architecture & Engineering | 111 (100.0%) | 0 (0.0%) |
| Life, Physical & Social Science | 47 (42.3%) | 64 (57.7%) |
| Community & Social Service | 105 (41.0%) | 151 (59.0%) |
| Education, Arts & Media | 11 (100.0%) | 0 (0.0%) |
| Legal Services & Support | 0 (0.0%) | 0 (0.0%) |
| Education Instruction & Library | 70 (36.1%) | 124 (63.9%) |
| Arts, Media & Entertainment | 24 (47.1%) | 27 (52.9%) |
| Health Diagnosing & Treating | 9 (4.2%) | 208 (95.9%) |
| Health Technologists | 9 (6.3%) | 134 (93.7%) |
| Total (Category) | 571 (36.7%) | 984 (63.3%) |
| Total (Overall) | 2,347 (56.1%) | 1,837 (43.9%) |
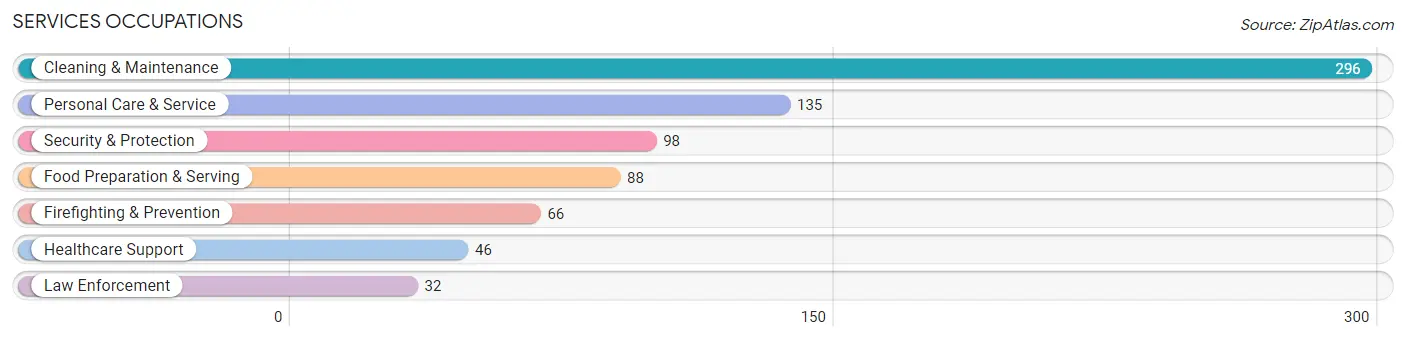
Services Occupations
The most common Services occupations in Edgemere are Cleaning & Maintenance (296 | 7.1%), Personal Care & Service (135 | 3.2%), Security & Protection (98 | 2.3%), Food Preparation & Serving (88 | 2.1%), and Firefighting & Prevention (66 | 1.6%).
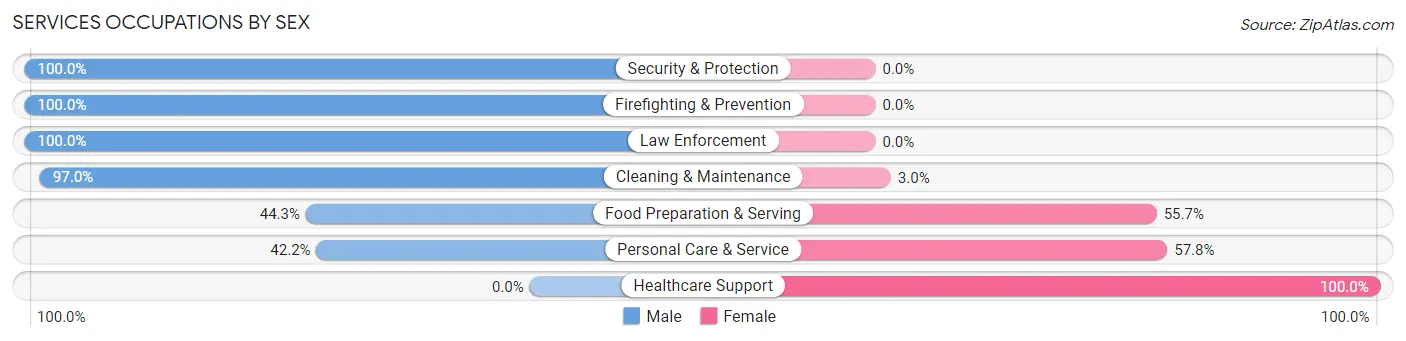
Services Occupations by Sex
Within the Services occupations in Edgemere, the most male-oriented occupations are Security & Protection (100.0%), Firefighting & Prevention (100.0%), and Law Enforcement (100.0%), while the most female-oriented occupations are Healthcare Support (100.0%), Personal Care & Service (57.8%), and Food Preparation & Serving (55.7%).
| Occupation | Male | Female |
| Healthcare Support | 0 (0.0%) | 46 (100.0%) |
| Security & Protection | 98 (100.0%) | 0 (0.0%) |
| Firefighting & Prevention | 66 (100.0%) | 0 (0.0%) |
| Law Enforcement | 32 (100.0%) | 0 (0.0%) |
| Food Preparation & Serving | 39 (44.3%) | 49 (55.7%) |
| Cleaning & Maintenance | 287 (97.0%) | 9 (3.0%) |
| Personal Care & Service | 57 (42.2%) | 78 (57.8%) |
| Total (Category) | 481 (72.6%) | 182 (27.5%) |
| Total (Overall) | 2,347 (56.1%) | 1,837 (43.9%) |
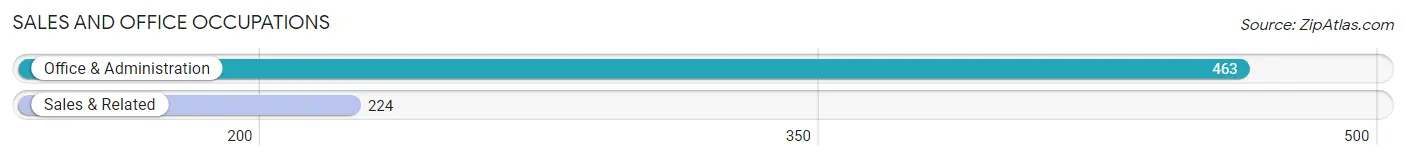
Sales and Office Occupations
The most common Sales and Office occupations in Edgemere are Office & Administration (463 | 11.1%), and Sales & Related (224 | 5.3%).
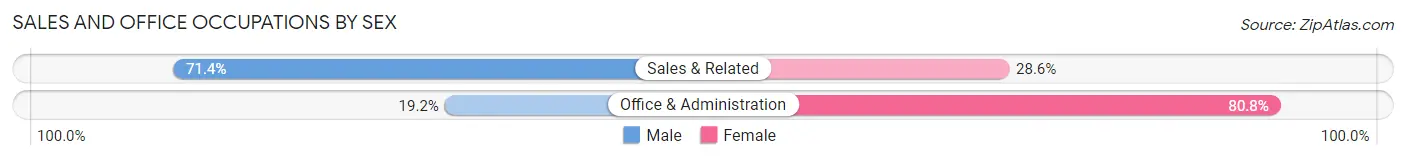
Sales and Office Occupations by Sex
| Occupation | Male | Female |
| Sales & Related | 160 (71.4%) | 64 (28.6%) |
| Office & Administration | 89 (19.2%) | 374 (80.8%) |
| Total (Category) | 249 (36.2%) | 438 (63.8%) |
| Total (Overall) | 2,347 (56.1%) | 1,837 (43.9%) |
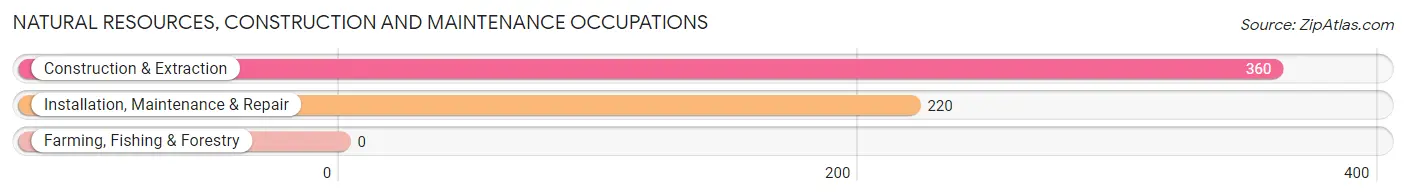
Natural Resources, Construction and Maintenance Occupations
The most common Natural Resources, Construction and Maintenance occupations in Edgemere are Construction & Extraction (360 | 8.6%), and Installation, Maintenance & Repair (220 | 5.3%).
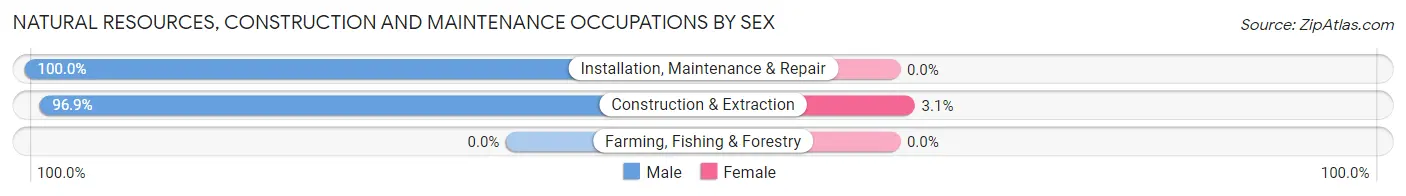
Natural Resources, Construction and Maintenance Occupations by Sex
| Occupation | Male | Female |
| Farming, Fishing & Forestry | 0 (0.0%) | 0 (0.0%) |
| Construction & Extraction | 349 (96.9%) | 11 (3.1%) |
| Installation, Maintenance & Repair | 220 (100.0%) | 0 (0.0%) |
| Total (Category) | 569 (98.1%) | 11 (1.9%) |
| Total (Overall) | 2,347 (56.1%) | 1,837 (43.9%) |
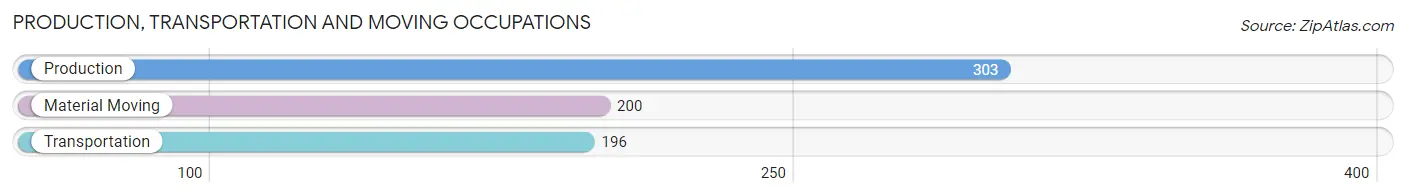
Production, Transportation and Moving Occupations
The most common Production, Transportation and Moving occupations in Edgemere are Production (303 | 7.2%), Material Moving (200 | 4.8%), and Transportation (196 | 4.7%).
Production, Transportation and Moving Occupations by Sex
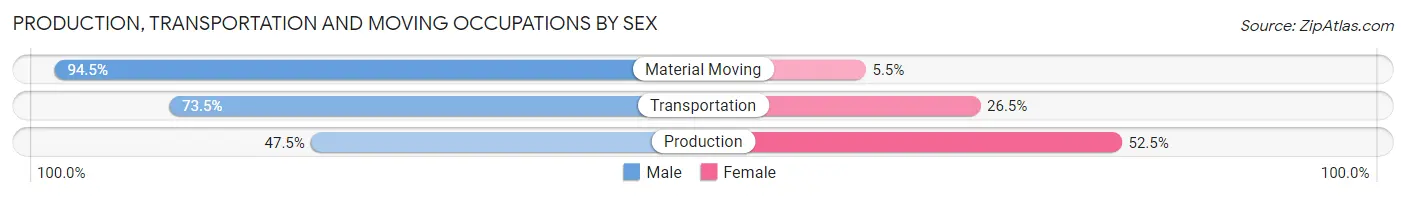
| Occupation | Male | Female |
| Production | 144 (47.5%) | 159 (52.5%) |
| Transportation | 144 (73.5%) | 52 (26.5%) |
| Material Moving | 189 (94.5%) | 11 (5.5%) |
| Total (Category) | 477 (68.2%) | 222 (31.8%) |
| Total (Overall) | 2,347 (56.1%) | 1,837 (43.9%) |
Employment Industries by Sex in Edgemere
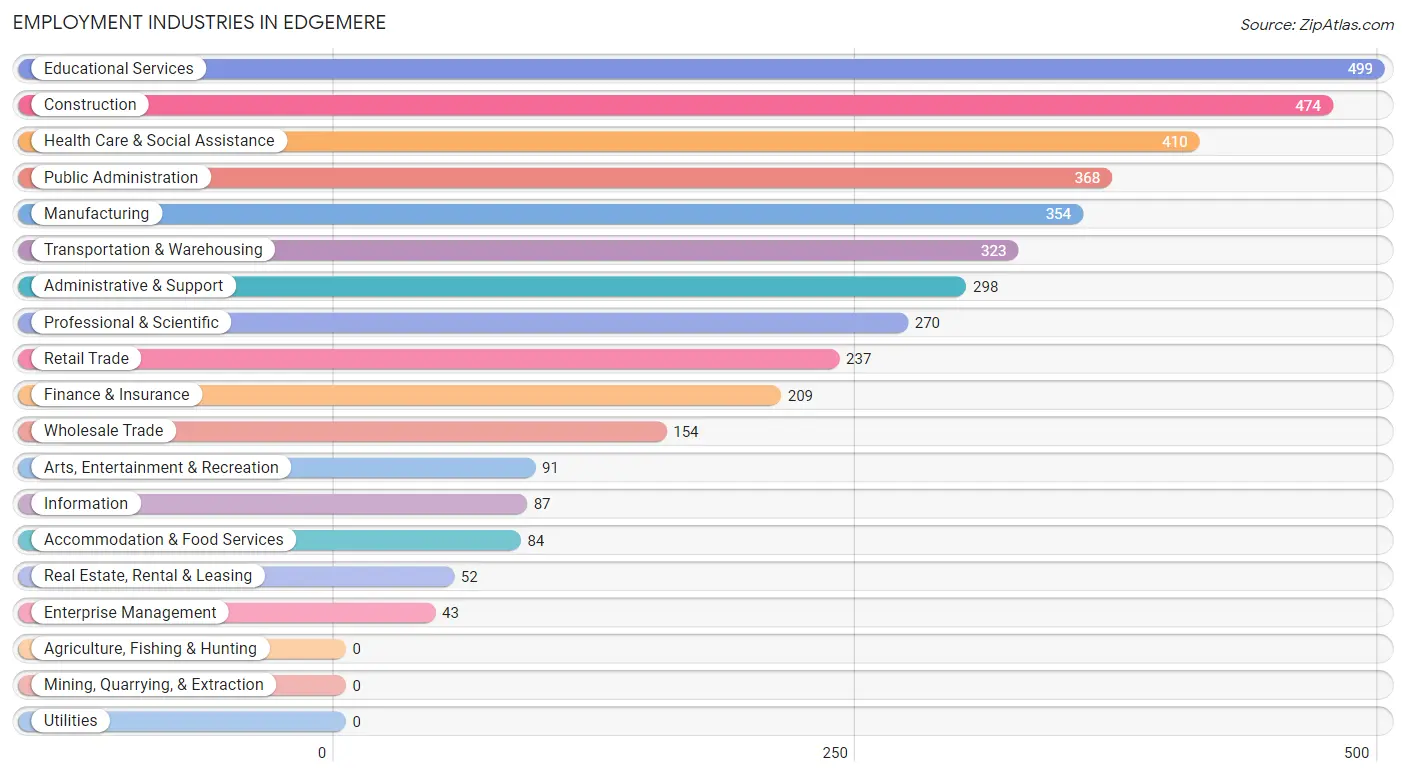
Employment Industries in Edgemere
The major employment industries in Edgemere include Educational Services (499 | 11.9%), Construction (474 | 11.3%), Health Care & Social Assistance (410 | 9.8%), Public Administration (368 | 8.8%), and Manufacturing (354 | 8.5%).
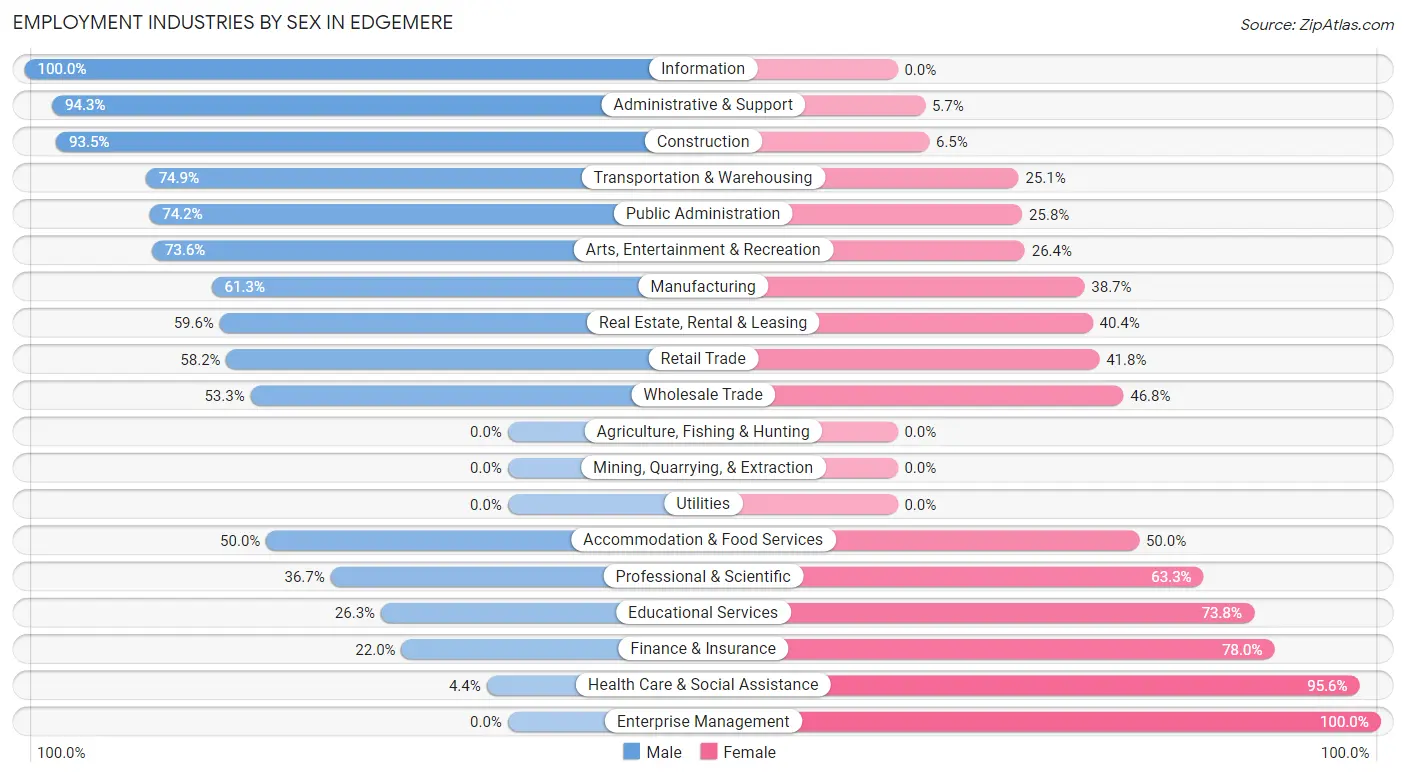
Employment Industries by Sex in Edgemere
The Edgemere industries that see more men than women are Information (100.0%), Administrative & Support (94.3%), and Construction (93.5%), whereas the industries that tend to have a higher number of women are Enterprise Management (100.0%), Health Care & Social Assistance (95.6%), and Finance & Insurance (78.0%).
| Industry | Male | Female |
| Agriculture, Fishing & Hunting | 0 (0.0%) | 0 (0.0%) |
| Mining, Quarrying, & Extraction | 0 (0.0%) | 0 (0.0%) |
| Construction | 443 (93.5%) | 31 (6.5%) |
| Manufacturing | 217 (61.3%) | 137 (38.7%) |
| Wholesale Trade | 82 (53.2%) | 72 (46.8%) |
| Retail Trade | 138 (58.2%) | 99 (41.8%) |
| Transportation & Warehousing | 242 (74.9%) | 81 (25.1%) |
| Utilities | 0 (0.0%) | 0 (0.0%) |
| Information | 87 (100.0%) | 0 (0.0%) |
| Finance & Insurance | 46 (22.0%) | 163 (78.0%) |
| Real Estate, Rental & Leasing | 31 (59.6%) | 21 (40.4%) |
| Professional & Scientific | 99 (36.7%) | 171 (63.3%) |
| Enterprise Management | 0 (0.0%) | 43 (100.0%) |
| Administrative & Support | 281 (94.3%) | 17 (5.7%) |
| Educational Services | 131 (26.3%) | 368 (73.8%) |
| Health Care & Social Assistance | 18 (4.4%) | 392 (95.6%) |
| Arts, Entertainment & Recreation | 67 (73.6%) | 24 (26.4%) |
| Accommodation & Food Services | 42 (50.0%) | 42 (50.0%) |
| Public Administration | 273 (74.2%) | 95 (25.8%) |
| Total | 2,347 (56.1%) | 1,837 (43.9%) |
Education in Edgemere
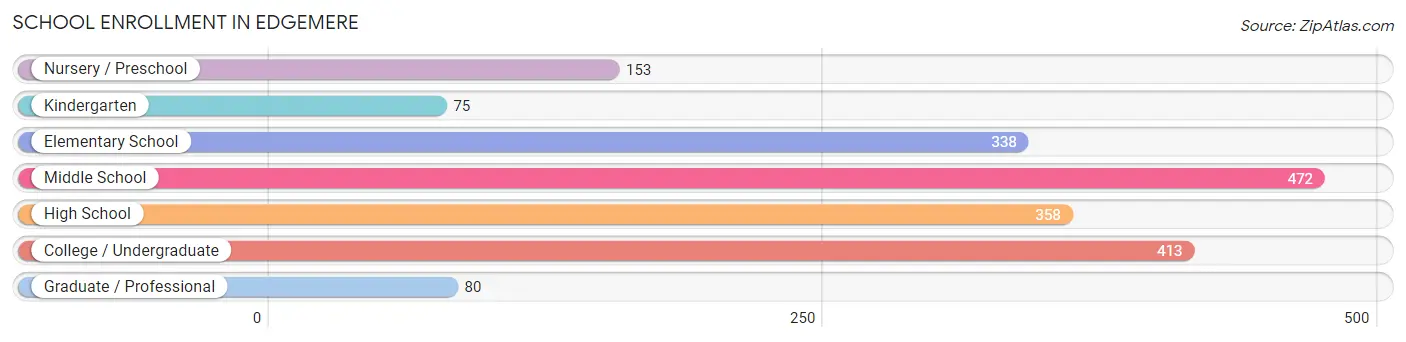
School Enrollment in Edgemere
The most common levels of schooling among the 1,889 students in Edgemere are middle school (472 | 25.0%), college / undergraduate (413 | 21.9%), and high school (358 | 19.0%).
| School Level | # Students | % Students |
| Nursery / Preschool | 153 | 8.1% |
| Kindergarten | 75 | 4.0% |
| Elementary School | 338 | 17.9% |
| Middle School | 472 | 25.0% |
| High School | 358 | 19.0% |
| College / Undergraduate | 413 | 21.9% |
| Graduate / Professional | 80 | 4.2% |
| Total | 1,889 | 100.0% |
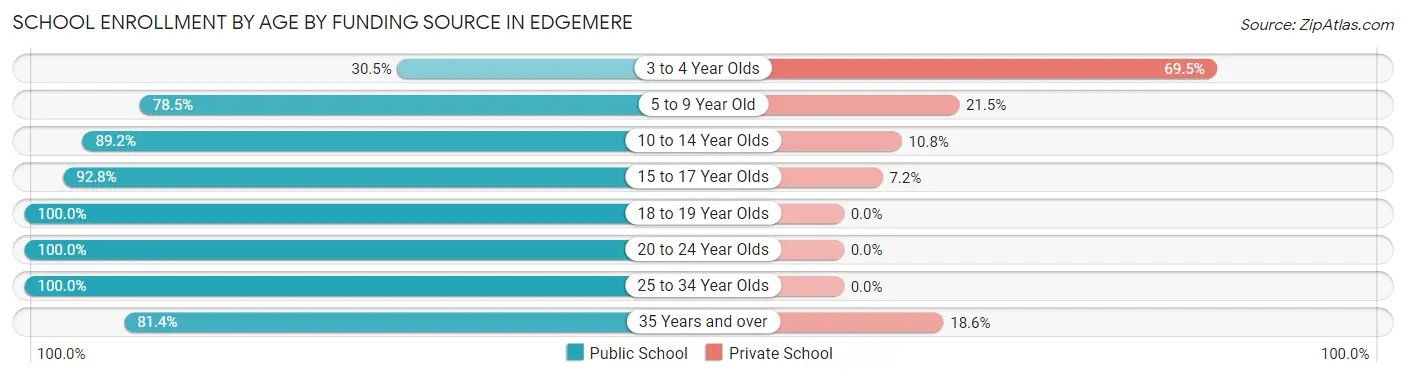
School Enrollment by Age by Funding Source in Edgemere
Out of a total of 1,889 students who are enrolled in schools in Edgemere, 289 (15.3%) attend a private institution, while the remaining 1,600 (84.7%) are enrolled in public schools. The age group of 3 to 4 year olds has the highest likelihood of being enrolled in private schools, with 91 (69.5% in the age bracket) enrolled. Conversely, the age group of 18 to 19 year olds has the lowest likelihood of being enrolled in a private school, with 111 (100.0% in the age bracket) attending a public institution.
| Age Bracket | Public School | Private School |
| 3 to 4 Year Olds | 40 (30.5%) | 91 (69.5%) |
| 5 to 9 Year Old | 307 (78.5%) | 84 (21.5%) |
| 10 to 14 Year Olds | 545 (89.2%) | 66 (10.8%) |
| 15 to 17 Year Olds | 218 (92.8%) | 17 (7.2%) |
| 18 to 19 Year Olds | 111 (100.0%) | 0 (0.0%) |
| 20 to 24 Year Olds | 155 (100.0%) | 0 (0.0%) |
| 25 to 34 Year Olds | 88 (100.0%) | 0 (0.0%) |
| 35 Years and over | 136 (81.4%) | 31 (18.6%) |
| Total | 1,600 (84.7%) | 289 (15.3%) |
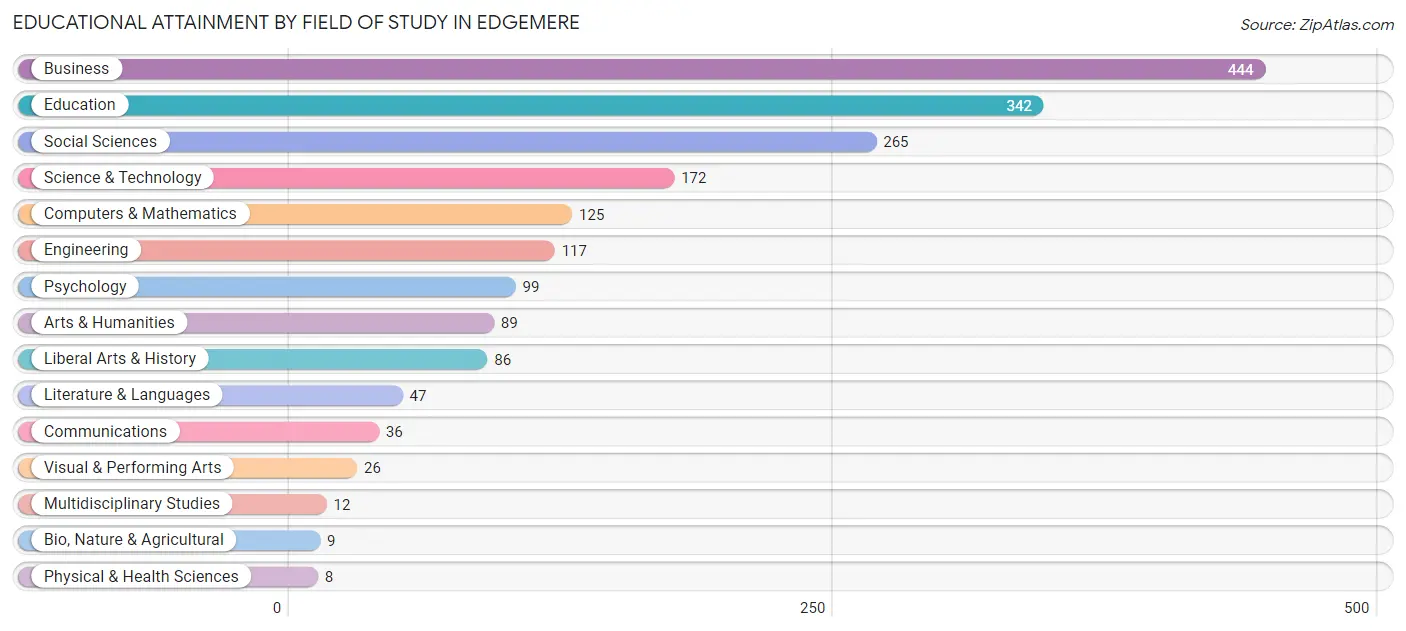
Educational Attainment by Field of Study in Edgemere
Business (444 | 23.6%), education (342 | 18.2%), social sciences (265 | 14.1%), science & technology (172 | 9.2%), and computers & mathematics (125 | 6.7%) are the most common fields of study among 1,877 individuals in Edgemere who have obtained a bachelor's degree or higher.
| Field of Study | # Graduates | % Graduates |
| Computers & Mathematics | 125 | 6.7% |
| Bio, Nature & Agricultural | 9 | 0.5% |
| Physical & Health Sciences | 8 | 0.4% |
| Psychology | 99 | 5.3% |
| Social Sciences | 265 | 14.1% |
| Engineering | 117 | 6.2% |
| Multidisciplinary Studies | 12 | 0.6% |
| Science & Technology | 172 | 9.2% |
| Business | 444 | 23.6% |
| Education | 342 | 18.2% |
| Literature & Languages | 47 | 2.5% |
| Liberal Arts & History | 86 | 4.6% |
| Visual & Performing Arts | 26 | 1.4% |
| Communications | 36 | 1.9% |
| Arts & Humanities | 89 | 4.7% |
| Total | 1,877 | 100.0% |
Transportation & Commute in Edgemere
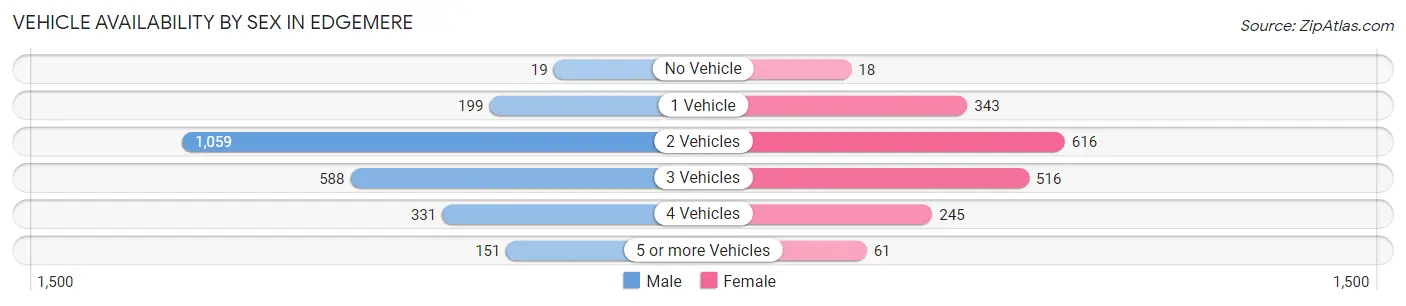
Vehicle Availability by Sex in Edgemere
The most prevalent vehicle ownership categories in Edgemere are males with 2 vehicles (1,059, accounting for 45.1%) and females with 2 vehicles (616, making up 58.9%).
| Vehicles Available | Male | Female |
| No Vehicle | 19 (0.8%) | 18 (1.0%) |
| 1 Vehicle | 199 (8.5%) | 343 (19.1%) |
| 2 Vehicles | 1,059 (45.1%) | 616 (34.2%) |
| 3 Vehicles | 588 (25.1%) | 516 (28.7%) |
| 4 Vehicles | 331 (14.1%) | 245 (13.6%) |
| 5 or more Vehicles | 151 (6.4%) | 61 (3.4%) |
| Total | 2,347 (100.0%) | 1,799 (100.0%) |
Commute Time in Edgemere
The most frequently occuring commute durations in Edgemere are 15 to 19 minutes (762 commuters, 20.5%), 30 to 34 minutes (633 commuters, 17.1%), and 20 to 24 minutes (531 commuters, 14.3%).
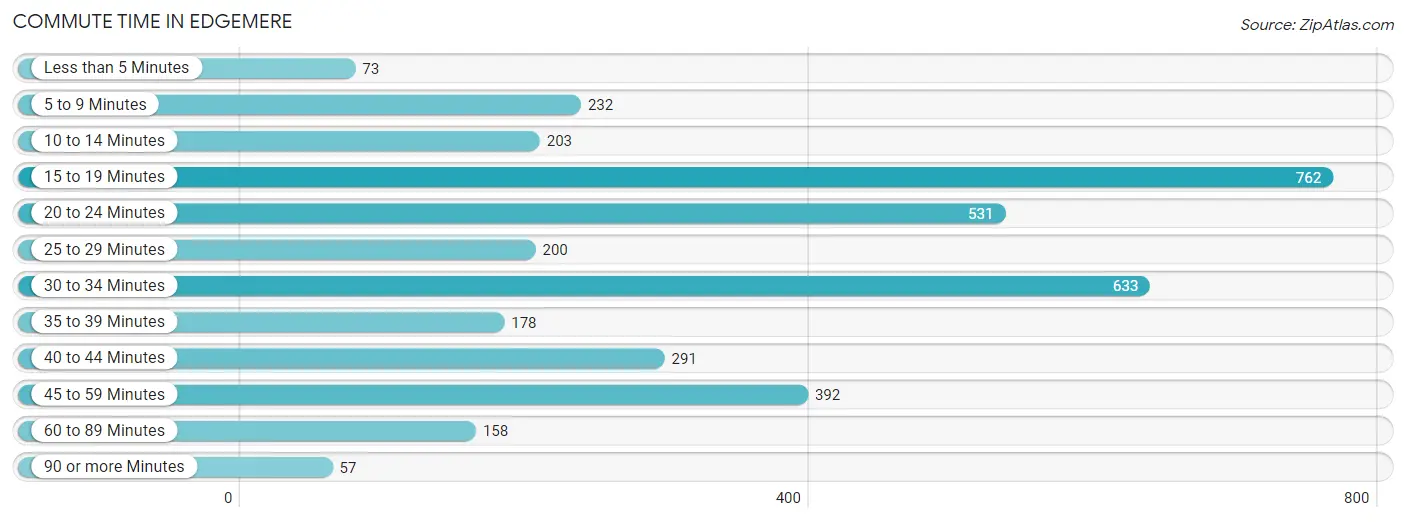
| Commute Time | # Commuters | % Commuters |
| Less than 5 Minutes | 73 | 2.0% |
| 5 to 9 Minutes | 232 | 6.2% |
| 10 to 14 Minutes | 203 | 5.5% |
| 15 to 19 Minutes | 762 | 20.5% |
| 20 to 24 Minutes | 531 | 14.3% |
| 25 to 29 Minutes | 200 | 5.4% |
| 30 to 34 Minutes | 633 | 17.1% |
| 35 to 39 Minutes | 178 | 4.8% |
| 40 to 44 Minutes | 291 | 7.8% |
| 45 to 59 Minutes | 392 | 10.6% |
| 60 to 89 Minutes | 158 | 4.3% |
| 90 or more Minutes | 57 | 1.5% |
Commute Time by Sex in Edgemere
The most common commute times in Edgemere are 15 to 19 minutes (455 commuters, 21.4%) for males and 15 to 19 minutes (307 commuters, 19.3%) for females.
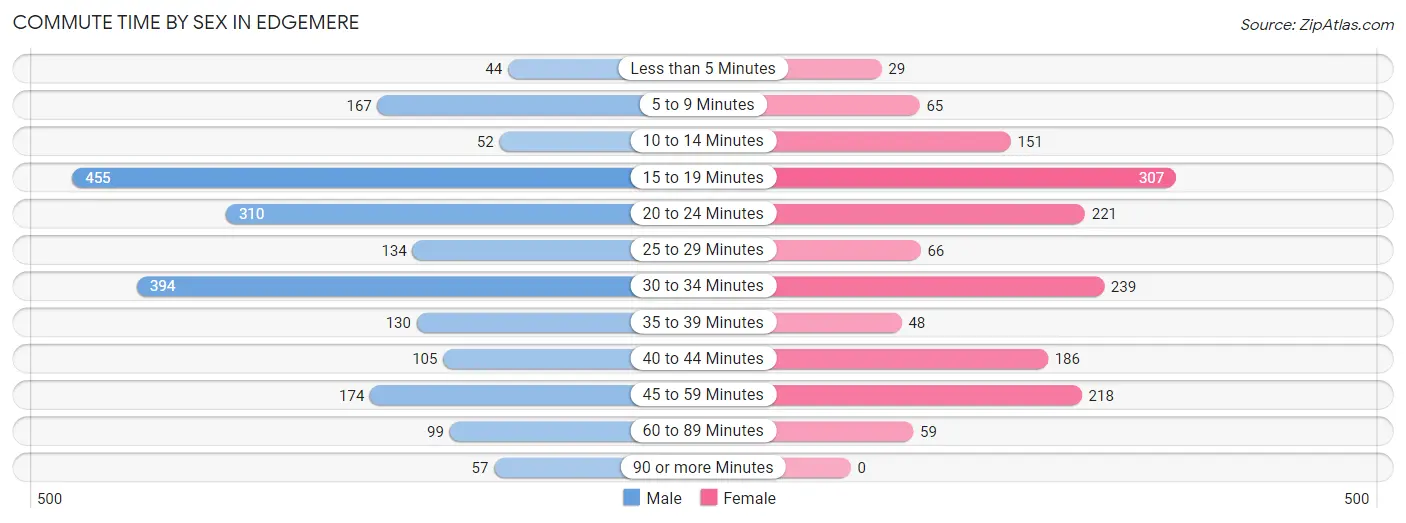
| Commute Time | Male | Female |
| Less than 5 Minutes | 44 (2.1%) | 29 (1.8%) |
| 5 to 9 Minutes | 167 (7.9%) | 65 (4.1%) |
| 10 to 14 Minutes | 52 (2.5%) | 151 (9.5%) |
| 15 to 19 Minutes | 455 (21.4%) | 307 (19.3%) |
| 20 to 24 Minutes | 310 (14.6%) | 221 (13.9%) |
| 25 to 29 Minutes | 134 (6.3%) | 66 (4.2%) |
| 30 to 34 Minutes | 394 (18.6%) | 239 (15.0%) |
| 35 to 39 Minutes | 130 (6.1%) | 48 (3.0%) |
| 40 to 44 Minutes | 105 (5.0%) | 186 (11.7%) |
| 45 to 59 Minutes | 174 (8.2%) | 218 (13.7%) |
| 60 to 89 Minutes | 99 (4.7%) | 59 (3.7%) |
| 90 or more Minutes | 57 (2.7%) | 0 (0.0%) |
Time of Departure to Work by Sex in Edgemere
The most frequent times of departure to work in Edgemere are 6:30 AM to 6:59 AM (434, 20.5%) for males and 7:30 AM to 7:59 AM (343, 21.6%) for females.
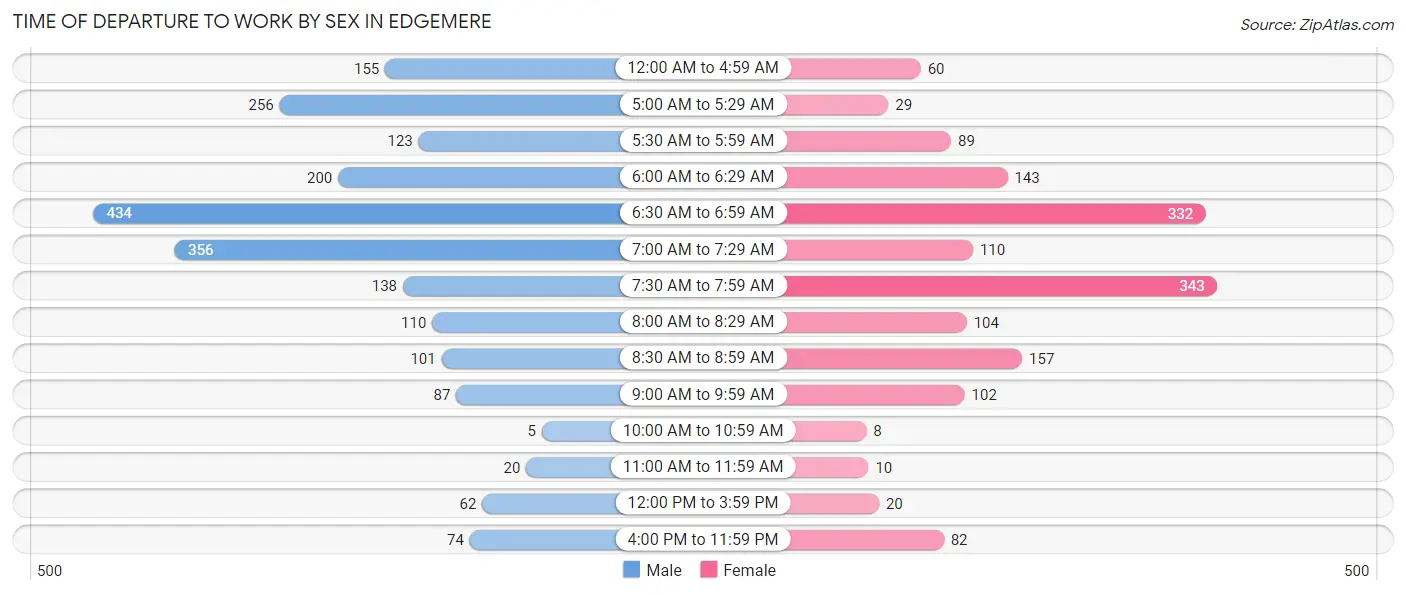
| Time of Departure | Male | Female |
| 12:00 AM to 4:59 AM | 155 (7.3%) | 60 (3.8%) |
| 5:00 AM to 5:29 AM | 256 (12.1%) | 29 (1.8%) |
| 5:30 AM to 5:59 AM | 123 (5.8%) | 89 (5.6%) |
| 6:00 AM to 6:29 AM | 200 (9.4%) | 143 (9.0%) |
| 6:30 AM to 6:59 AM | 434 (20.5%) | 332 (20.9%) |
| 7:00 AM to 7:29 AM | 356 (16.8%) | 110 (6.9%) |
| 7:30 AM to 7:59 AM | 138 (6.5%) | 343 (21.6%) |
| 8:00 AM to 8:29 AM | 110 (5.2%) | 104 (6.5%) |
| 8:30 AM to 8:59 AM | 101 (4.8%) | 157 (9.9%) |
| 9:00 AM to 9:59 AM | 87 (4.1%) | 102 (6.4%) |
| 10:00 AM to 10:59 AM | 5 (0.2%) | 8 (0.5%) |
| 11:00 AM to 11:59 AM | 20 (0.9%) | 10 (0.6%) |
| 12:00 PM to 3:59 PM | 62 (2.9%) | 20 (1.3%) |
| 4:00 PM to 11:59 PM | 74 (3.5%) | 82 (5.2%) |
| Total | 2,121 (100.0%) | 1,589 (100.0%) |
Housing Occupancy in Edgemere
Occupancy by Ownership in Edgemere
Of the total 3,414 dwellings in Edgemere, owner-occupied units account for 2,902 (85.0%), while renter-occupied units make up 512 (15.0%).
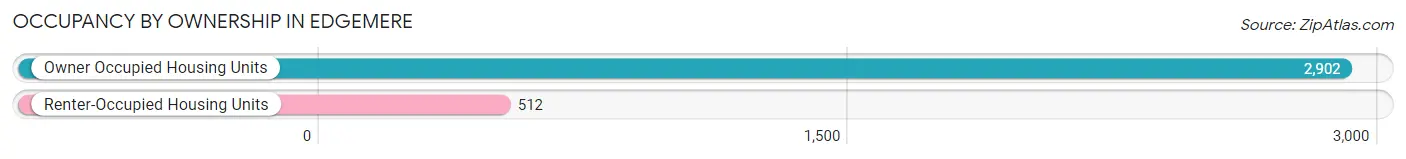
| Occupancy | # Housing Units | % Housing Units |
| Owner Occupied Housing Units | 2,902 | 85.0% |
| Renter-Occupied Housing Units | 512 | 15.0% |
| Total Occupied Housing Units | 3,414 | 100.0% |
Occupancy by Household Size in Edgemere
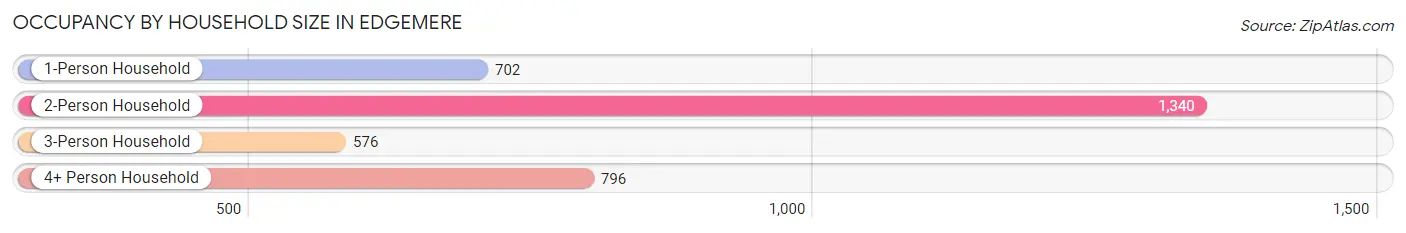
| Household Size | # Housing Units | % Housing Units |
| 1-Person Household | 702 | 20.6% |
| 2-Person Household | 1,340 | 39.3% |
| 3-Person Household | 576 | 16.9% |
| 4+ Person Household | 796 | 23.3% |
| Total Housing Units | 3,414 | 100.0% |
Occupancy by Ownership by Household Size in Edgemere
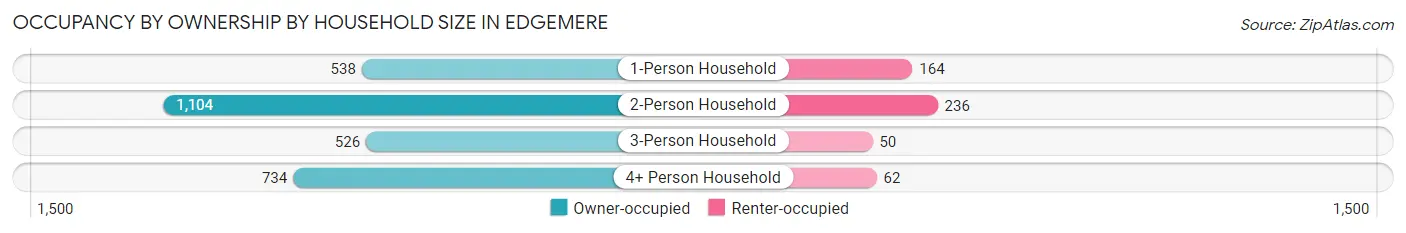
| Household Size | Owner-occupied | Renter-occupied |
| 1-Person Household | 538 (76.6%) | 164 (23.4%) |
| 2-Person Household | 1,104 (82.4%) | 236 (17.6%) |
| 3-Person Household | 526 (91.3%) | 50 (8.7%) |
| 4+ Person Household | 734 (92.2%) | 62 (7.8%) |
| Total Housing Units | 2,902 (85.0%) | 512 (15.0%) |
Occupancy by Educational Attainment in Edgemere

| Household Size | Owner-occupied | Renter-occupied |
| Less than High School | 257 (88.6%) | 33 (11.4%) |
| High School Diploma | 930 (78.3%) | 258 (21.7%) |
| College/Associate Degree | 919 (88.6%) | 118 (11.4%) |
| Bachelor's Degree or higher | 796 (88.5%) | 103 (11.5%) |
Occupancy by Age of Householder in Edgemere
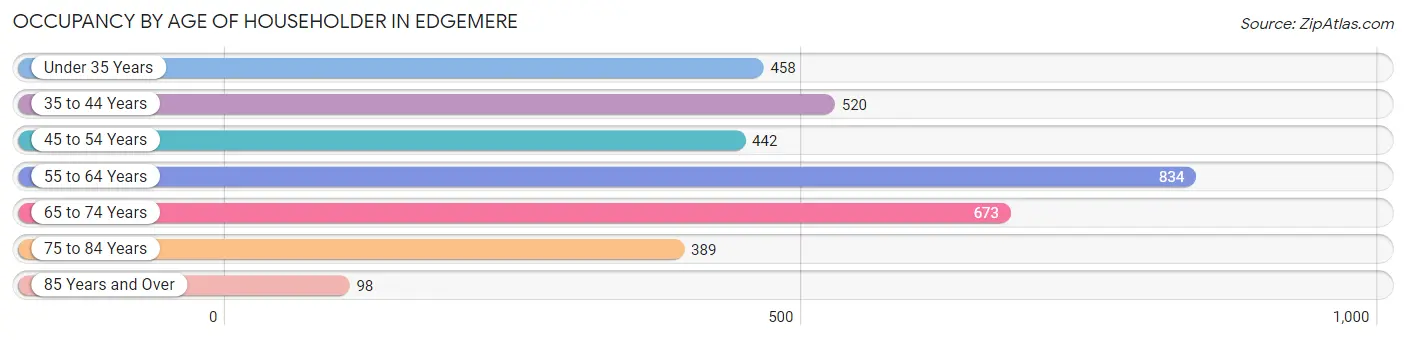
| Age Bracket | # Households | % Households |
| Under 35 Years | 458 | 13.4% |
| 35 to 44 Years | 520 | 15.2% |
| 45 to 54 Years | 442 | 13.0% |
| 55 to 64 Years | 834 | 24.4% |
| 65 to 74 Years | 673 | 19.7% |
| 75 to 84 Years | 389 | 11.4% |
| 85 Years and Over | 98 | 2.9% |
| Total | 3,414 | 100.0% |
Housing Finances in Edgemere
Median Income by Occupancy in Edgemere
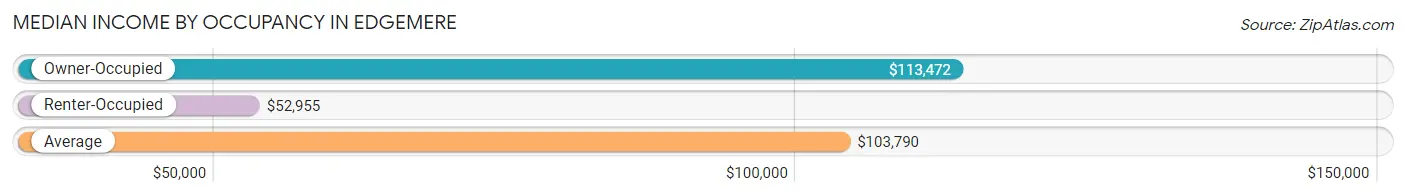
| Occupancy Type | # Households | Median Income |
| Owner-Occupied | 2,902 (85.0%) | $113,472 |
| Renter-Occupied | 512 (15.0%) | $52,955 |
| Average | 3,414 (100.0%) | $103,790 |
Occupancy by Householder Income Bracket in Edgemere
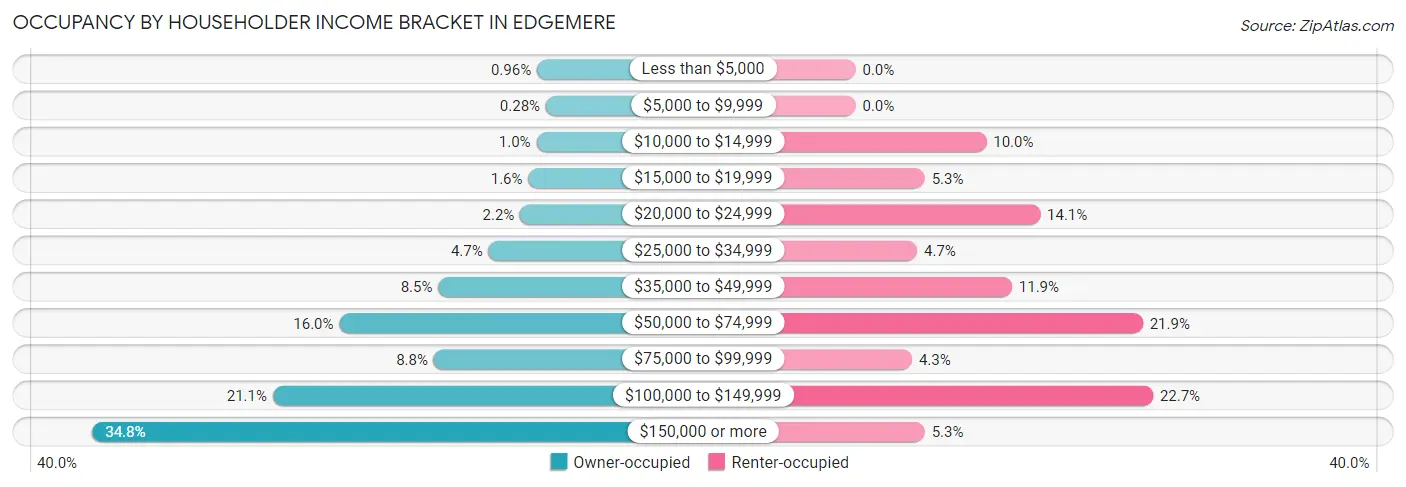
| Income Bracket | Owner-occupied | Renter-occupied |
| Less than $5,000 | 28 (1.0%) | 0 (0.0%) |
| $5,000 to $9,999 | 8 (0.3%) | 0 (0.0%) |
| $10,000 to $14,999 | 29 (1.0%) | 51 (10.0%) |
| $15,000 to $19,999 | 47 (1.6%) | 27 (5.3%) |
| $20,000 to $24,999 | 65 (2.2%) | 72 (14.1%) |
| $25,000 to $34,999 | 135 (4.6%) | 24 (4.7%) |
| $35,000 to $49,999 | 246 (8.5%) | 61 (11.9%) |
| $50,000 to $74,999 | 465 (16.0%) | 112 (21.9%) |
| $75,000 to $99,999 | 256 (8.8%) | 22 (4.3%) |
| $100,000 to $149,999 | 612 (21.1%) | 116 (22.7%) |
| $150,000 or more | 1,011 (34.8%) | 27 (5.3%) |
| Total | 2,902 (100.0%) | 512 (100.0%) |
Monthly Housing Cost Tiers in Edgemere
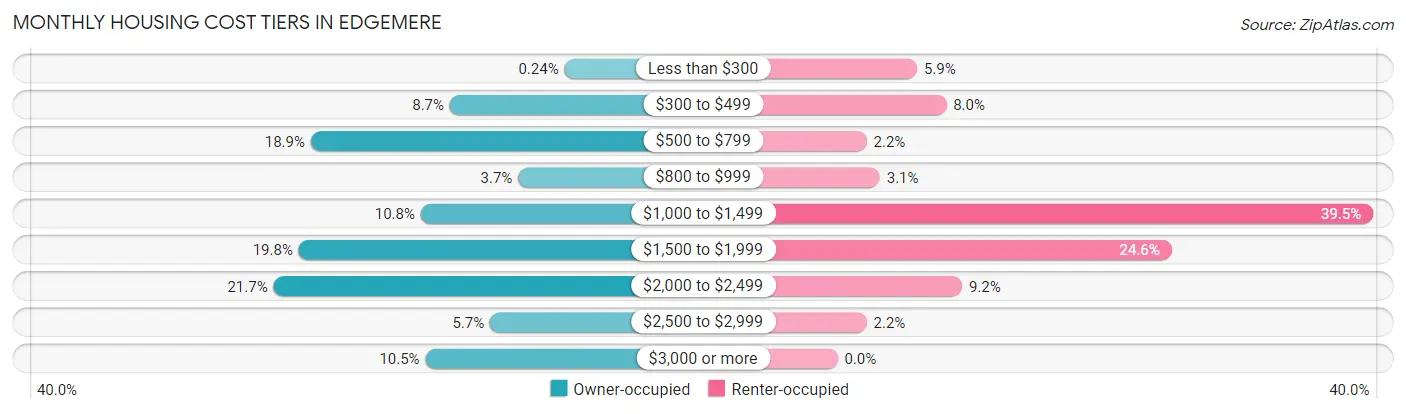
| Monthly Cost | Owner-occupied | Renter-occupied |
| Less than $300 | 7 (0.2%) | 30 (5.9%) |
| $300 to $499 | 252 (8.7%) | 41 (8.0%) |
| $500 to $799 | 549 (18.9%) | 11 (2.1%) |
| $800 to $999 | 106 (3.6%) | 16 (3.1%) |
| $1,000 to $1,499 | 314 (10.8%) | 202 (39.5%) |
| $1,500 to $1,999 | 575 (19.8%) | 126 (24.6%) |
| $2,000 to $2,499 | 629 (21.7%) | 47 (9.2%) |
| $2,500 to $2,999 | 166 (5.7%) | 11 (2.1%) |
| $3,000 or more | 304 (10.5%) | 0 (0.0%) |
| Total | 2,902 (100.0%) | 512 (100.0%) |
Physical Housing Characteristics in Edgemere
Housing Structures in Edgemere
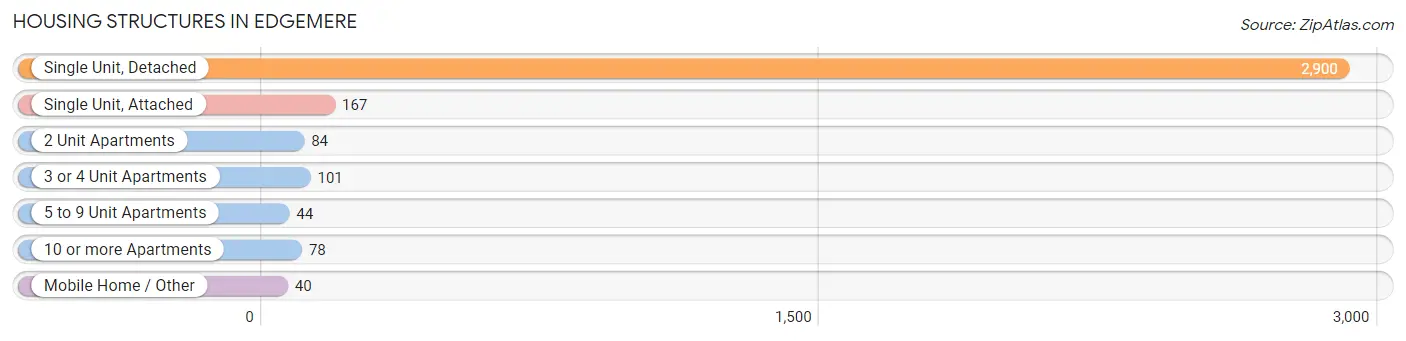
| Structure Type | # Housing Units | % Housing Units |
| Single Unit, Detached | 2,900 | 84.9% |
| Single Unit, Attached | 167 | 4.9% |
| 2 Unit Apartments | 84 | 2.5% |
| 3 or 4 Unit Apartments | 101 | 3.0% |
| 5 to 9 Unit Apartments | 44 | 1.3% |
| 10 or more Apartments | 78 | 2.3% |
| Mobile Home / Other | 40 | 1.2% |
| Total | 3,414 | 100.0% |
Housing Structures by Occupancy in Edgemere
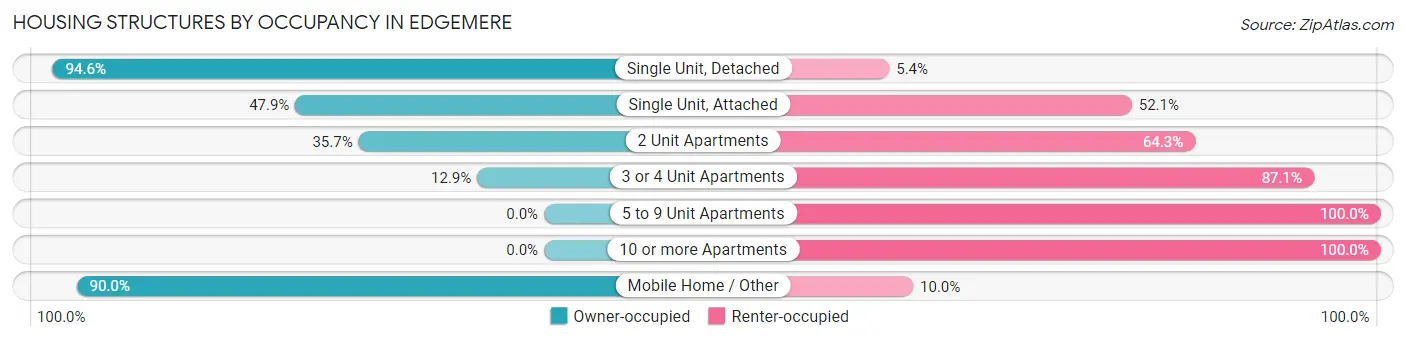
| Structure Type | Owner-occupied | Renter-occupied |
| Single Unit, Detached | 2,743 (94.6%) | 157 (5.4%) |
| Single Unit, Attached | 80 (47.9%) | 87 (52.1%) |
| 2 Unit Apartments | 30 (35.7%) | 54 (64.3%) |
| 3 or 4 Unit Apartments | 13 (12.9%) | 88 (87.1%) |
| 5 to 9 Unit Apartments | 0 (0.0%) | 44 (100.0%) |
| 10 or more Apartments | 0 (0.0%) | 78 (100.0%) |
| Mobile Home / Other | 36 (90.0%) | 4 (10.0%) |
| Total | 2,902 (85.0%) | 512 (15.0%) |
Housing Structures by Number of Rooms in Edgemere
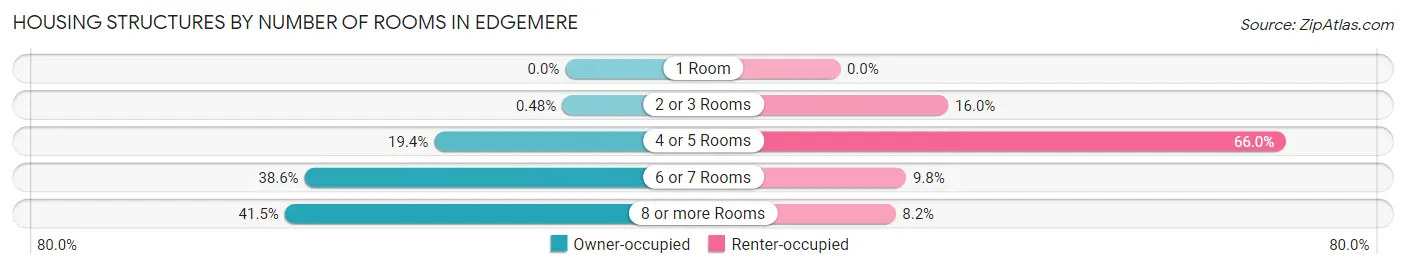
| Number of Rooms | Owner-occupied | Renter-occupied |
| 1 Room | 0 (0.0%) | 0 (0.0%) |
| 2 or 3 Rooms | 14 (0.5%) | 82 (16.0%) |
| 4 or 5 Rooms | 563 (19.4%) | 338 (66.0%) |
| 6 or 7 Rooms | 1,120 (38.6%) | 50 (9.8%) |
| 8 or more Rooms | 1,205 (41.5%) | 42 (8.2%) |
| Total | 2,902 (100.0%) | 512 (100.0%) |
Housing Structure by Heating Type in Edgemere
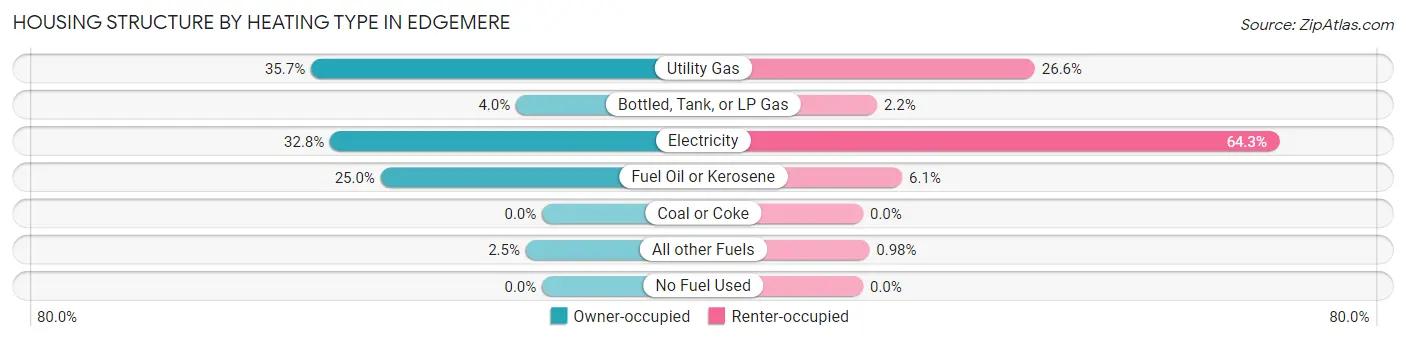
| Heating Type | Owner-occupied | Renter-occupied |
| Utility Gas | 1,037 (35.7%) | 136 (26.6%) |
| Bottled, Tank, or LP Gas | 117 (4.0%) | 11 (2.1%) |
| Electricity | 951 (32.8%) | 329 (64.3%) |
| Fuel Oil or Kerosene | 724 (24.9%) | 31 (6.0%) |
| Coal or Coke | 0 (0.0%) | 0 (0.0%) |
| All other Fuels | 73 (2.5%) | 5 (1.0%) |
| No Fuel Used | 0 (0.0%) | 0 (0.0%) |
| Total | 2,902 (100.0%) | 512 (100.0%) |
Household Vehicle Usage in Edgemere
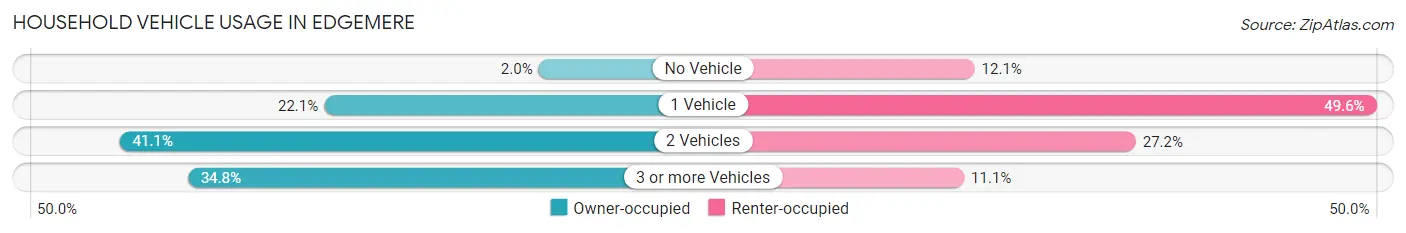
| Vehicles per Household | Owner-occupied | Renter-occupied |
| No Vehicle | 59 (2.0%) | 62 (12.1%) |
| 1 Vehicle | 640 (22.1%) | 254 (49.6%) |
| 2 Vehicles | 1,194 (41.1%) | 139 (27.2%) |
| 3 or more Vehicles | 1,009 (34.8%) | 57 (11.1%) |
| Total | 2,902 (100.0%) | 512 (100.0%) |
Real Estate & Mortgages in Edgemere
Real Estate and Mortgage Overview in Edgemere
| Characteristic | Without Mortgage | With Mortgage |
| Housing Units | 1,002 | 1,900 |
| Median Property Value | $298,000 | $347,000 |
| Median Household Income | $60,000 | $926 |
| Monthly Housing Costs | $613 | $304 |
| Real Estate Taxes | $3,117 | $65 |
Property Value by Mortgage Status in Edgemere
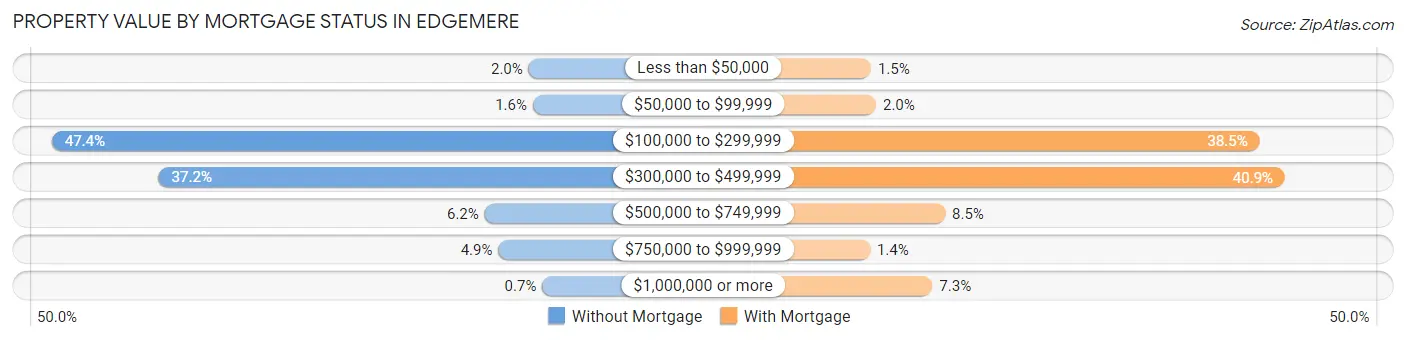
| Property Value | Without Mortgage | With Mortgage |
| Less than $50,000 | 20 (2.0%) | 28 (1.5%) |
| $50,000 to $99,999 | 16 (1.6%) | 37 (1.9%) |
| $100,000 to $299,999 | 475 (47.4%) | 731 (38.5%) |
| $300,000 to $499,999 | 373 (37.2%) | 777 (40.9%) |
| $500,000 to $749,999 | 62 (6.2%) | 162 (8.5%) |
| $750,000 to $999,999 | 49 (4.9%) | 26 (1.4%) |
| $1,000,000 or more | 7 (0.7%) | 139 (7.3%) |
| Total | 1,002 (100.0%) | 1,900 (100.0%) |
Household Income by Mortgage Status in Edgemere
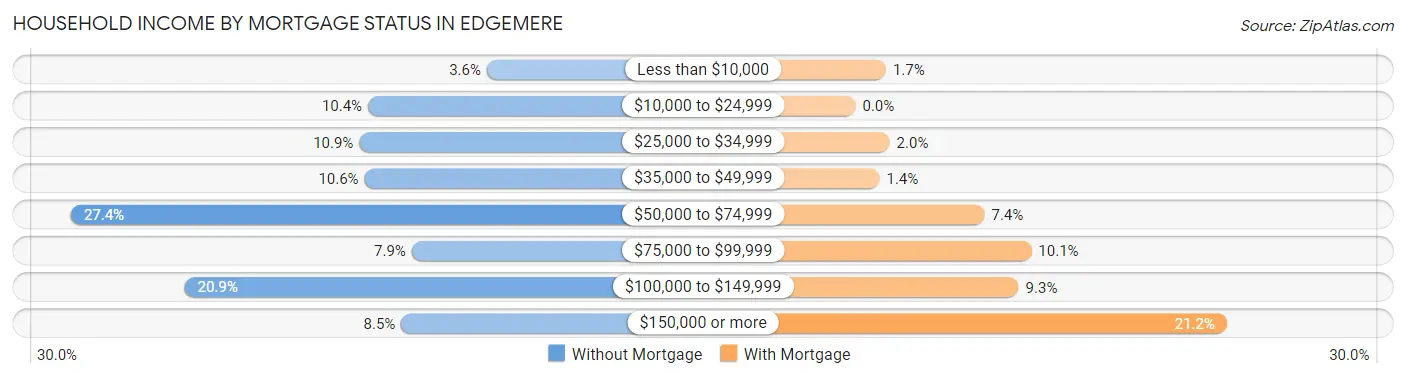
| Household Income | Without Mortgage | With Mortgage |
| Less than $10,000 | 36 (3.6%) | 33 (1.7%) |
| $10,000 to $24,999 | 104 (10.4%) | 0 (0.0%) |
| $25,000 to $34,999 | 109 (10.9%) | 37 (1.9%) |
| $35,000 to $49,999 | 106 (10.6%) | 26 (1.4%) |
| $50,000 to $74,999 | 274 (27.4%) | 140 (7.4%) |
| $75,000 to $99,999 | 79 (7.9%) | 191 (10.1%) |
| $100,000 to $149,999 | 209 (20.9%) | 177 (9.3%) |
| $150,000 or more | 85 (8.5%) | 403 (21.2%) |
| Total | 1,002 (100.0%) | 1,900 (100.0%) |
Property Value to Household Income Ratio in Edgemere
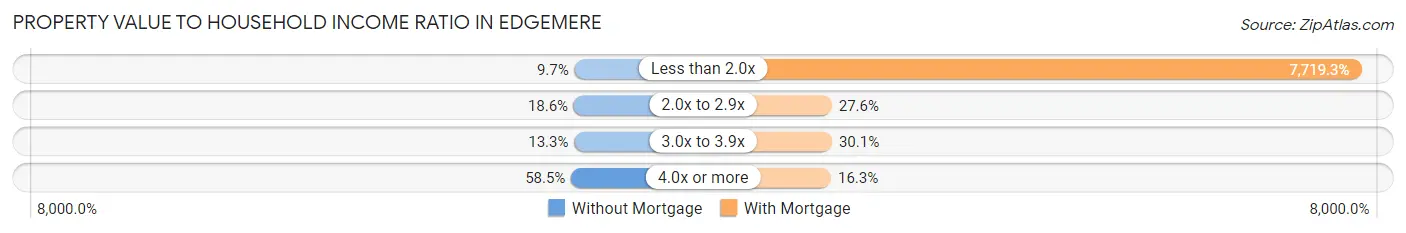
| Value-to-Income Ratio | Without Mortgage | With Mortgage |
| Less than 2.0x | 97 (9.7%) | 146,667 (7,719.3%) |
| 2.0x to 2.9x | 186 (18.6%) | 525 (27.6%) |
| 3.0x to 3.9x | 133 (13.3%) | 571 (30.0%) |
| 4.0x or more | 586 (58.5%) | 310 (16.3%) |
| Total | 1,002 (100.0%) | 1,900 (100.0%) |
Real Estate Taxes by Mortgage Status in Edgemere
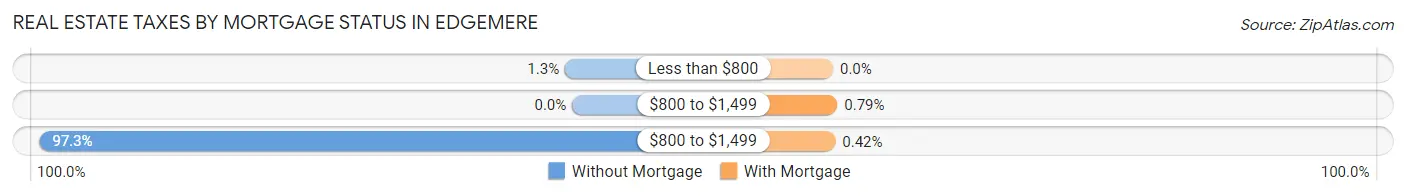
| Property Taxes | Without Mortgage | With Mortgage |
| Less than $800 | 13 (1.3%) | 0 (0.0%) |
| $800 to $1,499 | 0 (0.0%) | 15 (0.8%) |
| $800 to $1,499 | 975 (97.3%) | 8 (0.4%) |
| Total | 1,002 (100.0%) | 1,900 (100.0%) |
Health & Disability in Edgemere
Health Insurance Coverage by Age in Edgemere
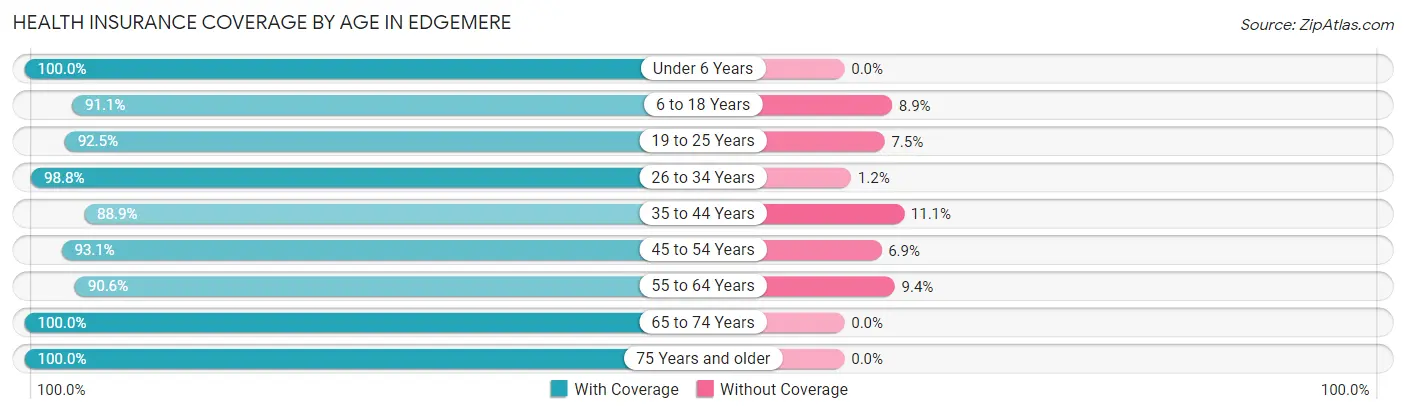
| Age Bracket | With Coverage | Without Coverage |
| Under 6 Years | 595 (100.0%) | 0 (0.0%) |
| 6 to 18 Years | 1,109 (91.1%) | 108 (8.9%) |
| 19 to 25 Years | 618 (92.5%) | 50 (7.5%) |
| 26 to 34 Years | 804 (98.8%) | 10 (1.2%) |
| 35 to 44 Years | 1,136 (88.9%) | 142 (11.1%) |
| 45 to 54 Years | 812 (93.1%) | 60 (6.9%) |
| 55 to 64 Years | 1,343 (90.6%) | 139 (9.4%) |
| 65 to 74 Years | 1,179 (100.0%) | 0 (0.0%) |
| 75 Years and older | 774 (100.0%) | 0 (0.0%) |
| Total | 8,370 (94.3%) | 509 (5.7%) |
Health Insurance Coverage by Citizenship Status in Edgemere
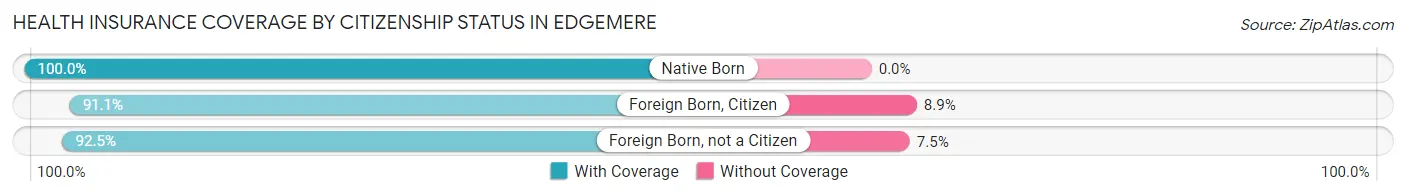
| Citizenship Status | With Coverage | Without Coverage |
| Native Born | 595 (100.0%) | 0 (0.0%) |
| Foreign Born, Citizen | 1,109 (91.1%) | 108 (8.9%) |
| Foreign Born, not a Citizen | 618 (92.5%) | 50 (7.5%) |
Health Insurance Coverage by Household Income in Edgemere
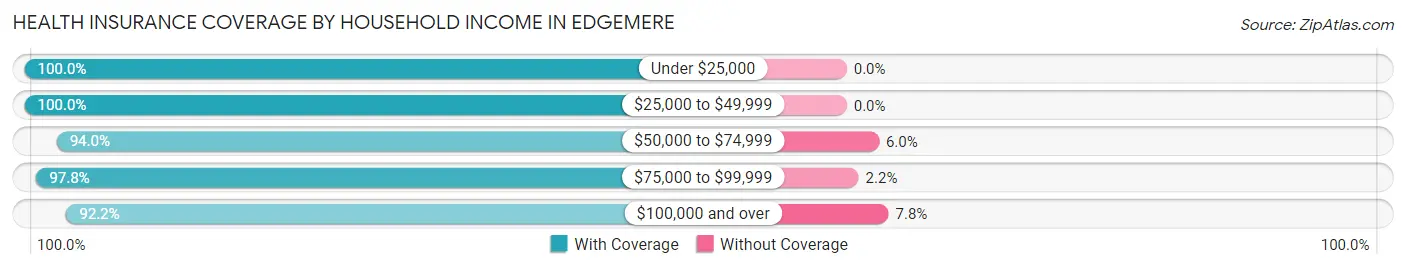
| Household Income | With Coverage | Without Coverage |
| Under $25,000 | 545 (100.0%) | 0 (0.0%) |
| $25,000 to $49,999 | 1,025 (100.0%) | 0 (0.0%) |
| $50,000 to $74,999 | 1,044 (94.0%) | 67 (6.0%) |
| $75,000 to $99,999 | 750 (97.8%) | 17 (2.2%) |
| $100,000 and over | 5,001 (92.2%) | 425 (7.8%) |
Public vs Private Health Insurance Coverage by Age in Edgemere
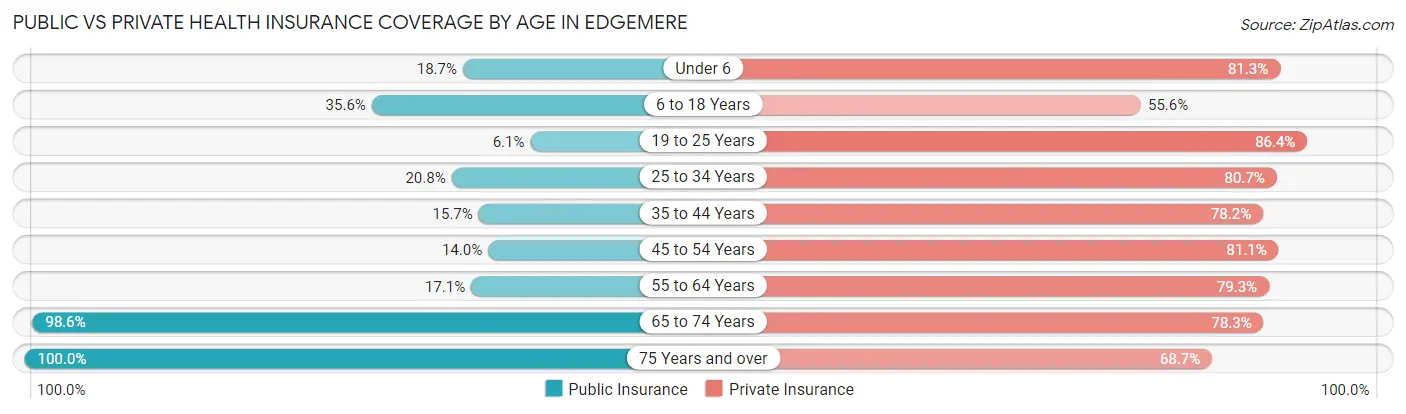
| Age Bracket | Public Insurance | Private Insurance |
| Under 6 | 111 (18.7%) | 484 (81.3%) |
| 6 to 18 Years | 433 (35.6%) | 676 (55.5%) |
| 19 to 25 Years | 41 (6.1%) | 577 (86.4%) |
| 25 to 34 Years | 169 (20.8%) | 657 (80.7%) |
| 35 to 44 Years | 201 (15.7%) | 999 (78.2%) |
| 45 to 54 Years | 122 (14.0%) | 707 (81.1%) |
| 55 to 64 Years | 254 (17.1%) | 1,175 (79.3%) |
| 65 to 74 Years | 1,162 (98.6%) | 923 (78.3%) |
| 75 Years and over | 774 (100.0%) | 532 (68.7%) |
| Total | 3,267 (36.8%) | 6,730 (75.8%) |
Disability Status by Sex by Age in Edgemere
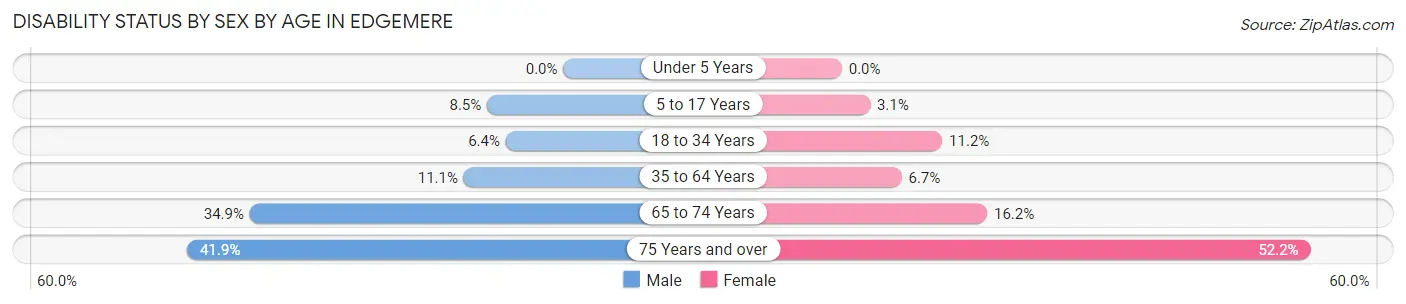
| Age Bracket | Male | Female |
| Under 5 Years | 0 (0.0%) | 0 (0.0%) |
| 5 to 17 Years | 51 (8.5%) | 20 (3.1%) |
| 18 to 34 Years | 43 (6.4%) | 92 (11.2%) |
| 35 to 64 Years | 216 (11.1%) | 112 (6.7%) |
| 65 to 74 Years | 183 (34.9%) | 106 (16.2%) |
| 75 Years and over | 114 (41.9%) | 262 (52.2%) |
Disability Class by Sex by Age in Edgemere
Disability Class: Hearing Difficulty
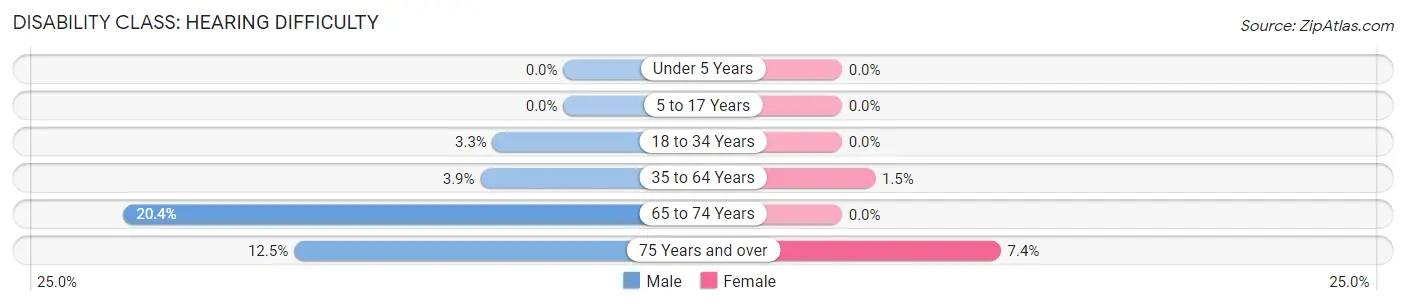
| Age Bracket | Male | Female |
| Under 5 Years | 0 (0.0%) | 0 (0.0%) |
| 5 to 17 Years | 0 (0.0%) | 0 (0.0%) |
| 18 to 34 Years | 22 (3.3%) | 0 (0.0%) |
| 35 to 64 Years | 75 (3.8%) | 26 (1.5%) |
| 65 to 74 Years | 107 (20.4%) | 0 (0.0%) |
| 75 Years and over | 34 (12.5%) | 37 (7.4%) |
Disability Class: Vision Difficulty
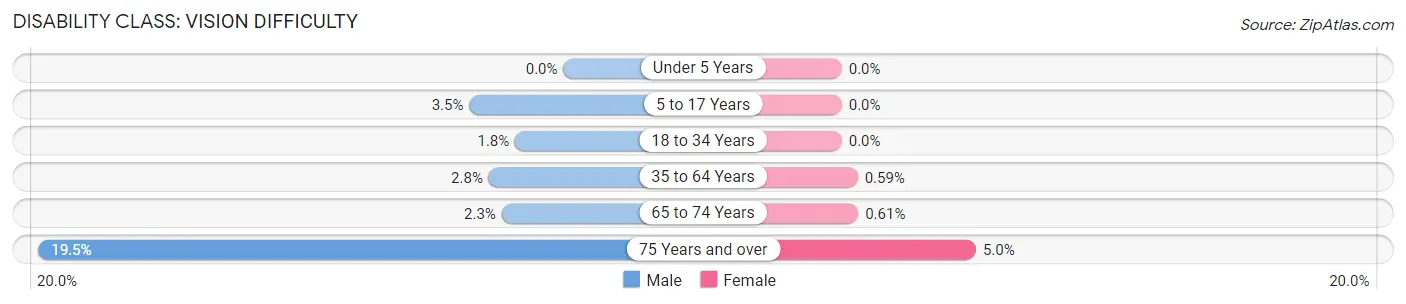
| Age Bracket | Male | Female |
| Under 5 Years | 0 (0.0%) | 0 (0.0%) |
| 5 to 17 Years | 21 (3.5%) | 0 (0.0%) |
| 18 to 34 Years | 12 (1.8%) | 0 (0.0%) |
| 35 to 64 Years | 54 (2.8%) | 10 (0.6%) |
| 65 to 74 Years | 12 (2.3%) | 4 (0.6%) |
| 75 Years and over | 53 (19.5%) | 25 (5.0%) |
Disability Class: Cognitive Difficulty
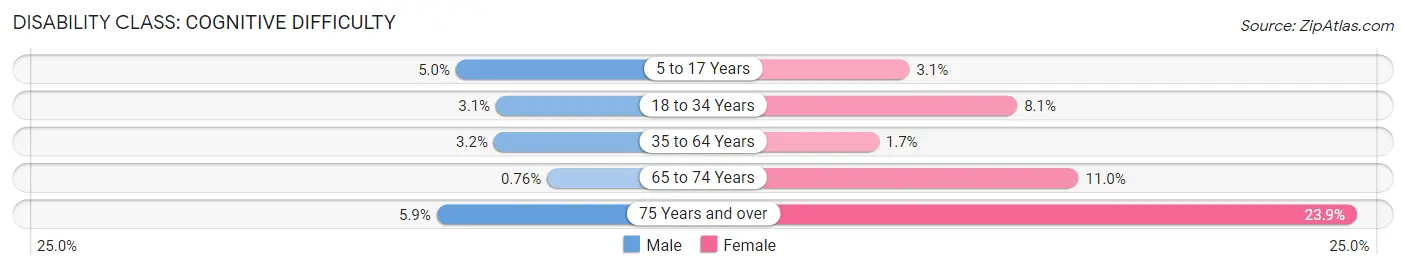
| Age Bracket | Male | Female |
| 5 to 17 Years | 30 (5.0%) | 20 (3.1%) |
| 18 to 34 Years | 21 (3.1%) | 67 (8.1%) |
| 35 to 64 Years | 63 (3.2%) | 29 (1.7%) |
| 65 to 74 Years | 4 (0.8%) | 72 (11.0%) |
| 75 Years and over | 16 (5.9%) | 120 (23.9%) |
Disability Class: Ambulatory Difficulty
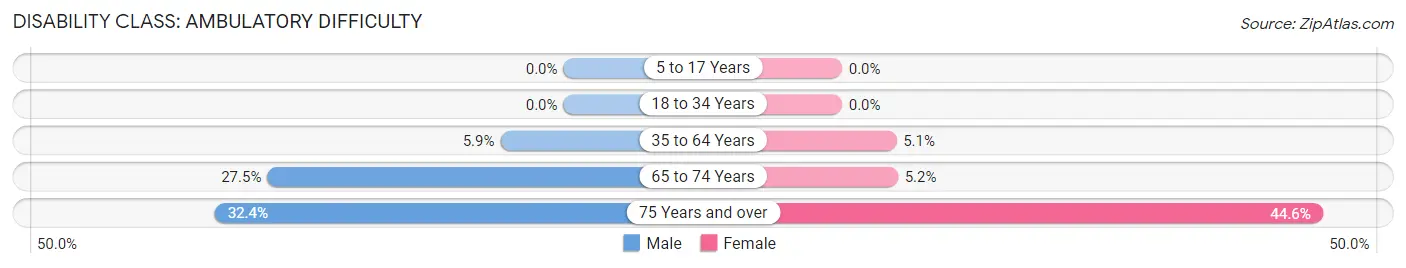
| Age Bracket | Male | Female |
| 5 to 17 Years | 0 (0.0%) | 0 (0.0%) |
| 18 to 34 Years | 0 (0.0%) | 0 (0.0%) |
| 35 to 64 Years | 114 (5.9%) | 85 (5.1%) |
| 65 to 74 Years | 144 (27.5%) | 34 (5.2%) |
| 75 Years and over | 88 (32.4%) | 224 (44.6%) |
Disability Class: Self-Care Difficulty
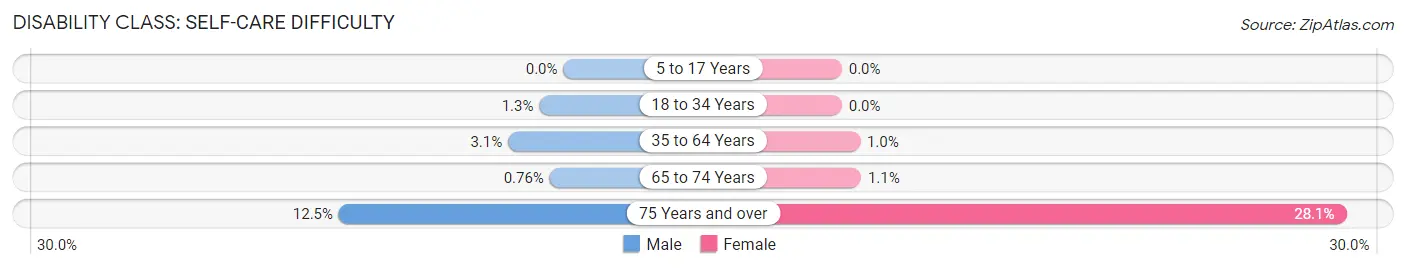
| Age Bracket | Male | Female |
| 5 to 17 Years | 0 (0.0%) | 0 (0.0%) |
| 18 to 34 Years | 9 (1.3%) | 0 (0.0%) |
| 35 to 64 Years | 60 (3.1%) | 17 (1.0%) |
| 65 to 74 Years | 4 (0.8%) | 7 (1.1%) |
| 75 Years and over | 34 (12.5%) | 141 (28.1%) |
Technology Access in Edgemere
Computing Device Access in Edgemere
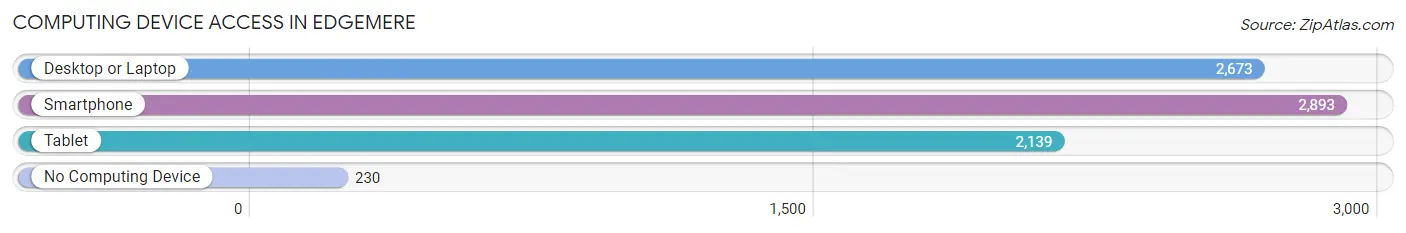
| Device Type | # Households | % Households |
| Desktop or Laptop | 2,673 | 78.3% |
| Smartphone | 2,893 | 84.7% |
| Tablet | 2,139 | 62.6% |
| No Computing Device | 230 | 6.7% |
| Total | 3,414 | 100.0% |
Internet Access in Edgemere
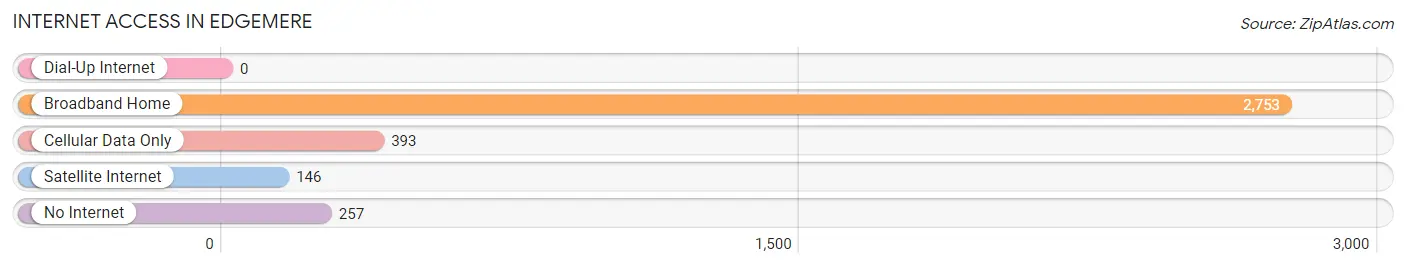
| Internet Type | # Households | % Households |
| Dial-Up Internet | 0 | 0.0% |
| Broadband Home | 2,753 | 80.6% |
| Cellular Data Only | 393 | 11.5% |
| Satellite Internet | 146 | 4.3% |
| No Internet | 257 | 7.5% |
| Total | 3,414 | 100.0% |
Edgemere Summary
Edgemere is a small, unincorporated community located in Baltimore County, Maryland. It is situated on the Chesapeake Bay, just south of the city of Baltimore. The community is bordered by Sparrows Point to the north, North Point to the east, and Middle River to the south.
History
Edgemere was first settled in the early 1700s by English settlers. The area was originally known as “Edge of the Sea” due to its proximity to the Chesapeake Bay. In the late 1800s, the area was developed as a resort community, with many of the original homes still standing today.
In the early 1900s, the area was home to a large amusement park, known as Edgemere Park. The park was a popular destination for Baltimoreans, and featured a roller coaster, a carousel, and a dance hall. The park closed in the 1950s, and the area has since been redeveloped as a residential community.
Geography
Edgemere is located in the northern part of Baltimore County, Maryland. It is situated on the Chesapeake Bay, just south of the city of Baltimore. The community is bordered by Sparrows Point to the north, North Point to the east, and Middle River to the south.
The area is mostly flat, with some low hills in the northern part of the community. The climate is humid subtropical, with hot, humid summers and mild winters.
Economy
Edgemere is primarily a residential community, with most of its residents employed in the nearby city of Baltimore. The area is home to a few small businesses, including a convenience store, a gas station, and a few restaurants.
Demographics
As of the 2010 census, the population of Edgemere was 4,845. The racial makeup of the community was 79.3% White, 15.2% African American, 0.3% Native American, 1.2% Asian, and 3.9% from other races. The median household income was $50,945, and the median family income was $60,945.
Conclusion
Edgemere is a small, unincorporated community located in Baltimore County, Maryland. It is situated on the Chesapeake Bay, just south of the city of Baltimore. The community is primarily residential, with most of its residents employed in the nearby city of Baltimore. The area is home to a few small businesses, including a convenience store, a gas station, and a few restaurants. As of the 2010 census, the population of Edgemere was 4,845. The racial makeup of the community was 79.3% White, 15.2% African American, 0.3% Native American, 1.2% Asian, and 3.9% from other races. The median household income was $50,945, and the median family income was $60,945.
Common Questions
What is the Total Population of Edgemere?
Total Population of Edgemere is 8,879.
What is the Total Male Population of Edgemere?
Total Male Population of Edgemere is 4,251.
What is the Total Female Population of Edgemere?
Total Female Population of Edgemere is 4,628.
What is the Ratio of Males per 100 Females in Edgemere?
There are 91.85 Males per 100 Females in Edgemere.
What is the Ratio of Females per 100 Males in Edgemere?
There are 108.87 Females per 100 Males in Edgemere.
What is the Median Population Age in Edgemere?
Median Population Age in Edgemere is 44.1 Years.
What is the Average Family Size in Edgemere
Average Family Size in Edgemere is 3.0 People.
What is the Average Household Size in Edgemere
Average Household Size in Edgemere is 2.6 People.
What is Per Capita Income in Edgemere?
Per Capita income in Edgemere is $57,019.
What is the Median Family Income in Edgemere?
Median Family Income in Edgemere is $121,494.
What is the Median Household income in Edgemere?
Median Household Income in Edgemere is $103,790.
What is Income or Wage Gap in Edgemere?
Income or Wage Gap in Edgemere is 8.4%.
Women in Edgemere earn 91.6 cents for every dollar earned by a man.
What is Inequality or Gini Index in Edgemere?
Inequality or Gini Index in Edgemere is 0.50.
How Large is the Labor Force in Edgemere?
There are 4,316 People in the Labor Forcein in Edgemere.
What is the Percentage of People in the Labor Force in Edgemere?
59.5% of People are in the Labor Force in Edgemere.
What is the Unemployment Rate in Edgemere?
Unemployment Rate in Edgemere is 3.1%.