Cities with the Highest Percentage of Immigrants from Philippines in Georgia
RELATED REPORTS & OPTIONS
Philippines
Georgia
Compare Cities
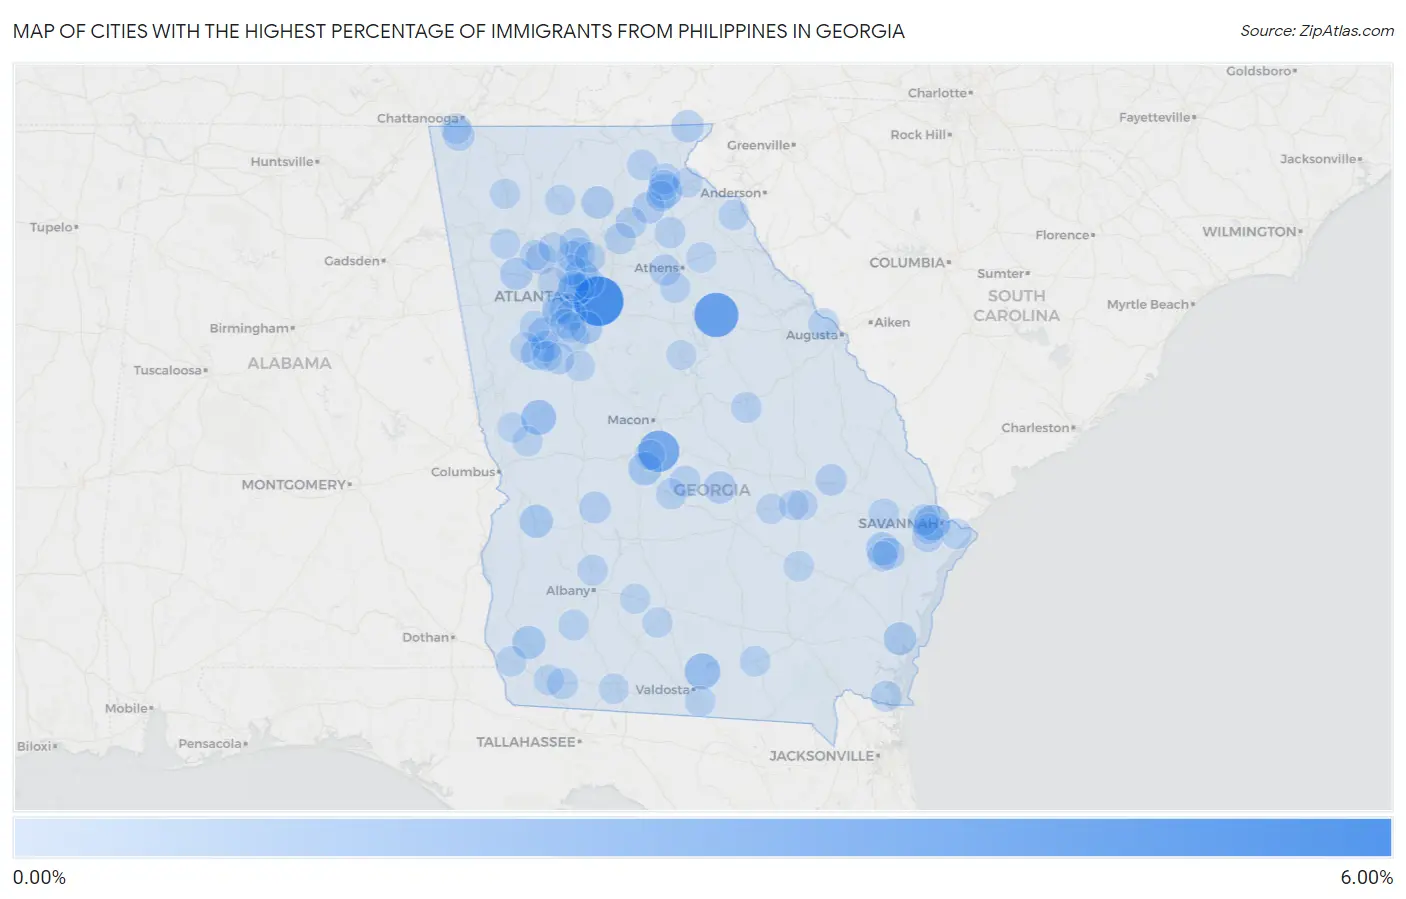
Map of Cities with the Highest Percentage of Immigrants from Philippines in Georgia
0.00%
6.00%
Cities with the Highest Percentage of Immigrants from Philippines in Georgia
| City | Philippines | vs State | vs National | |
| 1. | Lithonia | 5.93% | 0.19%(+5.74)#-1 | 0.60%(+5.33)#0 |
| 2. | Union Point | 4.33% | 0.19%(+4.14)#0 | 0.60%(+3.74)#1 |
| 3. | Robins Afb | 3.42% | 0.19%(+3.23)#1 | 0.60%(+2.82)#2 |
| 4. | Moody Afb | 1.79% | 0.19%(+1.60)#2 | 0.60%(+1.19)#3 |
| 5. | Garden City | 1.65% | 0.19%(+1.46)#3 | 0.60%(+1.05)#4 |
| 6. | Manchester | 1.61% | 0.19%(+1.41)#4 | 0.60%(+1.01)#5 |
| 7. | Cornelia | 1.38% | 0.19%(+1.18)#5 | 0.60%(+0.777)#6 |
| 8. | Cusseta Chattahoochee County Unified Government | 1.22% | 0.19%(+1.03)#6 | 0.60%(+0.623)#7 |
| 9. | Druid Hills | 1.16% | 0.19%(+0.964)#7 | 0.60%(+0.558)#8 |
| 10. | Perry | 1.14% | 0.19%(+0.944)#8 | 0.60%(+0.538)#9 |
| 11. | Richland | 1.09% | 0.19%(+0.892)#9 | 0.60%(+0.486)#10 |
| 12. | Colquitt | 1.08% | 0.19%(+0.886)#10 | 0.60%(+0.480)#11 |
| 13. | Fort Stewart | 1.07% | 0.19%(+0.879)#11 | 0.60%(+0.473)#12 |
| 14. | Sharpsburg | 1.05% | 0.19%(+0.860)#12 | 0.60%(+0.453)#13 |
| 15. | Doraville | 1.04% | 0.19%(+0.845)#13 | 0.60%(+0.439)#14 |
| 16. | Stockbridge | 0.97% | 0.19%(+0.774)#14 | 0.60%(+0.367)#518 |
| 17. | Country Club Estates | 0.96% | 0.19%(+0.768)#15 | 0.60%(+0.361)#519 |
| 18. | Dawsonville | 0.90% | 0.19%(+0.711)#16 | 0.60%(+0.304)#520 |
| 19. | Dallas | 0.86% | 0.19%(+0.664)#17 | 0.60%(+0.257)#521 |
| 20. | Sky Valley | 0.83% | 0.19%(+0.642)#18 | 0.60%(+0.235)#522 |
| 21. | Tyrone | 0.82% | 0.19%(+0.624)#19 | 0.60%(+0.217)#523 |
| 22. | Lula | 0.80% | 0.19%(+0.606)#20 | 0.60%(+0.199)#524 |
| 23. | Cadwell | 0.79% | 0.19%(+0.597)#21 | 0.60%(+0.190)#525 |
| 24. | Flemington | 0.75% | 0.19%(+0.556)#22 | 0.60%(+0.149)#526 |
| 25. | Andersonville | 0.68% | 0.19%(+0.483)#23 | 0.60%(+0.076)#527 |
| 26. | Chattanooga Valley | 0.65% | 0.19%(+0.455)#24 | 0.60%(+0.048)#528 |
| 27. | Georgetown | 0.63% | 0.19%(+0.439)#25 | 0.60%(+0.033)#529 |
| 28. | North Decatur | 0.61% | 0.19%(+0.418)#26 | 0.60%(+0.011)#530 |
| 29. | Kennesaw | 0.59% | 0.19%(+0.397)#27 | 0.60%(-0.009)#531 |
| 30. | Milton | 0.58% | 0.19%(+0.389)#28 | 0.60%(-0.017)#532 |
| 31. | Metter | 0.58% | 0.19%(+0.385)#29 | 0.60%(-0.021)#533 |
| 32. | Brooks | 0.56% | 0.19%(+0.363)#30 | 0.60%(-0.043)#534 |
| 33. | Peachtree City | 0.55% | 0.19%(+0.356)#31 | 0.60%(-0.050)#827 |
| 34. | Bogart | 0.55% | 0.19%(+0.356)#32 | 0.60%(-0.051)#828 |
| 35. | Hapeville | 0.55% | 0.19%(+0.355)#33 | 0.60%(-0.051)#829 |
| 36. | Commerce | 0.54% | 0.19%(+0.348)#34 | 0.60%(-0.059)#830 |
| 37. | Climax | 0.54% | 0.19%(+0.345)#35 | 0.60%(-0.062)#831 |
| 38. | Cochran | 0.53% | 0.19%(+0.341)#36 | 0.60%(-0.066)#832 |
| 39. | Gainesville | 0.53% | 0.19%(+0.338)#37 | 0.60%(-0.069)#833 |
| 40. | Palmetto | 0.52% | 0.19%(+0.323)#38 | 0.60%(-0.084)#834 |
| 41. | Pooler | 0.51% | 0.19%(+0.317)#39 | 0.60%(-0.090)#835 |
| 42. | Hawkinsville | 0.50% | 0.19%(+0.306)#40 | 0.60%(-0.101)#836 |
| 43. | St Marys | 0.50% | 0.19%(+0.304)#41 | 0.60%(-0.103)#837 |
| 44. | Evans | 0.49% | 0.19%(+0.301)#42 | 0.60%(-0.106)#838 |
| 45. | Flowery Branch | 0.48% | 0.19%(+0.291)#43 | 0.60%(-0.115)#839 |
| 46. | Clarkesville | 0.48% | 0.19%(+0.284)#44 | 0.60%(-0.122)#840 |
| 47. | Tennille | 0.46% | 0.19%(+0.267)#45 | 0.60%(-0.140)#841 |
| 48. | Roswell | 0.45% | 0.19%(+0.260)#46 | 0.60%(-0.147)#842 |
| 49. | Bishop | 0.44% | 0.19%(+0.246)#47 | 0.60%(-0.161)#843 |
| 50. | Tucker | 0.44% | 0.19%(+0.245)#48 | 0.60%(-0.162)#929 |
| 51. | Alpharetta | 0.43% | 0.19%(+0.240)#49 | 0.60%(-0.167)#930 |
| 52. | Bemiss | 0.42% | 0.19%(+0.227)#50 | 0.60%(-0.180)#931 |
| 53. | Wilmington Island | 0.41% | 0.19%(+0.214)#51 | 0.60%(-0.193)#932 |
| 54. | Leesburg | 0.40% | 0.19%(+0.211)#52 | 0.60%(-0.196)#933 |
| 55. | Savannah | 0.40% | 0.19%(+0.210)#53 | 0.60%(-0.197)#984 |
| 56. | East Point | 0.40% | 0.19%(+0.208)#54 | 0.60%(-0.198)#985 |
| 57. | Sandy Springs | 0.40% | 0.19%(+0.208)#55 | 0.60%(-0.199)#1,153 |
| 58. | Newton | 0.40% | 0.19%(+0.204)#56 | 0.60%(-0.203)#1,154 |
| 59. | Helen | 0.40% | 0.19%(+0.203)#57 | 0.60%(-0.204)#1,155 |
| 60. | Homerville | 0.39% | 0.19%(+0.197)#58 | 0.60%(-0.209)#1,156 |
| 61. | Lookout Mountain | 0.39% | 0.19%(+0.197)#59 | 0.60%(-0.209)#1,157 |
| 62. | Dasher | 0.38% | 0.19%(+0.183)#60 | 0.60%(-0.223)#1,158 |
| 63. | Baldwin | 0.37% | 0.19%(+0.174)#61 | 0.60%(-0.233)#1,159 |
| 64. | Jasper | 0.36% | 0.19%(+0.166)#62 | 0.60%(-0.241)#1,160 |
| 65. | Hartwell | 0.36% | 0.19%(+0.164)#63 | 0.60%(-0.243)#1,161 |
| 66. | Johns Creek | 0.36% | 0.19%(+0.162)#64 | 0.60%(-0.245)#1,174 |
| 67. | Pembroke | 0.35% | 0.19%(+0.161)#65 | 0.60%(-0.246)#1,175 |
| 68. | Bainbridge | 0.34% | 0.19%(+0.151)#66 | 0.60%(-0.255)#1,176 |
| 69. | Baxley | 0.34% | 0.19%(+0.149)#67 | 0.60%(-0.258)#1,177 |
| 70. | College Park | 0.34% | 0.19%(+0.147)#68 | 0.60%(-0.260)#1,178 |
| 71. | Newnan | 0.34% | 0.19%(+0.144)#69 | 0.60%(-0.262)#1,179 |
| 72. | Colbert | 0.33% | 0.19%(+0.140)#70 | 0.60%(-0.267)#1,180 |
| 73. | Donalsonville | 0.32% | 0.19%(+0.126)#71 | 0.60%(-0.281)#1,181 |
| 74. | Acworth | 0.31% | 0.19%(+0.116)#72 | 0.60%(-0.291)#1,182 |
| 75. | Hamilton | 0.31% | 0.19%(+0.115)#73 | 0.60%(-0.291)#1,183 |
| 76. | Lyons | 0.31% | 0.19%(+0.115)#74 | 0.60%(-0.292)#1,184 |
| 77. | Omega | 0.31% | 0.19%(+0.114)#75 | 0.60%(-0.293)#1,185 |
| 78. | Euharlee | 0.31% | 0.19%(+0.112)#76 | 0.60%(-0.294)#1,186 |
| 79. | Thomasville | 0.30% | 0.19%(+0.111)#77 | 0.60%(-0.296)#1,187 |
| 80. | Forest Park | 0.30% | 0.19%(+0.108)#78 | 0.60%(-0.299)#1,188 |
| 81. | Athens-Clarke County Unified Government (Balance) | 0.29% | 0.19%(+0.101)#79 | 0.60%(-0.306)#1,189 |
| 82. | Lovejoy | 0.29% | 0.19%(+0.095)#80 | 0.60%(-0.312)#1,190 |
| 83. | Waverly Hall | 0.29% | 0.19%(+0.093)#81 | 0.60%(-0.314)#1,191 |
| 84. | Calhoun | 0.29% | 0.19%(+0.092)#82 | 0.60%(-0.315)#1,192 |
| 85. | Griffin | 0.27% | 0.19%(+0.079)#83 | 0.60%(-0.327)#1,193 |
| 86. | Mount Vernon | 0.27% | 0.19%(+0.073)#84 | 0.60%(-0.333)#1,194 |
| 87. | Hinesville | 0.26% | 0.19%(+0.072)#85 | 0.60%(-0.335)#1,195 |
| 88. | Demorest | 0.26% | 0.19%(+0.069)#86 | 0.60%(-0.338)#1,196 |
| 89. | Poulan | 0.26% | 0.19%(+0.067)#87 | 0.60%(-0.339)#1,197 |
| 90. | Augusta-Richmond County Consolidated Government (Balance) | 0.26% | 0.19%(+0.063)#88 | 0.60%(-0.344)#1,282 |
| 91. | Senoia | 0.25% | 0.19%(+0.061)#89 | 0.60%(-0.346)#1,283 |
| 92. | Riverdale | 0.25% | 0.19%(+0.055)#90 | 0.60%(-0.352)#1,284 |
| 93. | North Druid Hills | 0.24% | 0.19%(+0.051)#91 | 0.60%(-0.356)#1,285 |
| 94. | Smyrna | 0.24% | 0.19%(+0.050)#92 | 0.60%(-0.356)#1,286 |
| 95. | Warner Robins | 0.24% | 0.19%(+0.046)#93 | 0.60%(-0.361)#1,287 |
| 96. | Vidalia | 0.23% | 0.19%(+0.040)#94 | 0.60%(-0.367)#1,288 |
| 97. | Toccoa | 0.23% | 0.19%(+0.039)#95 | 0.60%(-0.368)#1,289 |
| 98. | Woodstock | 0.23% | 0.19%(+0.037)#96 | 0.60%(-0.369)#1,290 |
| 99. | Jonesboro | 0.23% | 0.19%(+0.033)#97 | 0.60%(-0.373)#1,291 |
| 100. | Eatonton | 0.22% | 0.19%(+0.027)#98 | 0.60%(-0.380)#1,292 |
Common Questions
What are the Top 10 Cities with the Highest Percentage of Immigrants from Philippines in Georgia?
Top 10 Cities with the Highest Percentage of Immigrants from Philippines in Georgia are:
#1
5.93%
#2
4.33%
#3
3.42%
#4
1.79%
#5
1.65%
#6
1.61%
#7
1.38%
#8
1.16%
#9
1.14%
#10
1.09%
What city has the Highest Percentage of Immigrants from Philippines in Georgia?
Lithonia has the Highest Percentage of Immigrants from Philippines in Georgia with 5.93%.
What is the Percentage of Immigrants from Philippines in the State of Georgia?
Percentage of Immigrants from Philippines in Georgia is 0.19%.
What is the Percentage of Immigrants from Philippines in the United States?
Percentage of Immigrants from Philippines in the United States is 0.60%.