Cities with the Highest Percentage of Immigrants from Philippines in Missouri
RELATED REPORTS & OPTIONS
Philippines
Missouri
Compare Cities
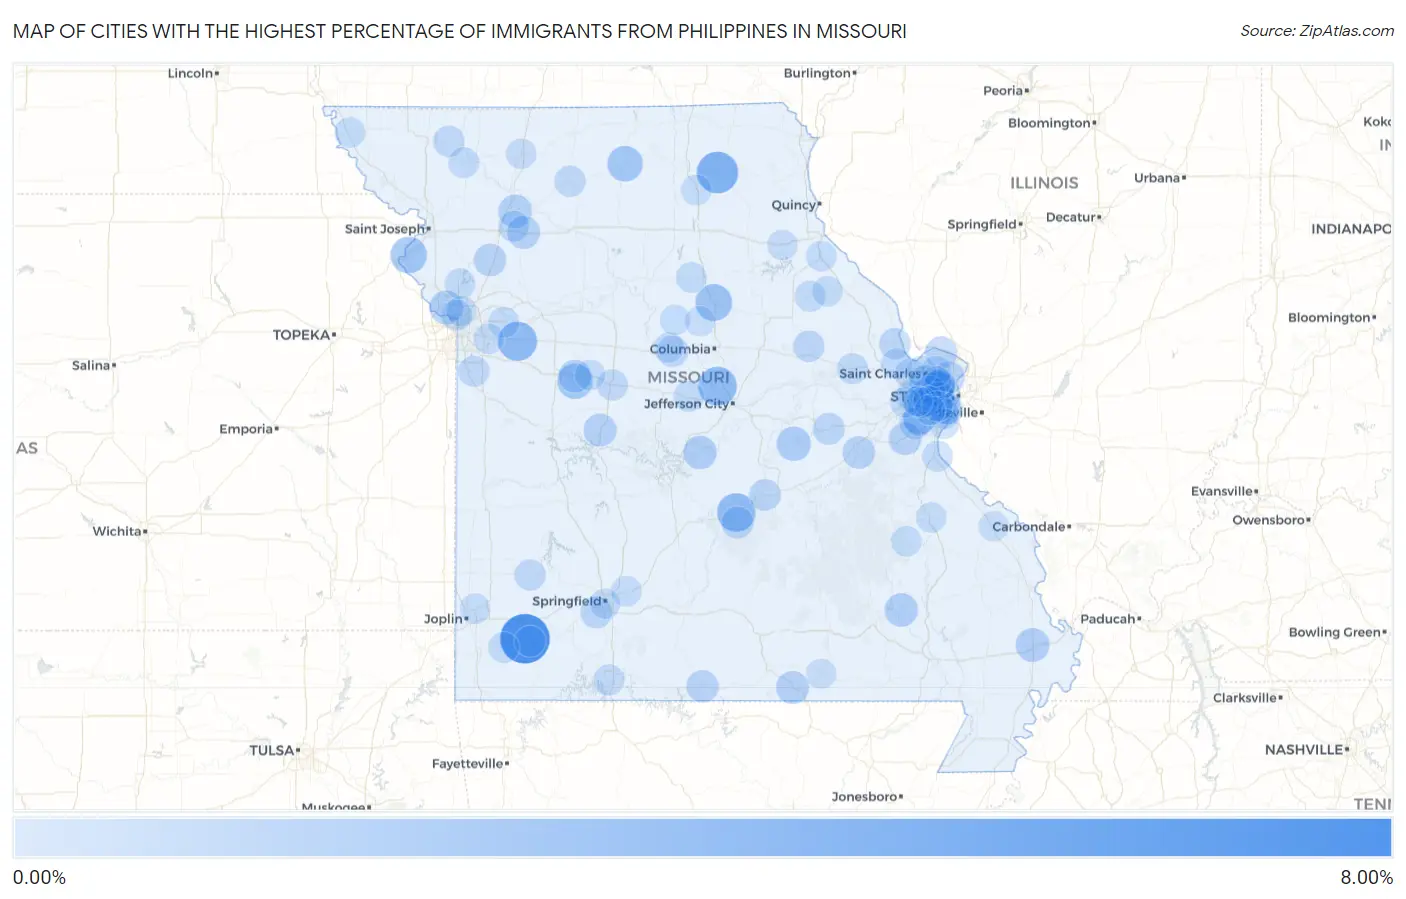
Map of Cities with the Highest Percentage of Immigrants from Philippines in Missouri
0.00%
8.00%
Cities with the Highest Percentage of Immigrants from Philippines in Missouri
| City | Philippines | vs State | vs National | |
| 1. | Pierce City | 6.85% | 0.18%(+6.67)#-1 | 0.60%(+6.25)#0 |
| 2. | Hurdland | 4.02% | 0.18%(+3.84)#0 | 0.60%(+3.42)#1 |
| 3. | Bates City | 3.25% | 0.18%(+3.07)#1 | 0.60%(+2.65)#2 |
| 4. | Hartsburg | 3.08% | 0.18%(+2.90)#2 | 0.60%(+2.48)#3 |
| 5. | St Robert | 2.98% | 0.18%(+2.80)#3 | 0.60%(+2.38)#4 |
| 6. | Clark | 2.45% | 0.18%(+2.27)#4 | 0.60%(+1.85)#5 |
| 7. | Philadelphia | 2.32% | 0.18%(+2.14)#5 | 0.60%(+1.72)#6 |
| 8. | Rushville | 2.30% | 0.18%(+2.12)#6 | 0.60%(+1.70)#7 |
| 9. | Milan | 2.01% | 0.18%(+1.83)#7 | 0.60%(+1.41)#8 |
| 10. | Whiteman Afb | 1.97% | 0.18%(+1.79)#8 | 0.60%(+1.37)#9 |
| 11. | Bland | 1.57% | 0.18%(+1.39)#9 | 0.60%(+0.971)#10 |
| 12. | Maryland Heights | 1.49% | 0.18%(+1.31)#10 | 0.60%(+0.891)#11 |
| 13. | Olivette | 1.45% | 0.18%(+1.27)#11 | 0.60%(+0.847)#283 |
| 14. | Weatherby Lake | 1.45% | 0.18%(+1.27)#12 | 0.60%(+0.845)#284 |
| 15. | Miner | 1.42% | 0.18%(+1.25)#13 | 0.60%(+0.822)#285 |
| 16. | Tuscumbia | 1.35% | 0.18%(+1.17)#14 | 0.60%(+0.752)#286 |
| 17. | Piedmont | 1.31% | 0.18%(+1.14)#15 | 0.60%(+0.715)#287 |
| 18. | Altamont | 1.28% | 0.18%(+1.11)#16 | 0.60%(+0.682)#288 |
| 19. | Parkdale | 1.21% | 0.18%(+1.03)#17 | 0.60%(+0.610)#289 |
| 20. | Hamilton | 1.17% | 0.18%(+0.994)#18 | 0.60%(+0.571)#290 |
| 21. | Koshkonong | 1.15% | 0.18%(+0.973)#19 | 0.60%(+0.550)#291 |
| 22. | Lincoln | 1.14% | 0.18%(+0.962)#20 | 0.60%(+0.539)#292 |
| 23. | Knob Noster | 1.11% | 0.18%(+0.933)#21 | 0.60%(+0.510)#293 |
| 24. | Cedar Hill Lakes | 1.06% | 0.18%(+0.887)#22 | 0.60%(+0.464)#294 |
| 25. | Winchester | 1.06% | 0.18%(+0.886)#23 | 0.60%(+0.462)#295 |
| 26. | Miramiguoa Park | 1.06% | 0.18%(+0.882)#24 | 0.60%(+0.458)#296 |
| 27. | Lathrop | 1.02% | 0.18%(+0.845)#25 | 0.60%(+0.421)#297 |
| 28. | Gainesville | 0.96% | 0.18%(+0.781)#26 | 0.60%(+0.358)#298 |
| 29. | Portage Des Sioux | 0.91% | 0.18%(+0.732)#27 | 0.60%(+0.309)#299 |
| 30. | Dellwood | 0.90% | 0.18%(+0.721)#28 | 0.60%(+0.298)#300 |
| 31. | Fort Leonard Wood | 0.86% | 0.18%(+0.688)#29 | 0.60%(+0.265)#301 |
| 32. | Gerald | 0.84% | 0.18%(+0.659)#30 | 0.60%(+0.236)#302 |
| 33. | Battlefield | 0.78% | 0.18%(+0.601)#31 | 0.60%(+0.178)#303 |
| 34. | Clarkson Valley | 0.77% | 0.18%(+0.590)#32 | 0.60%(+0.167)#304 |
| 35. | Rock Hill | 0.76% | 0.18%(+0.585)#33 | 0.60%(+0.162)#305 |
| 36. | Doolittle | 0.75% | 0.18%(+0.571)#34 | 0.60%(+0.148)#306 |
| 37. | St George | 0.75% | 0.18%(+0.570)#35 | 0.60%(+0.147)#307 |
| 38. | Overland | 0.72% | 0.18%(+0.543)#36 | 0.60%(+0.120)#308 |
| 39. | Winfield | 0.70% | 0.18%(+0.520)#37 | 0.60%(+0.097)#309 |
| 40. | Montgomery City | 0.67% | 0.18%(+0.498)#38 | 0.60%(+0.075)#310 |
| 41. | Windsor Place | 0.67% | 0.18%(+0.493)#39 | 0.60%(+0.070)#311 |
| 42. | High Ridge | 0.67% | 0.18%(+0.490)#40 | 0.60%(+0.067)#312 |
| 43. | St John | 0.65% | 0.18%(+0.477)#41 | 0.60%(+0.053)#313 |
| 44. | Affton | 0.65% | 0.18%(+0.471)#42 | 0.60%(+0.048)#1,264 |
| 45. | Lockwood | 0.63% | 0.18%(+0.448)#43 | 0.60%(+0.025)#1,265 |
| 46. | Town And Country | 0.62% | 0.18%(+0.445)#44 | 0.60%(+0.022)#1,266 |
| 47. | Byrnes Mill | 0.60% | 0.18%(+0.426)#45 | 0.60%(+0.002)#1,267 |
| 48. | Trenton | 0.58% | 0.18%(+0.402)#46 | 0.60%(-0.021)#1,268 |
| 49. | Bella Villa | 0.58% | 0.18%(+0.399)#47 | 0.60%(-0.024)#1,269 |
| 50. | Ravenwood | 0.57% | 0.18%(+0.389)#48 | 0.60%(-0.034)#1,270 |
| 51. | Sedalia | 0.57% | 0.18%(+0.388)#49 | 0.60%(-0.035)#1,271 |
| 52. | Raymore | 0.55% | 0.18%(+0.370)#50 | 0.60%(-0.053)#1,272 |
| 53. | Truesdale | 0.54% | 0.18%(+0.363)#51 | 0.60%(-0.060)#1,273 |
| 54. | Northmoor | 0.53% | 0.18%(+0.351)#52 | 0.60%(-0.072)#1,274 |
| 55. | Brentwood | 0.53% | 0.18%(+0.349)#53 | 0.60%(-0.074)#1,275 |
| 56. | Kidder | 0.52% | 0.18%(+0.339)#54 | 0.60%(-0.084)#1,276 |
| 57. | Branson | 0.51% | 0.18%(+0.337)#55 | 0.60%(-0.086)#1,277 |
| 58. | Monett | 0.51% | 0.18%(+0.332)#56 | 0.60%(-0.091)#1,278 |
| 59. | Sycamore Hills | 0.48% | 0.18%(+0.306)#57 | 0.60%(-0.117)#1,279 |
| 60. | Buckner | 0.48% | 0.18%(+0.299)#58 | 0.60%(-0.124)#1,280 |
| 61. | Stanberry | 0.48% | 0.18%(+0.299)#59 | 0.60%(-0.124)#1,281 |
| 62. | Vandalia | 0.47% | 0.18%(+0.296)#60 | 0.60%(-0.127)#1,282 |
| 63. | California | 0.46% | 0.18%(+0.288)#61 | 0.60%(-0.135)#1,283 |
| 64. | Newtonia | 0.45% | 0.18%(+0.274)#62 | 0.60%(-0.149)#1,284 |
| 65. | Crystal City | 0.44% | 0.18%(+0.268)#63 | 0.60%(-0.155)#1,285 |
| 66. | St Paul | 0.44% | 0.18%(+0.268)#64 | 0.60%(-0.155)#1,286 |
| 67. | Creve Coeur | 0.44% | 0.18%(+0.268)#65 | 0.60%(-0.155)#1,287 |
| 68. | Smithville | 0.41% | 0.18%(+0.236)#66 | 0.60%(-0.187)#1,288 |
| 69. | Huntsville | 0.40% | 0.18%(+0.224)#67 | 0.60%(-0.199)#1,289 |
| 70. | Mehlville | 0.40% | 0.18%(+0.222)#68 | 0.60%(-0.201)#1,290 |
| 71. | La Plata | 0.40% | 0.18%(+0.219)#69 | 0.60%(-0.204)#1,291 |
| 72. | Manchester | 0.39% | 0.18%(+0.218)#70 | 0.60%(-0.205)#1,292 |
| 73. | Oakville | 0.39% | 0.18%(+0.216)#71 | 0.60%(-0.207)#1,293 |
| 74. | Rock Port | 0.39% | 0.18%(+0.216)#72 | 0.60%(-0.207)#1,294 |
| 75. | Curryville | 0.39% | 0.18%(+0.215)#73 | 0.60%(-0.208)#1,295 |
| 76. | Strafford | 0.39% | 0.18%(+0.212)#74 | 0.60%(-0.211)#1,296 |
| 77. | La Monte | 0.39% | 0.18%(+0.212)#75 | 0.60%(-0.211)#1,297 |
| 78. | St Peters | 0.39% | 0.18%(+0.212)#76 | 0.60%(-0.211)#1,298 |
| 79. | Pilot Knob | 0.39% | 0.18%(+0.211)#77 | 0.60%(-0.212)#1,299 |
| 80. | Wildwood | 0.37% | 0.18%(+0.195)#78 | 0.60%(-0.228)#1,300 |
| 81. | New London | 0.36% | 0.18%(+0.187)#79 | 0.60%(-0.236)#1,301 |
| 82. | Hazelwood | 0.36% | 0.18%(+0.186)#80 | 0.60%(-0.237)#1,302 |
| 83. | Des Peres | 0.36% | 0.18%(+0.184)#81 | 0.60%(-0.239)#1,303 |
| 84. | Carterville | 0.36% | 0.18%(+0.182)#82 | 0.60%(-0.241)#1,304 |
| 85. | Farmington | 0.35% | 0.18%(+0.176)#83 | 0.60%(-0.247)#1,305 |
| 86. | Lake Tapawingo | 0.34% | 0.18%(+0.168)#84 | 0.60%(-0.255)#1,306 |
| 87. | St Charles | 0.34% | 0.18%(+0.164)#85 | 0.60%(-0.259)#1,307 |
| 88. | Gladstone | 0.33% | 0.18%(+0.157)#86 | 0.60%(-0.266)#1,308 |
| 89. | Crestwood | 0.32% | 0.18%(+0.148)#87 | 0.60%(-0.275)#1,309 |
| 90. | Fenton | 0.32% | 0.18%(+0.141)#88 | 0.60%(-0.282)#1,310 |
| 91. | Monroe City | 0.31% | 0.18%(+0.138)#89 | 0.60%(-0.285)#1,311 |
| 92. | Springfield | 0.31% | 0.18%(+0.129)#90 | 0.60%(-0.294)#1,312 |
| 93. | Boonville | 0.30% | 0.18%(+0.121)#91 | 0.60%(-0.302)#1,313 |
| 94. | St Ann | 0.29% | 0.18%(+0.118)#92 | 0.60%(-0.306)#1,314 |
| 95. | Ballwin | 0.29% | 0.18%(+0.117)#93 | 0.60%(-0.306)#1,315 |
| 96. | Bethany | 0.29% | 0.18%(+0.112)#94 | 0.60%(-0.311)#1,316 |
| 97. | Fayette | 0.29% | 0.18%(+0.110)#95 | 0.60%(-0.313)#1,317 |
| 98. | Perryville | 0.28% | 0.18%(+0.104)#96 | 0.60%(-0.319)#1,318 |
| 99. | Harrisburg | 0.27% | 0.18%(+0.089)#97 | 0.60%(-0.334)#1,319 |
| 100. | Alton | 0.26% | 0.18%(+0.086)#98 | 0.60%(-0.337)#1,320 |
Common Questions
What are the Top 10 Cities with the Highest Percentage of Immigrants from Philippines in Missouri?
Top 10 Cities with the Highest Percentage of Immigrants from Philippines in Missouri are:
#1
6.85%
#2
4.02%
#3
3.25%
#4
3.08%
#5
2.98%
#6
2.45%
#7
2.30%
#8
2.01%
#9
1.97%
#10
1.57%
What city has the Highest Percentage of Immigrants from Philippines in Missouri?
Pierce City has the Highest Percentage of Immigrants from Philippines in Missouri with 6.85%.
What is the Percentage of Immigrants from Philippines in the State of Missouri?
Percentage of Immigrants from Philippines in Missouri is 0.18%.
What is the Percentage of Immigrants from Philippines in the United States?
Percentage of Immigrants from Philippines in the United States is 0.60%.