National Harbor, MD
National Harbor Map
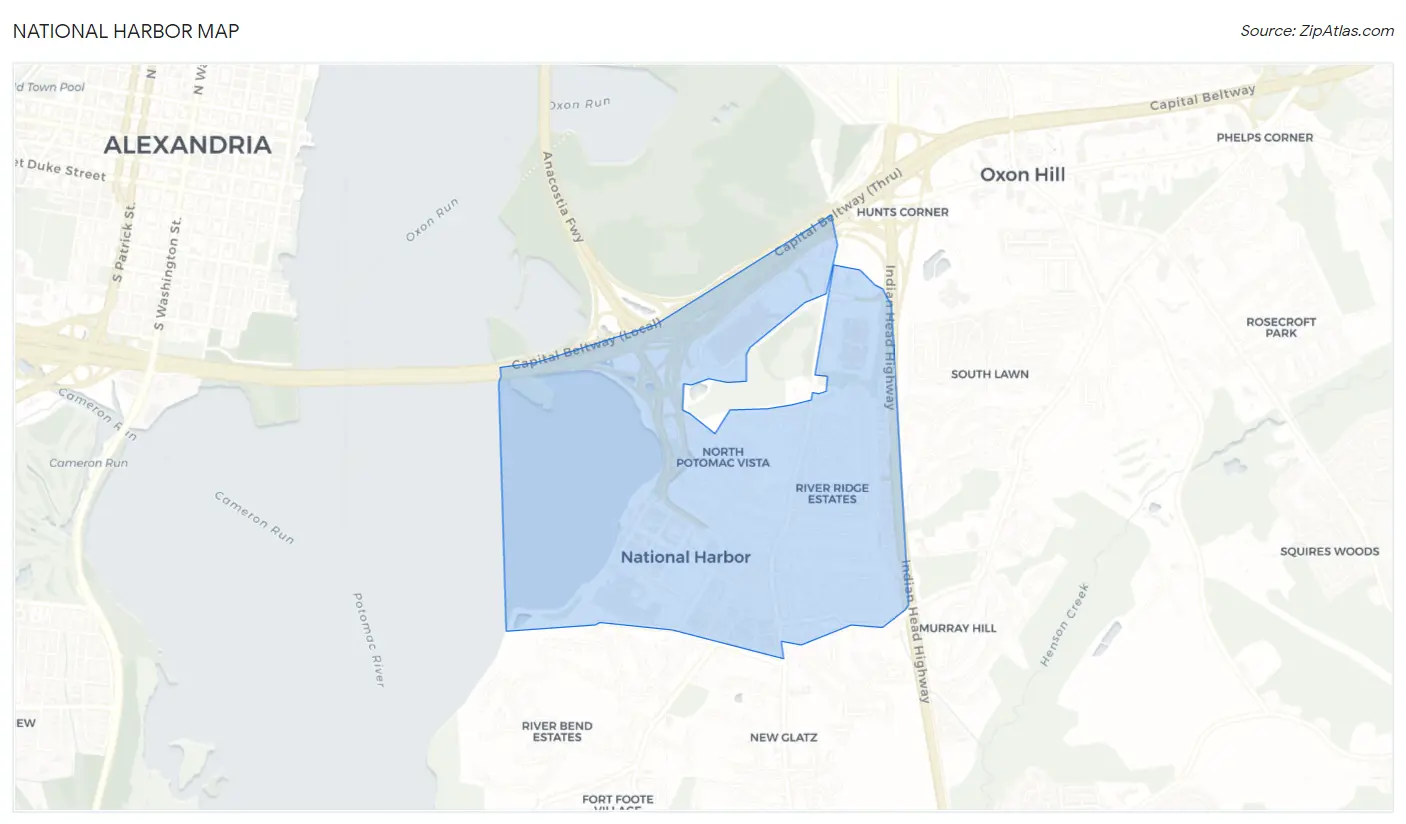
National Harbor Overview
4,268
TOTAL POPULATION
2,017
MALE POPULATION
2,251
FEMALE POPULATION
89.60
MALES / 100 FEMALES
111.60
FEMALES / 100 MALES
48.9
MEDIAN AGE
2.6
AVG FAMILY SIZE
1.8
AVG HOUSEHOLD SIZE
$80,048
PER CAPITA INCOME
$157,793
AVG FAMILY INCOME
$128,446
AVG HOUSEHOLD INCOME
12.6%
WAGE / INCOME GAP [ % ]
87.4¢/ $1
WAGE / INCOME GAP [ $ ]
0.40
INEQUALITY / GINI INDEX
3,267
LABOR FORCE [ PEOPLE ]
80.3%
PERCENT IN LABOR FORCE
2.6%
UNEMPLOYMENT RATE
Race in National Harbor
The most populous races in National Harbor are Black / African American (2,341 | 54.8%), White / Caucasian (839 | 19.7%), and Hispanic or Latino (572 | 13.4%).
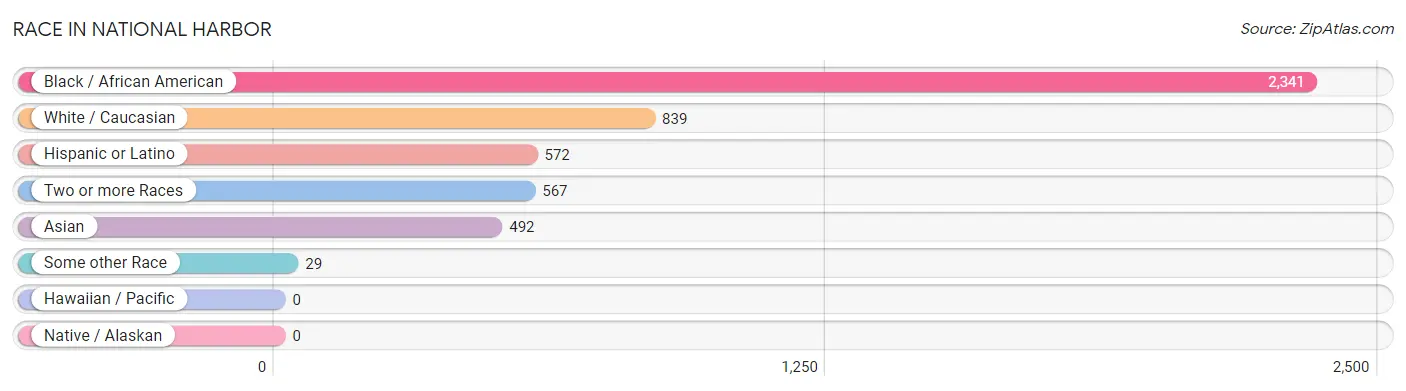
| Race | # Population | % Population |
| Asian | 492 | 11.5% |
| Black / African American | 2,341 | 54.8% |
| Hawaiian / Pacific | 0 | 0.0% |
| Hispanic or Latino | 572 | 13.4% |
| Native / Alaskan | 0 | 0.0% |
| White / Caucasian | 839 | 19.7% |
| Two or more Races | 567 | 13.3% |
| Some other Race | 29 | 0.7% |
| Total | 4,268 | 100.0% |
Ancestry in National Harbor
The most populous ancestries reported in National Harbor are Central American (333 | 7.8%), Salvadoran (333 | 7.8%), Korean (314 | 7.4%), Irish (295 | 6.9%), and Subsaharan African (226 | 5.3%), together accounting for 35.2% of all National Harbor residents.
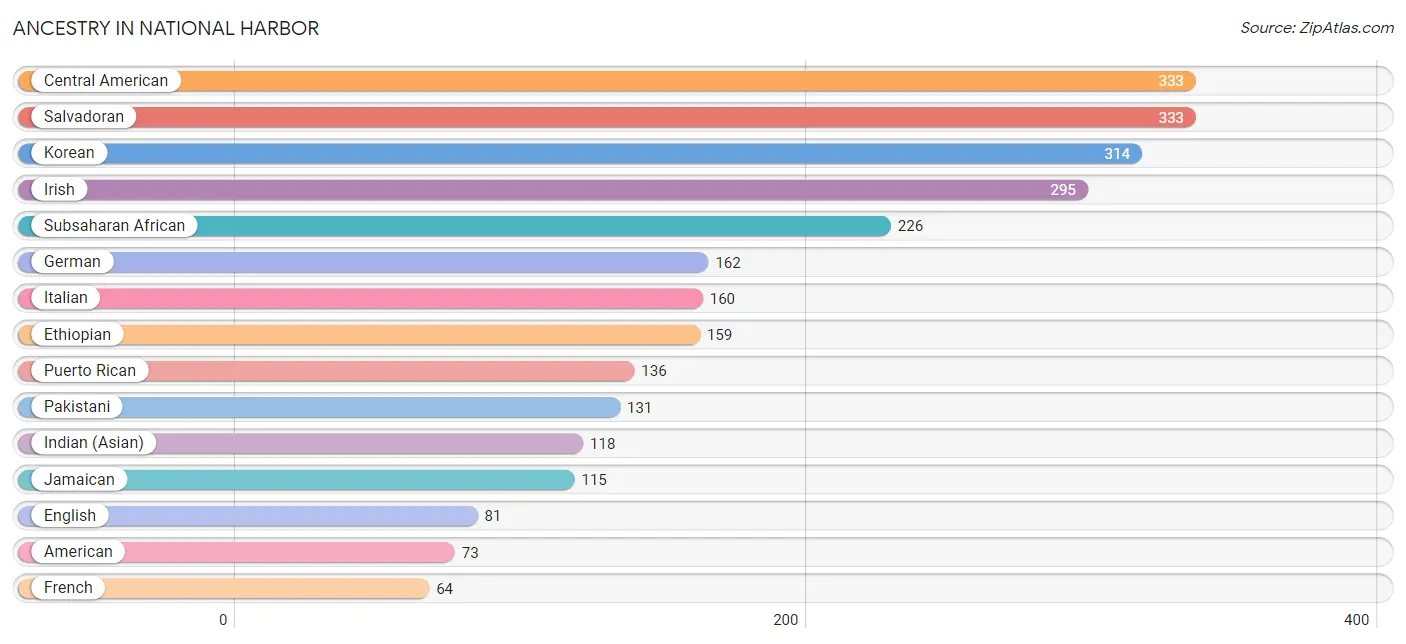
| Ancestry | # Population | % Population |
| African | 48 | 1.1% |
| American | 73 | 1.7% |
| Arab | 41 | 1.0% |
| British | 26 | 0.6% |
| Central American | 333 | 7.8% |
| Central American Indian | 9 | 0.2% |
| Cypriot | 42 | 1.0% |
| Dutch | 20 | 0.5% |
| English | 81 | 1.9% |
| Ethiopian | 159 | 3.7% |
| European | 17 | 0.4% |
| French | 64 | 1.5% |
| French Canadian | 10 | 0.2% |
| German | 162 | 3.8% |
| Hungarian | 20 | 0.5% |
| Indian (Asian) | 118 | 2.8% |
| Irish | 295 | 6.9% |
| Italian | 160 | 3.7% |
| Jamaican | 115 | 2.7% |
| Korean | 314 | 7.4% |
| Laotian | 9 | 0.2% |
| Mexican | 21 | 0.5% |
| Moroccan | 41 | 1.0% |
| Nigerian | 19 | 0.4% |
| Northern European | 22 | 0.5% |
| Norwegian | 31 | 0.7% |
| Pakistani | 131 | 3.1% |
| Paraguayan | 27 | 0.6% |
| Peruvian | 17 | 0.4% |
| Puerto Rican | 136 | 3.2% |
| Salvadoran | 333 | 7.8% |
| Scottish | 19 | 0.4% |
| South American | 44 | 1.0% |
| South American Indian | 27 | 0.6% |
| Spaniard | 38 | 0.9% |
| Subsaharan African | 226 | 5.3% |
| Ukrainian | 24 | 0.6% | View All 37 Rows |
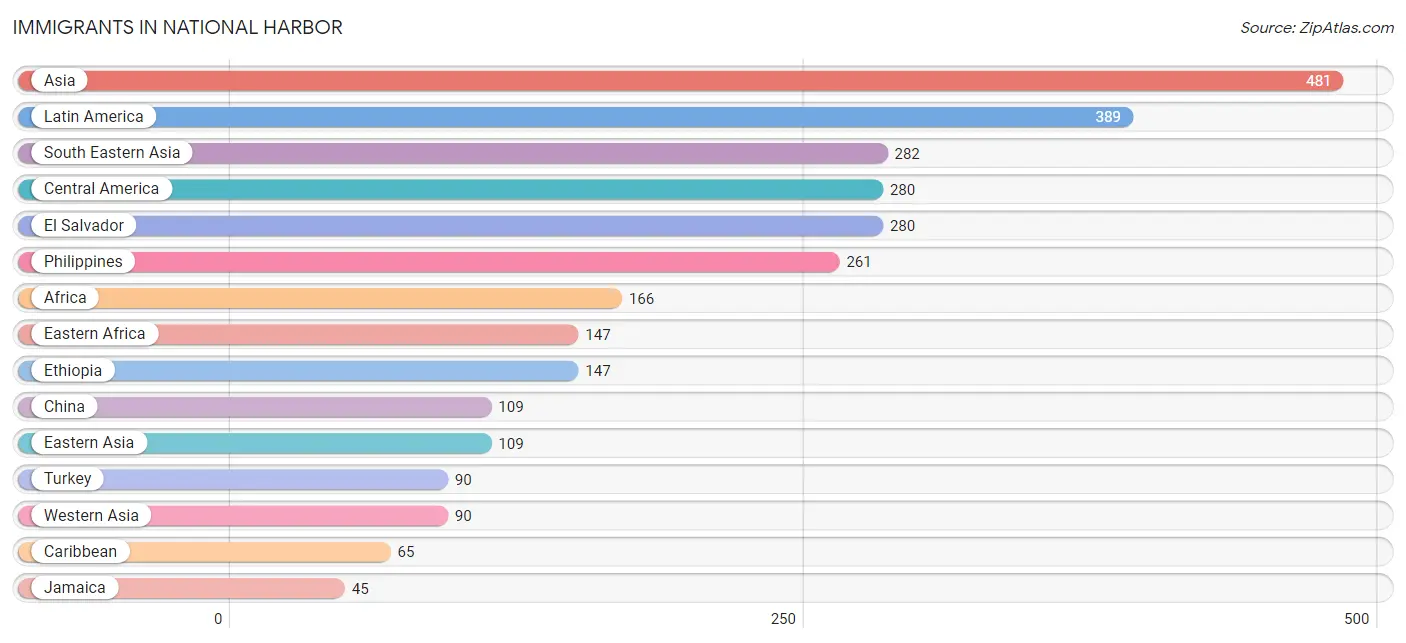
Immigrants in National Harbor
The most numerous immigrant groups reported in National Harbor came from Asia (481 | 11.3%), Latin America (389 | 9.1%), South Eastern Asia (282 | 6.6%), Central America (280 | 6.6%), and El Salvador (280 | 6.6%), together accounting for 40.1% of all National Harbor residents.
| Immigration Origin | # Population | % Population |
| Africa | 166 | 3.9% |
| Asia | 481 | 11.3% |
| Caribbean | 65 | 1.5% |
| Central America | 280 | 6.6% |
| China | 109 | 2.5% |
| Eastern Africa | 147 | 3.4% |
| Eastern Asia | 109 | 2.5% |
| El Salvador | 280 | 6.6% |
| Ethiopia | 147 | 3.4% |
| Indonesia | 7 | 0.2% |
| Jamaica | 45 | 1.1% |
| Latin America | 389 | 9.1% |
| Morocco | 19 | 0.4% |
| Northern Africa | 19 | 0.4% |
| Peru | 17 | 0.4% |
| Philippines | 261 | 6.1% |
| South America | 44 | 1.0% |
| South Eastern Asia | 282 | 6.6% |
| Thailand | 14 | 0.3% |
| Trinidad and Tobago | 20 | 0.5% |
| Turkey | 90 | 2.1% |
| Western Asia | 90 | 2.1% | View All 22 Rows |
Sex and Age in National Harbor
Sex and Age in National Harbor
The most populous age groups in National Harbor are 35 to 39 Years (281 | 13.9%) for men and 50 to 54 Years (370 | 16.4%) for women.
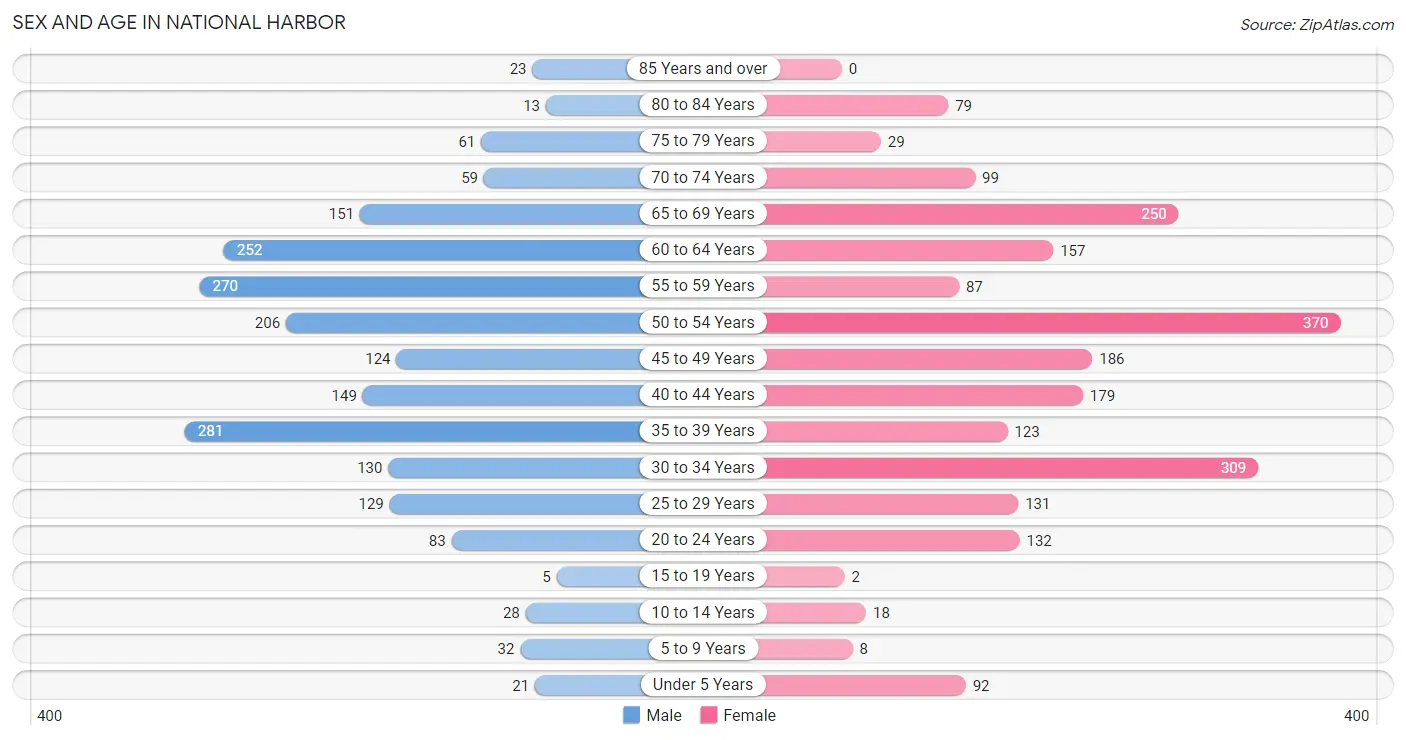
| Age Bracket | Male | Female |
| Under 5 Years | 21 (1.0%) | 92 (4.1%) |
| 5 to 9 Years | 32 (1.6%) | 8 (0.4%) |
| 10 to 14 Years | 28 (1.4%) | 18 (0.8%) |
| 15 to 19 Years | 5 (0.3%) | 2 (0.1%) |
| 20 to 24 Years | 83 (4.1%) | 132 (5.9%) |
| 25 to 29 Years | 129 (6.4%) | 131 (5.8%) |
| 30 to 34 Years | 130 (6.5%) | 309 (13.7%) |
| 35 to 39 Years | 281 (13.9%) | 123 (5.5%) |
| 40 to 44 Years | 149 (7.4%) | 179 (8.0%) |
| 45 to 49 Years | 124 (6.1%) | 186 (8.3%) |
| 50 to 54 Years | 206 (10.2%) | 370 (16.4%) |
| 55 to 59 Years | 270 (13.4%) | 87 (3.9%) |
| 60 to 64 Years | 252 (12.5%) | 157 (7.0%) |
| 65 to 69 Years | 151 (7.5%) | 250 (11.1%) |
| 70 to 74 Years | 59 (2.9%) | 99 (4.4%) |
| 75 to 79 Years | 61 (3.0%) | 29 (1.3%) |
| 80 to 84 Years | 13 (0.6%) | 79 (3.5%) |
| 85 Years and over | 23 (1.1%) | 0 (0.0%) |
| Total | 2,017 (100.0%) | 2,251 (100.0%) |
Families and Households in National Harbor
Median Family Size in National Harbor
The median family size in National Harbor is 2.61 persons per family, with single female/mother families (226 | 21.8%) accounting for the largest median family size of 3.58 persons per family. On the other hand, single male/father families (21 | 2.0%) represent the smallest median family size with 2.10 persons per family.
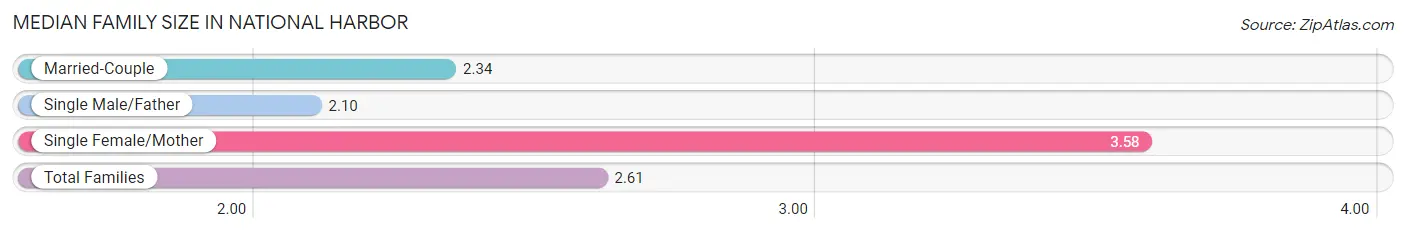
| Family Type | # Families | Family Size |
| Married-Couple | 788 (76.1%) | 2.34 |
| Single Male/Father | 21 (2.0%) | 2.10 |
| Single Female/Mother | 226 (21.8%) | 3.58 |
| Total Families | 1,035 (100.0%) | 2.61 |
Median Household Size in National Harbor
The median household size in National Harbor is 1.83 persons per household, with single female/mother households (226 | 9.7%) accounting for the largest median household size of 3.82 persons per household. non-family households (1,295 | 55.6%) represent the smallest median household size with 1.15 persons per household.
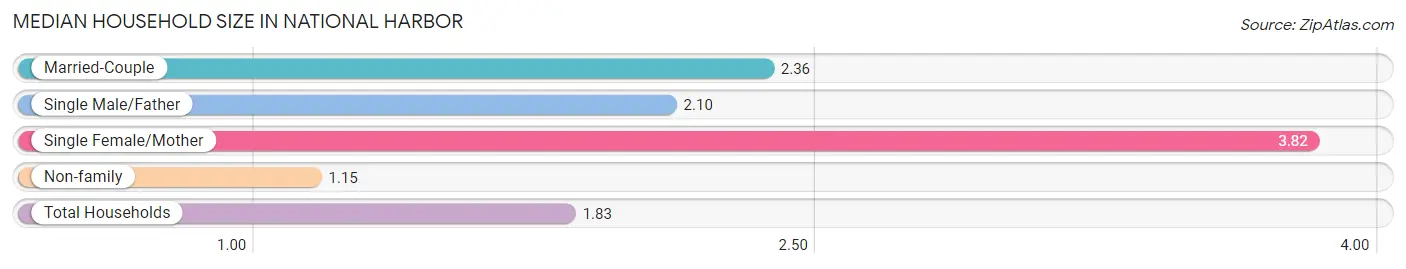
| Household Type | # Households | Household Size |
| Married-Couple | 788 (33.8%) | 2.36 |
| Single Male/Father | 21 (0.9%) | 2.10 |
| Single Female/Mother | 226 (9.7%) | 3.82 |
| Non-family | 1,295 (55.6%) | 1.15 |
| Total Households | 2,330 (100.0%) | 1.83 |
Household Size by Marriage Status in National Harbor
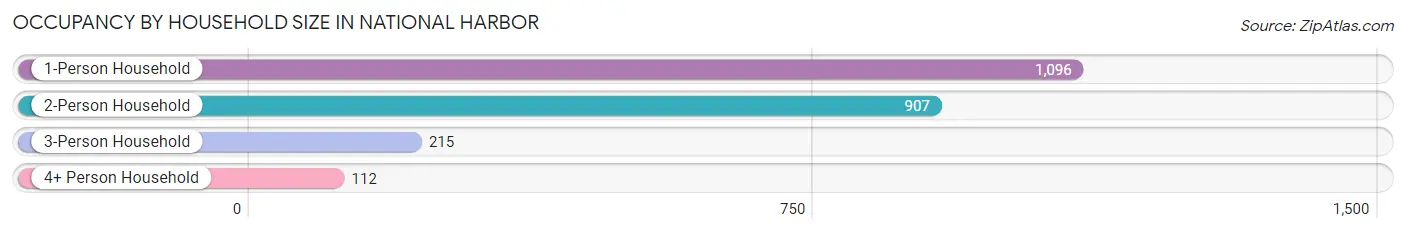
Out of a total of 2,330 households in National Harbor, 1,035 (44.4%) are family households, while 1,295 (55.6%) are nonfamily households. The most numerous type of family households are 2-person households, comprising 708, and the most common type of nonfamily households are 1-person households, comprising 1,096.
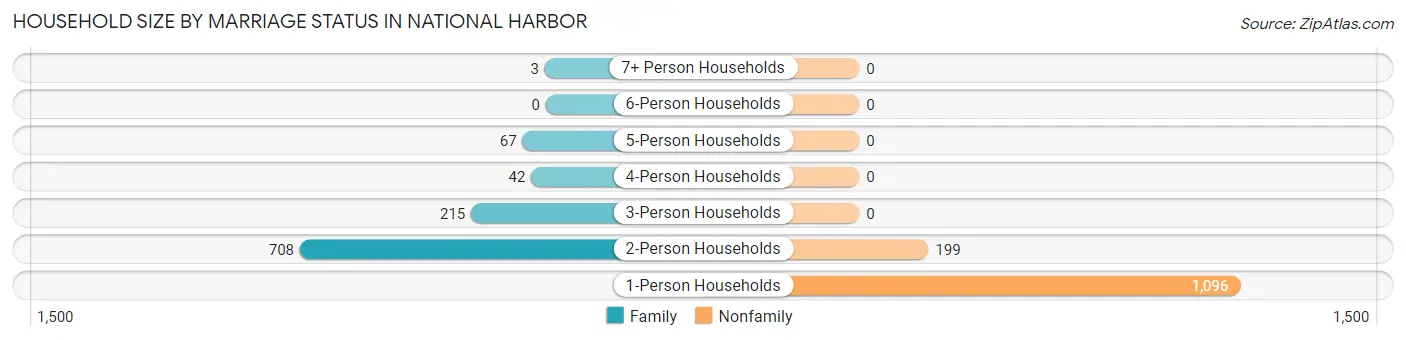
| Household Size | Family Households | Nonfamily Households |
| 1-Person Households | - | 1,096 (47.0%) |
| 2-Person Households | 708 (30.4%) | 199 (8.5%) |
| 3-Person Households | 215 (9.2%) | 0 (0.0%) |
| 4-Person Households | 42 (1.8%) | 0 (0.0%) |
| 5-Person Households | 67 (2.9%) | 0 (0.0%) |
| 6-Person Households | 0 (0.0%) | 0 (0.0%) |
| 7+ Person Households | 3 (0.1%) | 0 (0.0%) |
| Total | 1,035 (44.4%) | 1,295 (55.6%) |
Female Fertility in National Harbor
Fertility by Age in National Harbor
Average fertility rate in National Harbor is 17.0 births per 1,000 women. Women in the age bracket of 20 to 34 years have the highest fertility rate with 33.0 births per 1,000 women. Women in the age bracket of 20 to 34 years acount for 100.0% of all women with births.
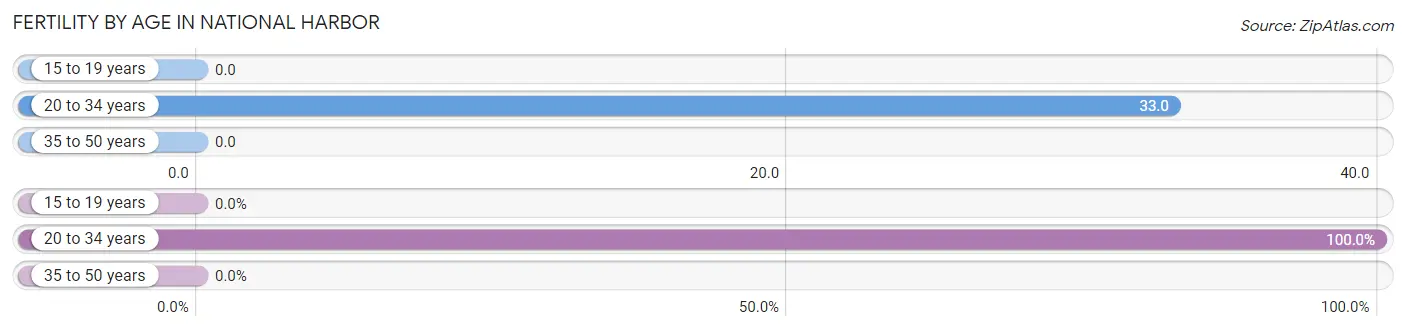
| Age Bracket | Women with Births | Births / 1,000 Women |
| 15 to 19 years | 0 (0.0%) | 0.0 |
| 20 to 34 years | 19 (100.0%) | 33.0 |
| 35 to 50 years | 0 (0.0%) | 0.0 |
| Total | 19 (100.0%) | 17.0 |
Fertility by Age by Marriage Status in National Harbor
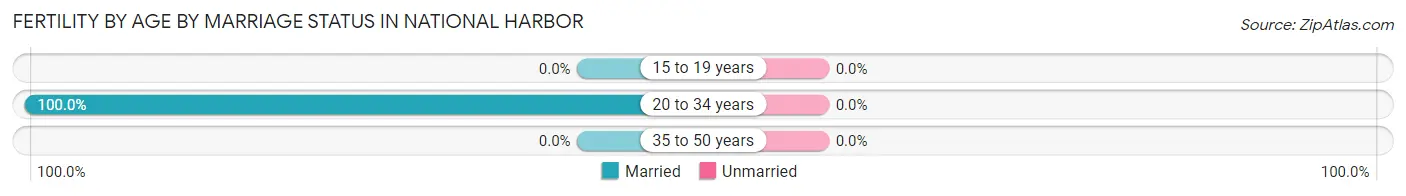
| Age Bracket | Married | Unmarried |
| 15 to 19 years | 0 (0.0%) | 0 (0.0%) |
| 20 to 34 years | 19 (100.0%) | 0 (0.0%) |
| 35 to 50 years | 0 (0.0%) | 0 (0.0%) |
| Total | 19 (100.0%) | 0 (0.0%) |
Fertility by Education in National Harbor
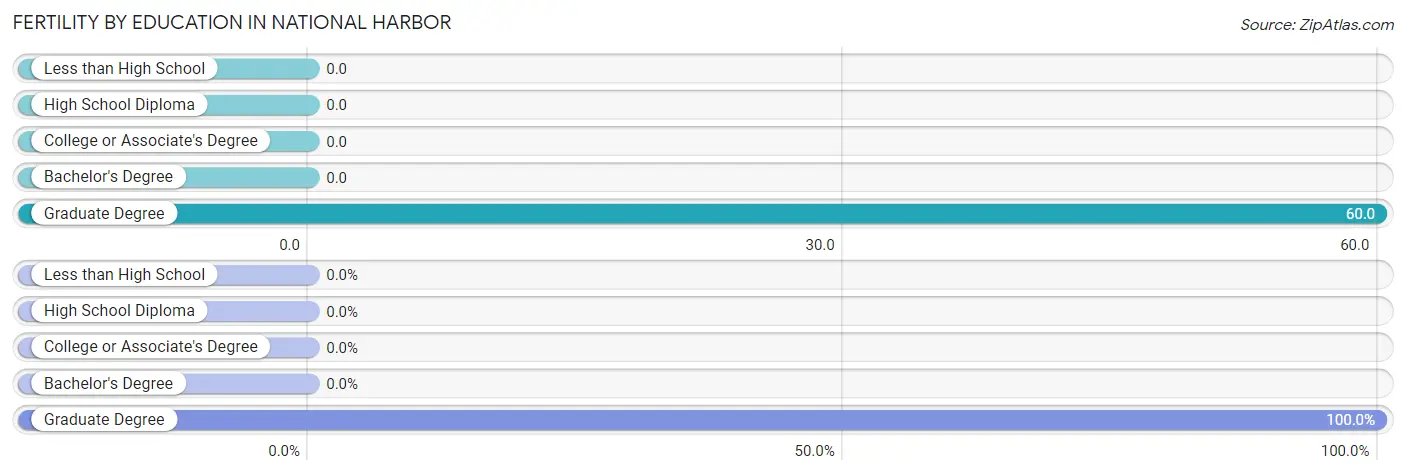
| Educational Attainment | Women with Births | Births / 1,000 Women |
| Less than High School | 0 (0.0%) | 0.0 |
| High School Diploma | 0 (0.0%) | 0.0 |
| College or Associate's Degree | 0 (0.0%) | 0.0 |
| Bachelor's Degree | 0 (0.0%) | 0.0 |
| Graduate Degree | 19 (100.0%) | 60.0 |
| Total | 19 (100.0%) | 17.0 |
Fertility by Education by Marriage Status in National Harbor
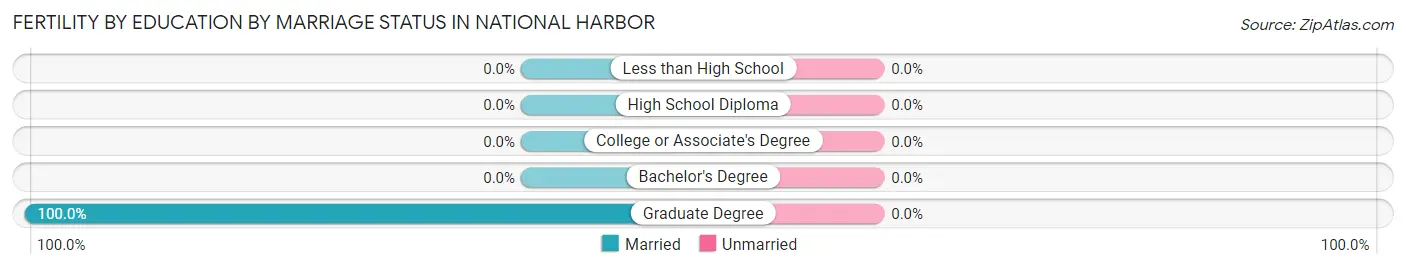
| Educational Attainment | Married | Unmarried |
| Less than High School | 0 (0.0%) | 0 (0.0%) |
| High School Diploma | 0 (0.0%) | 0 (0.0%) |
| College or Associate's Degree | 0 (0.0%) | 0 (0.0%) |
| Bachelor's Degree | 0 (0.0%) | 0 (0.0%) |
| Graduate Degree | 19 (100.0%) | 0 (0.0%) |
| Total | 19 (100.0%) | 0 (0.0%) |
Income in National Harbor
Income Overview in National Harbor
Per Capita Income in National Harbor is $80,048, while median incomes of families and households are $157,793 and $128,446 respectively.
| Characteristic | Number | Measure |
| Per Capita Income | 4,268 | $80,048 |
| Median Family Income | 1,035 | $157,793 |
| Mean Family Income | 1,035 | $197,314 |
| Median Household Income | 2,330 | $128,446 |
| Mean Household Income | 2,330 | $144,641 |
| Income Deficit | 1,035 | $0 |
| Wage / Income Gap (%) | 4,268 | 12.63% |
| Wage / Income Gap ($) | 4,268 | 87.37¢ per $1 |
| Gini / Inequality Index | 4,268 | 0.40 |
Earnings by Sex in National Harbor
Average Earnings in National Harbor are $75,180, $68,164 for men and $78,019 for women, a difference of 12.6%.
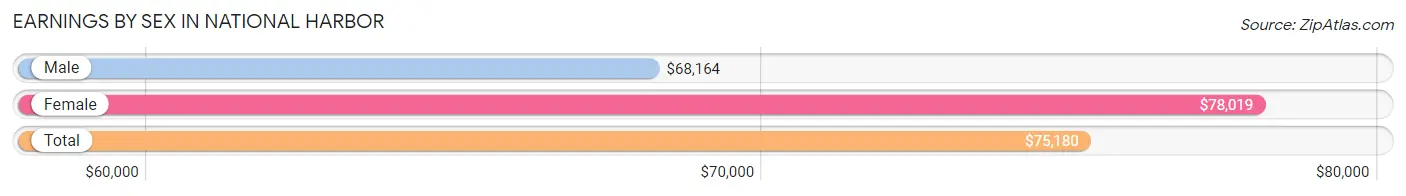
| Sex | Number | Average Earnings |
| Male | 1,543 (47.7%) | $68,164 |
| Female | 1,691 (52.3%) | $78,019 |
| Total | 3,234 (100.0%) | $75,180 |
Earnings by Sex by Income Bracket in National Harbor
The most common earnings brackets in National Harbor are $100,000+ for men (511 | 33.1%) and $100,000+ for women (489 | 28.9%).
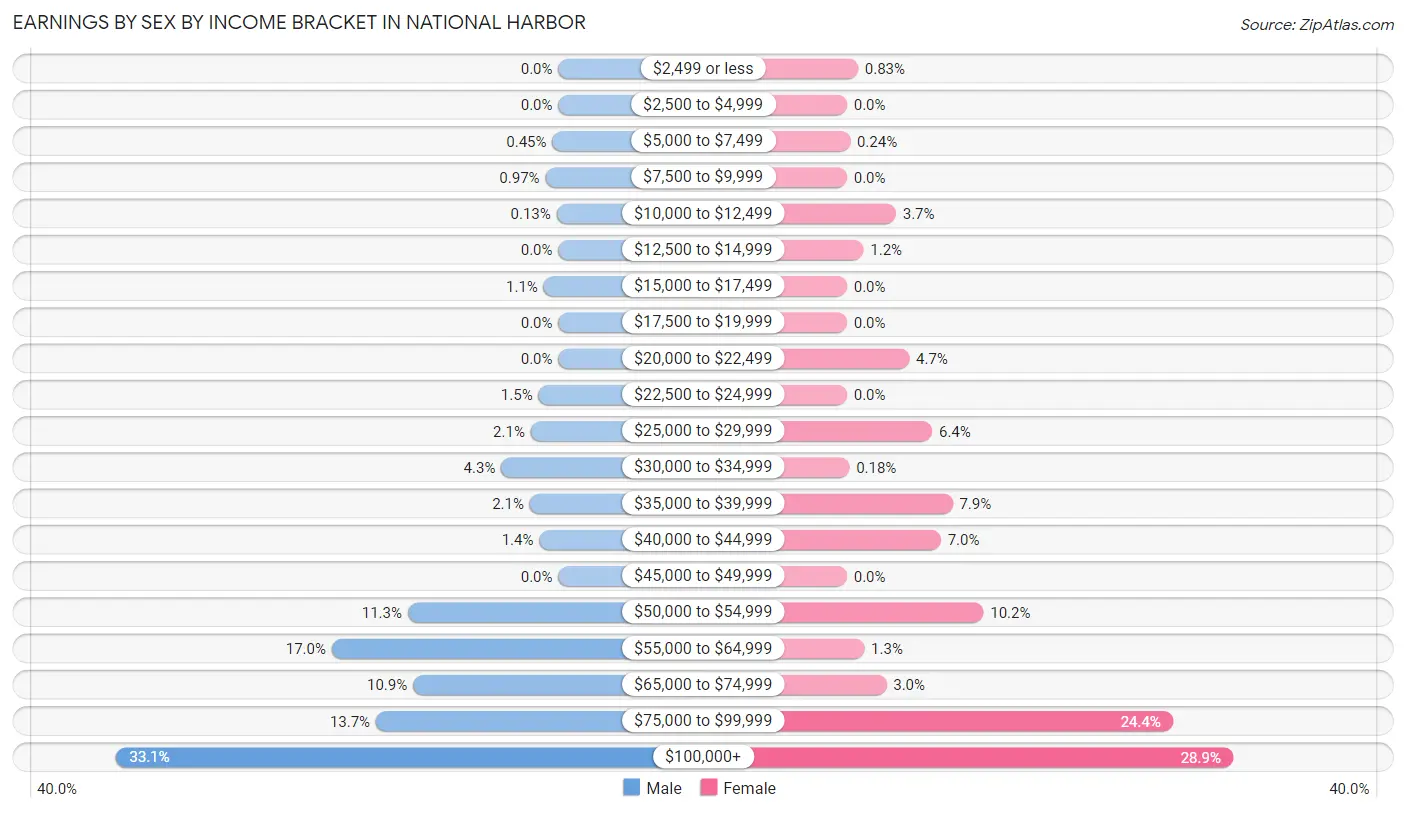
| Income | Male | Female |
| $2,499 or less | 0 (0.0%) | 14 (0.8%) |
| $2,500 to $4,999 | 0 (0.0%) | 0 (0.0%) |
| $5,000 to $7,499 | 7 (0.4%) | 4 (0.2%) |
| $7,500 to $9,999 | 15 (1.0%) | 0 (0.0%) |
| $10,000 to $12,499 | 2 (0.1%) | 62 (3.7%) |
| $12,500 to $14,999 | 0 (0.0%) | 21 (1.2%) |
| $15,000 to $17,499 | 17 (1.1%) | 0 (0.0%) |
| $17,500 to $19,999 | 0 (0.0%) | 0 (0.0%) |
| $20,000 to $22,499 | 0 (0.0%) | 79 (4.7%) |
| $22,500 to $24,999 | 23 (1.5%) | 0 (0.0%) |
| $25,000 to $29,999 | 32 (2.1%) | 108 (6.4%) |
| $30,000 to $34,999 | 66 (4.3%) | 3 (0.2%) |
| $35,000 to $39,999 | 33 (2.1%) | 134 (7.9%) |
| $40,000 to $44,999 | 22 (1.4%) | 119 (7.0%) |
| $45,000 to $49,999 | 0 (0.0%) | 0 (0.0%) |
| $50,000 to $54,999 | 174 (11.3%) | 173 (10.2%) |
| $55,000 to $64,999 | 262 (17.0%) | 22 (1.3%) |
| $65,000 to $74,999 | 168 (10.9%) | 50 (3.0%) |
| $75,000 to $99,999 | 211 (13.7%) | 413 (24.4%) |
| $100,000+ | 511 (33.1%) | 489 (28.9%) |
| Total | 1,543 (100.0%) | 1,691 (100.0%) |
Earnings by Sex by Educational Attainment in National Harbor
Average earnings in National Harbor are $71,731 for men and $79,774 for women, a difference of 10.1%. Men with an educational attainment of graduate degree enjoy the highest average annual earnings of $128,977, while those with high school diploma education earn the least with $56,861. Women with an educational attainment of graduate degree earn the most with the average annual earnings of $101,574, while those with college or associate's degree education have the smallest earnings of $41,224.
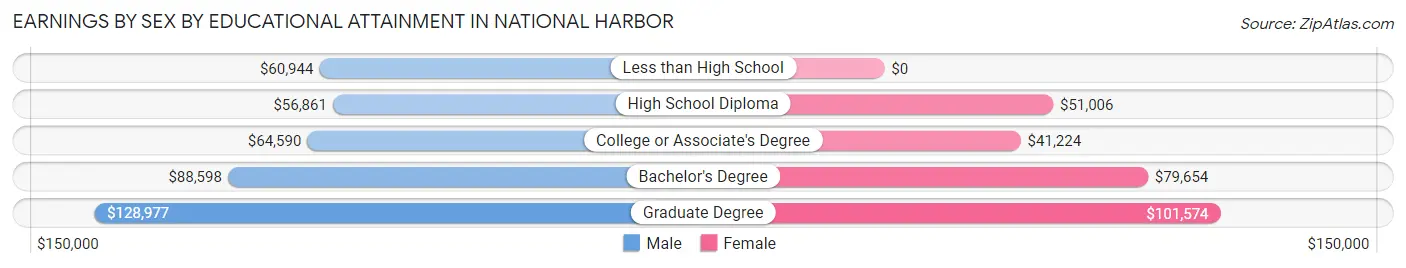
| Educational Attainment | Male Income | Female Income |
| Less than High School | $60,944 | $0 |
| High School Diploma | $56,861 | $51,006 |
| College or Associate's Degree | $64,590 | $41,224 |
| Bachelor's Degree | $88,598 | $79,654 |
| Graduate Degree | $128,977 | $101,574 |
| Total | $71,731 | $79,774 |
Family Income in National Harbor
Family Income Brackets in National Harbor
According to the National Harbor family income data, there are 310 families falling into the $200,000+ income range, which is the most common income bracket and makes up 29.9% of all families.
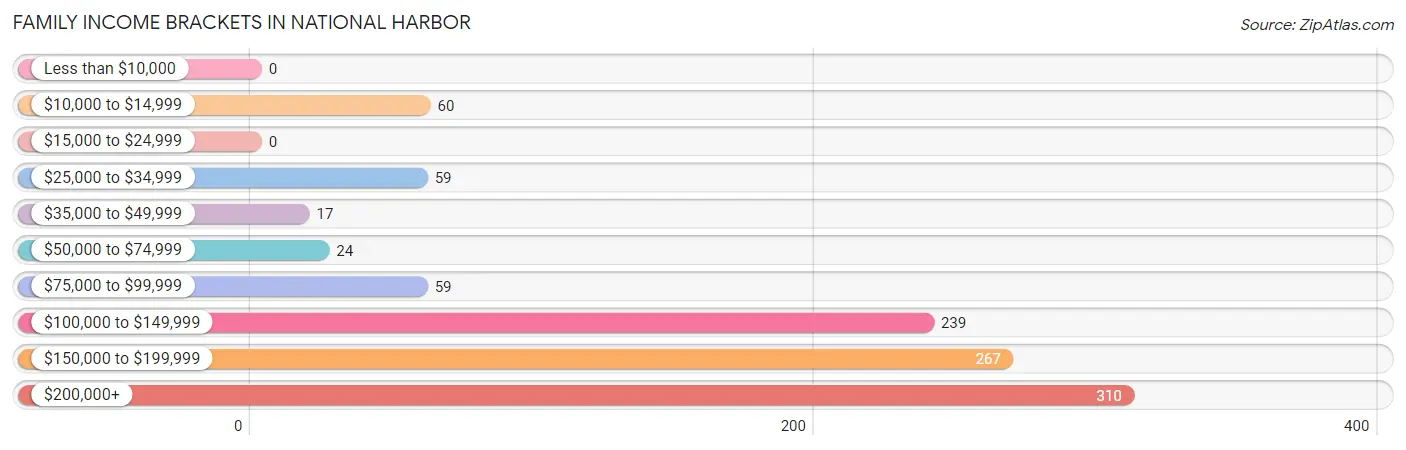
| Income Bracket | # Families | % Families |
| Less than $10,000 | 0 | 0.0% |
| $10,000 to $14,999 | 60 | 5.8% |
| $15,000 to $24,999 | 0 | 0.0% |
| $25,000 to $34,999 | 59 | 5.7% |
| $35,000 to $49,999 | 17 | 1.6% |
| $50,000 to $74,999 | 24 | 2.3% |
| $75,000 to $99,999 | 59 | 5.7% |
| $100,000 to $149,999 | 239 | 23.1% |
| $150,000 to $199,999 | 267 | 25.8% |
| $200,000+ | 310 | 30.0% |
Family Income by Famaliy Size in National Harbor
2-person families (717 | 69.3%) account for the highest median family income in National Harbor with $159,473 per family, while 2-person families (717 | 69.3%) have the highest median income of $79,736 per family member.
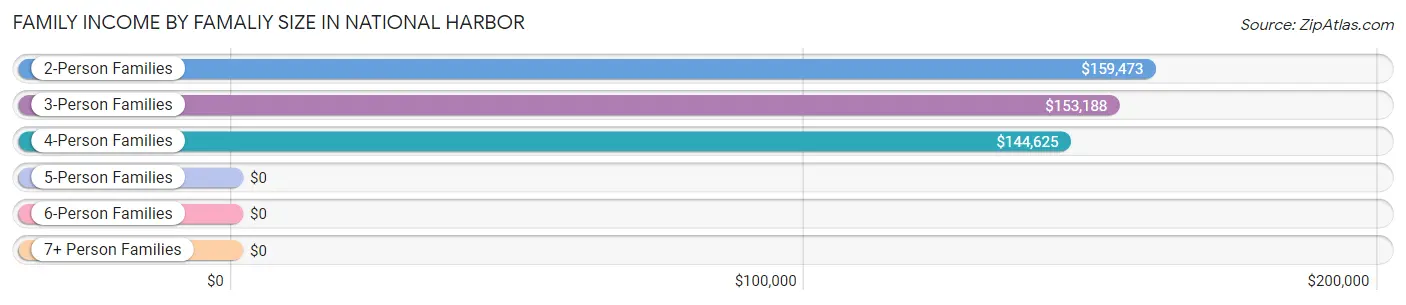
| Income Bracket | # Families | Median Income |
| 2-Person Families | 717 (69.3%) | $159,473 |
| 3-Person Families | 206 (19.9%) | $153,188 |
| 4-Person Families | 102 (9.9%) | $144,625 |
| 5-Person Families | 7 (0.7%) | $0 |
| 6-Person Families | 3 (0.3%) | $0 |
| 7+ Person Families | 0 (0.0%) | $0 |
| Total | 1,035 (100.0%) | $157,793 |
Family Income by Number of Earners in National Harbor
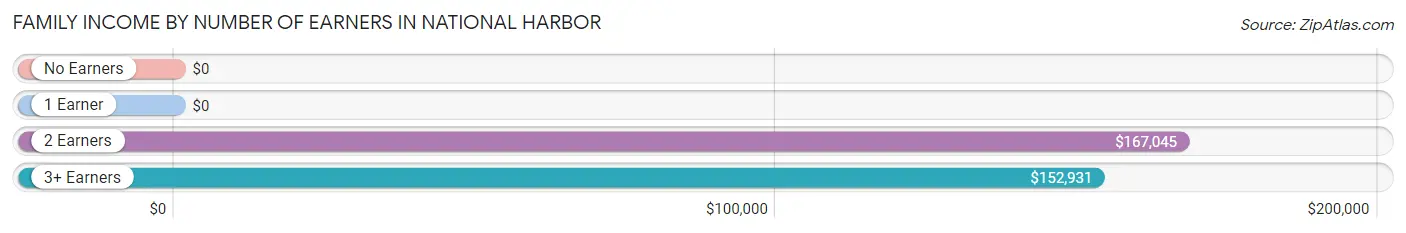
| Number of Earners | # Families | Median Income |
| No Earners | 106 (10.2%) | $0 |
| 1 Earner | 203 (19.6%) | $0 |
| 2 Earners | 562 (54.3%) | $167,045 |
| 3+ Earners | 164 (15.9%) | $152,931 |
| Total | 1,035 (100.0%) | $157,793 |
Household Income in National Harbor
Household Income Brackets in National Harbor
With 550 households falling in the category, the $100,000 to $149,999 income range is the most frequent in National Harbor, accounting for 23.6% of all households.
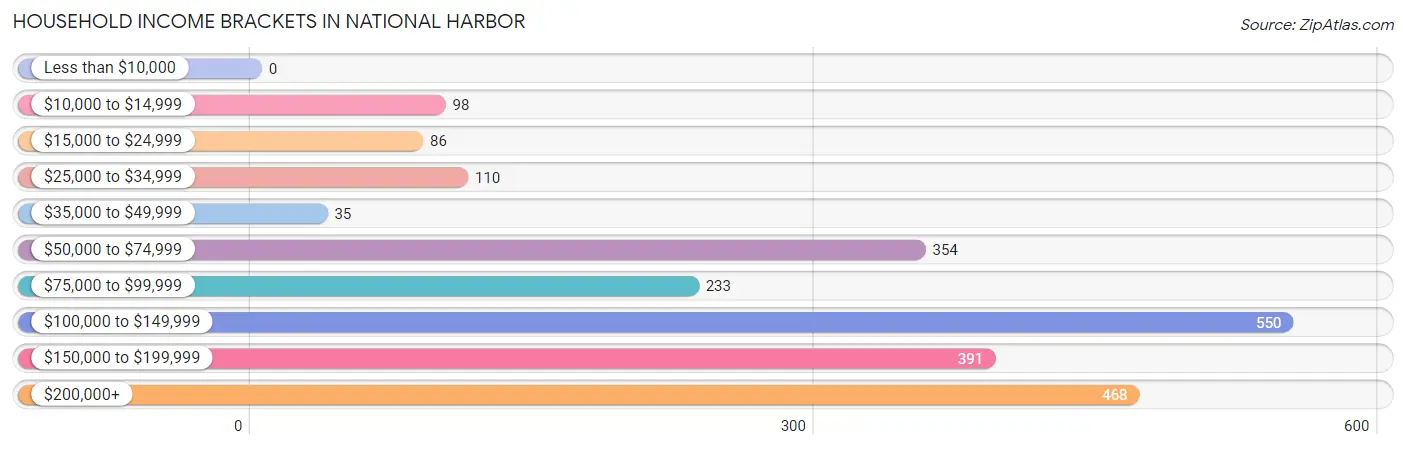
| Income Bracket | # Households | % Households |
| Less than $10,000 | 0 | 0.0% |
| $10,000 to $14,999 | 98 | 4.2% |
| $15,000 to $24,999 | 86 | 3.7% |
| $25,000 to $34,999 | 110 | 4.7% |
| $35,000 to $49,999 | 35 | 1.5% |
| $50,000 to $74,999 | 354 | 15.2% |
| $75,000 to $99,999 | 233 | 10.0% |
| $100,000 to $149,999 | 550 | 23.6% |
| $150,000 to $199,999 | 391 | 16.8% |
| $200,000+ | 468 | 20.1% |
Household Income by Householder Age in National Harbor
The median household income in National Harbor is $128,446, with the highest median household income of $149,347 found in the 25 to 44 years age bracket for the primary householder. A total of 725 households (31.1%) fall into this category. Meanwhile, the 15 to 24 years age bracket for the primary householder has the lowest median household income of $0, with 76 households (3.3%) in this group.

| Income Bracket | # Households | Median Income |
| 15 to 24 Years | 76 (3.3%) | $0 |
| 25 to 44 Years | 725 (31.1%) | $149,347 |
| 45 to 64 Years | 1,015 (43.6%) | $113,036 |
| 65+ Years | 514 (22.1%) | $101,012 |
| Total | 2,330 (100.0%) | $128,446 |
Poverty in National Harbor
Income Below Poverty by Sex and Age in National Harbor
With 1.2% poverty level for males and 13.4% for females among the residents of National Harbor, 45 to 54 year old males and under 5 year old females are the most vulnerable to poverty, with 15 males (4.5%) and 66 females (71.7%) in their respective age groups living below the poverty level.
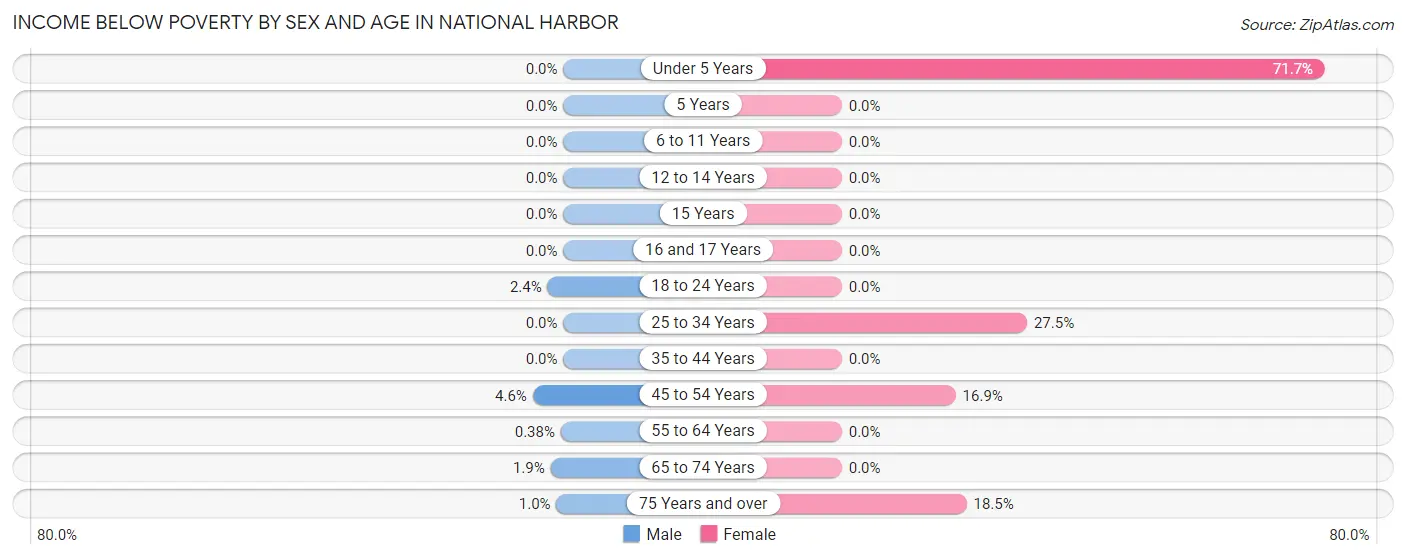
| Age Bracket | Male | Female |
| Under 5 Years | 0 (0.0%) | 66 (71.7%) |
| 5 Years | 0 (0.0%) | 0 (0.0%) |
| 6 to 11 Years | 0 (0.0%) | 0 (0.0%) |
| 12 to 14 Years | 0 (0.0%) | 0 (0.0%) |
| 15 Years | 0 (0.0%) | 0 (0.0%) |
| 16 and 17 Years | 0 (0.0%) | 0 (0.0%) |
| 18 to 24 Years | 2 (2.4%) | 0 (0.0%) |
| 25 to 34 Years | 0 (0.0%) | 121 (27.5%) |
| 35 to 44 Years | 0 (0.0%) | 0 (0.0%) |
| 45 to 54 Years | 15 (4.5%) | 94 (16.9%) |
| 55 to 64 Years | 2 (0.4%) | 0 (0.0%) |
| 65 to 74 Years | 4 (1.9%) | 0 (0.0%) |
| 75 Years and over | 1 (1.0%) | 20 (18.5%) |
| Total | 24 (1.2%) | 301 (13.4%) |
Income Above Poverty by Sex and Age in National Harbor
According to the poverty statistics in National Harbor, males aged under 5 years and females aged 5 years are the age groups that are most secure financially, with 100.0% of males and 100.0% of females in these age groups living above the poverty line.
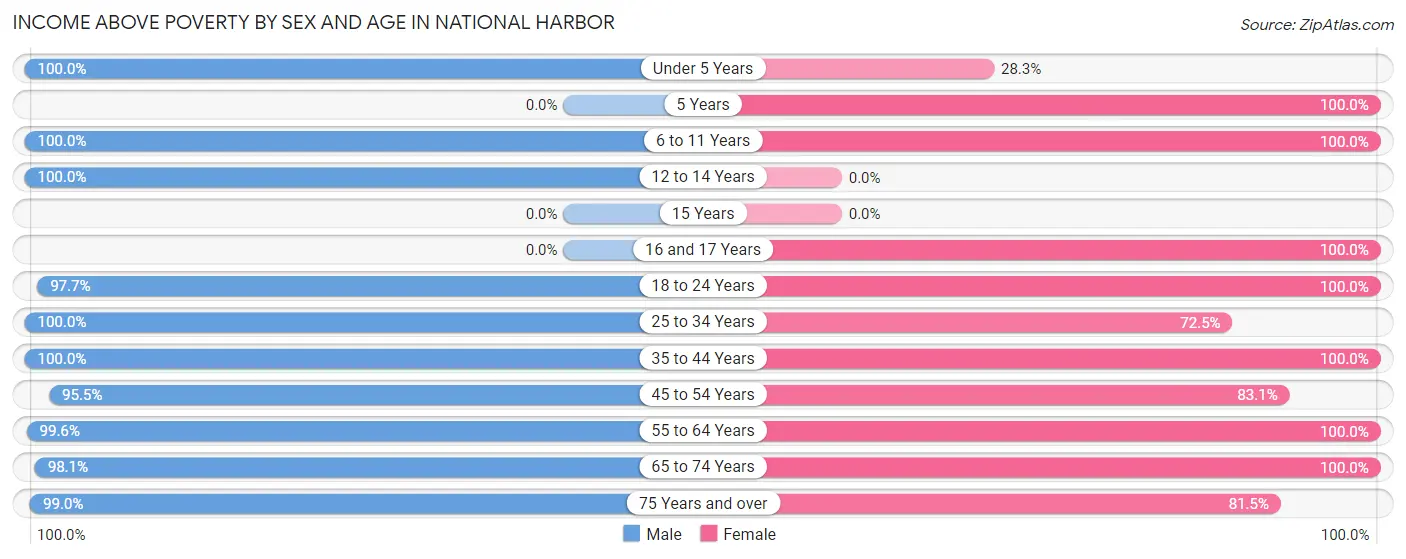
| Age Bracket | Male | Female |
| Under 5 Years | 21 (100.0%) | 26 (28.3%) |
| 5 Years | 0 (0.0%) | 8 (100.0%) |
| 6 to 11 Years | 31 (100.0%) | 18 (100.0%) |
| 12 to 14 Years | 28 (100.0%) | 0 (0.0%) |
| 15 Years | 0 (0.0%) | 0 (0.0%) |
| 16 and 17 Years | 0 (0.0%) | 2 (100.0%) |
| 18 to 24 Years | 83 (97.7%) | 132 (100.0%) |
| 25 to 34 Years | 259 (100.0%) | 319 (72.5%) |
| 35 to 44 Years | 430 (100.0%) | 302 (100.0%) |
| 45 to 54 Years | 315 (95.5%) | 462 (83.1%) |
| 55 to 64 Years | 520 (99.6%) | 244 (100.0%) |
| 65 to 74 Years | 206 (98.1%) | 349 (100.0%) |
| 75 Years and over | 96 (99.0%) | 88 (81.5%) |
| Total | 1,989 (98.8%) | 1,950 (86.6%) |
Income Below Poverty Among Married-Couple Families in National Harbor
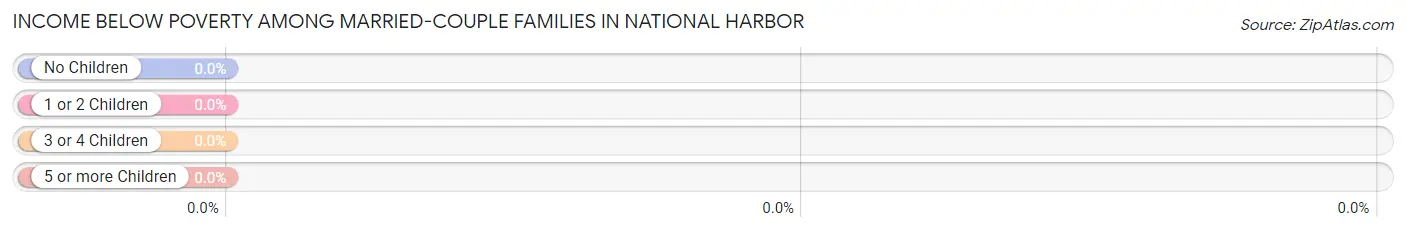
| Children | Above Poverty | Below Poverty |
| No Children | 715 (100.0%) | 0 (0.0%) |
| 1 or 2 Children | 73 (100.0%) | 0 (0.0%) |
| 3 or 4 Children | 0 (0.0%) | 0 (0.0%) |
| 5 or more Children | 0 (0.0%) | 0 (0.0%) |
| Total | 788 (100.0%) | 0 (0.0%) |
Income Below Poverty Among Single-Parent Households in National Harbor

| Children | Single Father | Single Mother |
| No Children | 0 (0.0%) | 0 (0.0%) |
| 1 or 2 Children | 0 (0.0%) | 60 (85.7%) |
| 3 or 4 Children | 0 (0.0%) | 0 (0.0%) |
| 5 or more Children | 0 (0.0%) | 0 (0.0%) |
| Total | 0 (0.0%) | 60 (26.6%) |
Income Below Poverty Among Married-Couple vs Single-Parent Households in National Harbor
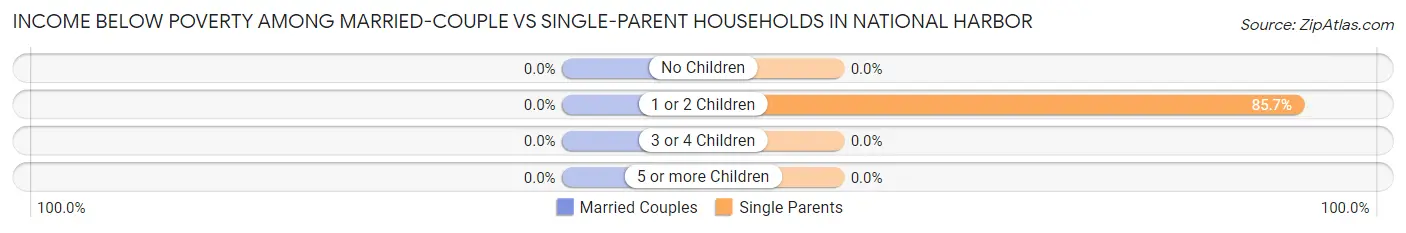
| Children | Married-Couple Families | Single-Parent Households |
| No Children | 0 (0.0%) | 0 (0.0%) |
| 1 or 2 Children | 0 (0.0%) | 60 (85.7%) |
| 3 or 4 Children | 0 (0.0%) | 0 (0.0%) |
| 5 or more Children | 0 (0.0%) | 0 (0.0%) |
| Total | 0 (0.0%) | 60 (24.3%) |
Employment Characteristics in National Harbor
Employment by Class of Employer in National Harbor
Among the 3,142 employed individuals in National Harbor, private company employees (1,378 | 43.9%), federal government employees (631 | 20.1%), and not-for-profit organizations (350 | 11.1%) make up the most common classes of employment.
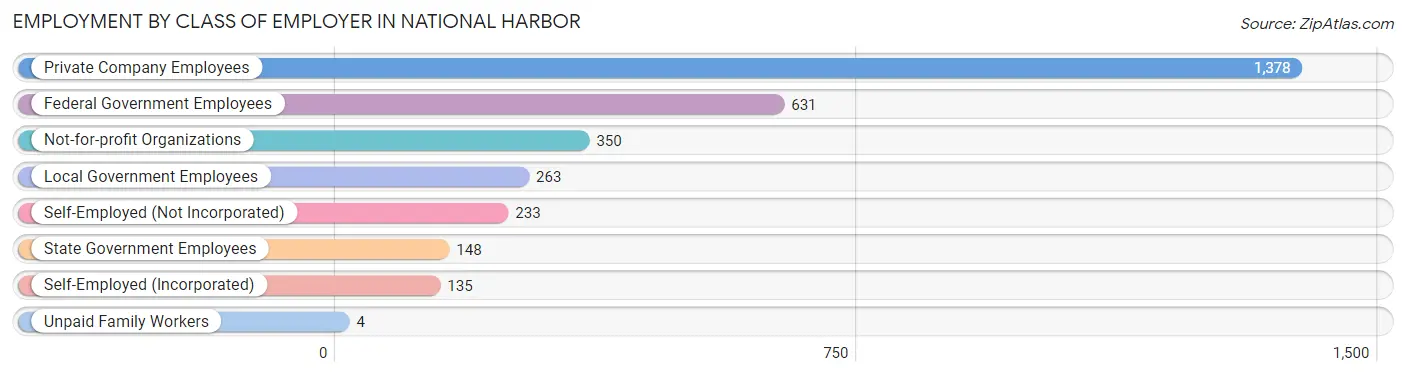
| Employer Class | # Employees | % Employees |
| Private Company Employees | 1,378 | 43.9% |
| Self-Employed (Incorporated) | 135 | 4.3% |
| Self-Employed (Not Incorporated) | 233 | 7.4% |
| Not-for-profit Organizations | 350 | 11.1% |
| Local Government Employees | 263 | 8.4% |
| State Government Employees | 148 | 4.7% |
| Federal Government Employees | 631 | 20.1% |
| Unpaid Family Workers | 4 | 0.1% |
| Total | 3,142 | 100.0% |
Employment Status by Age in National Harbor
According to the labor force statistics for National Harbor, out of the total population over 16 years of age (4,069), 80.3% or 3,267 individuals are in the labor force, with 2.6% or 85 of them unemployed. The age group with the highest labor force participation rate is 25 to 29 years, with 100.0% or 260 individuals in the labor force. Within the labor force, the 45 to 54 years age range has the highest percentage of unemployed individuals, with 7.4% or 61 of them being unemployed.
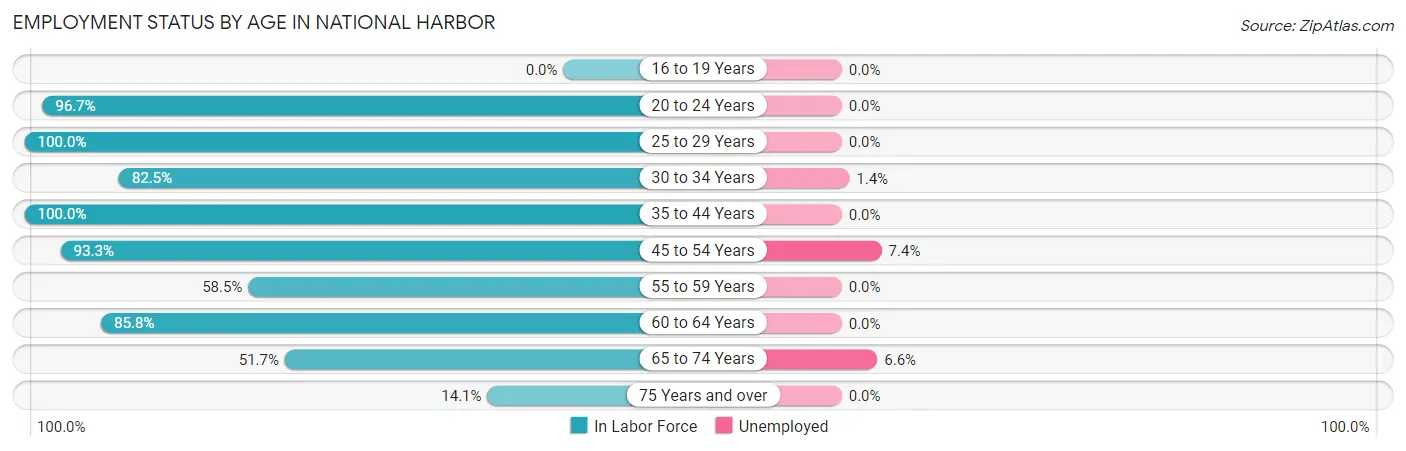
| Age Bracket | In Labor Force | Unemployed |
| 16 to 19 Years | 0 (0.0%) | 0 (0.0%) |
| 20 to 24 Years | 208 (96.7%) | 0 (0.0%) |
| 25 to 29 Years | 260 (100.0%) | 0 (0.0%) |
| 30 to 34 Years | 362 (82.5%) | 5 (1.4%) |
| 35 to 44 Years | 732 (100.0%) | 0 (0.0%) |
| 45 to 54 Years | 827 (93.3%) | 61 (7.4%) |
| 55 to 59 Years | 209 (58.5%) | 0 (0.0%) |
| 60 to 64 Years | 351 (85.8%) | 0 (0.0%) |
| 65 to 74 Years | 289 (51.7%) | 19 (6.6%) |
| 75 Years and over | 29 (14.1%) | 0 (0.0%) |
| Total | 3,267 (80.3%) | 85 (2.6%) |
Employment Status by Educational Attainment in National Harbor
According to labor force statistics for National Harbor, 88.9% of individuals (2,741) out of the total population between 25 and 64 years of age (3,083) are in the labor force, with 2.4% or 66 of them being unemployed. The group with the highest labor force participation rate are those with the educational attainment of bachelor's degree or higher, with 97.2% or 1,575 individuals in the labor force. Within the labor force, individuals with college / associate degree education have the highest percentage of unemployment, with 8.7% or 60 of them being unemployed.
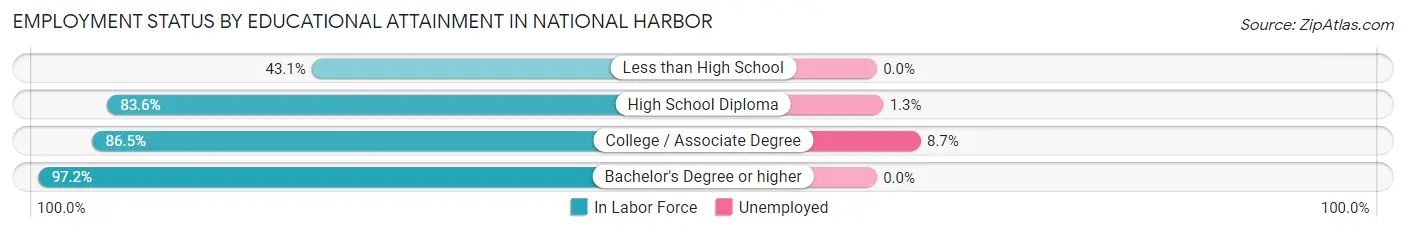
| Educational Attainment | In Labor Force | Unemployed |
| Less than High School | 84 (43.1%) | 0 (0.0%) |
| High School Diploma | 397 (83.6%) | 6 (1.3%) |
| College / Associate Degree | 686 (86.5%) | 69 (8.7%) |
| Bachelor's Degree or higher | 1,575 (97.2%) | 0 (0.0%) |
| Total | 2,741 (88.9%) | 74 (2.4%) |
Employment Occupations by Sex in National Harbor
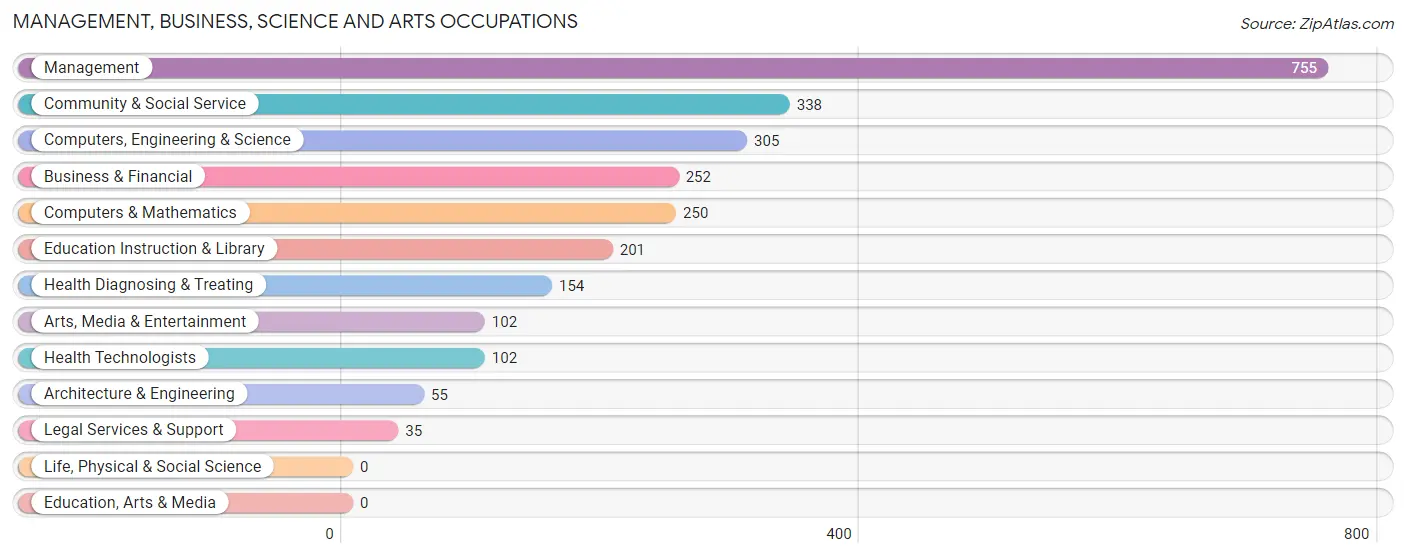
Management, Business, Science and Arts Occupations
The most common Management, Business, Science and Arts occupations in National Harbor are Management (755 | 24.0%), Community & Social Service (338 | 10.8%), Computers, Engineering & Science (305 | 9.7%), Business & Financial (252 | 8.0%), and Computers & Mathematics (250 | 8.0%).
Management, Business, Science and Arts Occupations by Sex
Within the Management, Business, Science and Arts occupations in National Harbor, the most male-oriented occupations are Arts, Media & Entertainment (91.2%), Architecture & Engineering (65.4%), and Community & Social Service (61.8%), while the most female-oriented occupations are Health Diagnosing & Treating (100.0%), Health Technologists (100.0%), and Computers & Mathematics (76.4%).
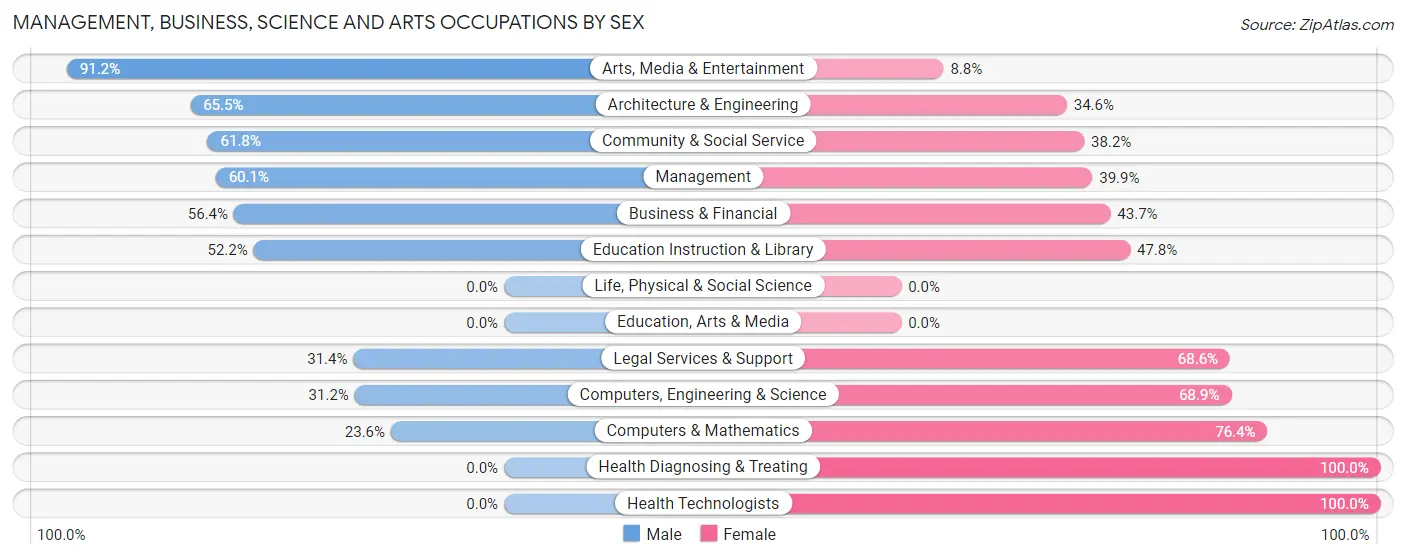
| Occupation | Male | Female |
| Management | 454 (60.1%) | 301 (39.9%) |
| Business & Financial | 142 (56.4%) | 110 (43.6%) |
| Computers, Engineering & Science | 95 (31.1%) | 210 (68.9%) |
| Computers & Mathematics | 59 (23.6%) | 191 (76.4%) |
| Architecture & Engineering | 36 (65.4%) | 19 (34.5%) |
| Life, Physical & Social Science | 0 (0.0%) | 0 (0.0%) |
| Community & Social Service | 209 (61.8%) | 129 (38.2%) |
| Education, Arts & Media | 0 (0.0%) | 0 (0.0%) |
| Legal Services & Support | 11 (31.4%) | 24 (68.6%) |
| Education Instruction & Library | 105 (52.2%) | 96 (47.8%) |
| Arts, Media & Entertainment | 93 (91.2%) | 9 (8.8%) |
| Health Diagnosing & Treating | 0 (0.0%) | 154 (100.0%) |
| Health Technologists | 0 (0.0%) | 102 (100.0%) |
| Total (Category) | 900 (49.9%) | 904 (50.1%) |
| Total (Overall) | 1,504 (47.9%) | 1,635 (52.1%) |
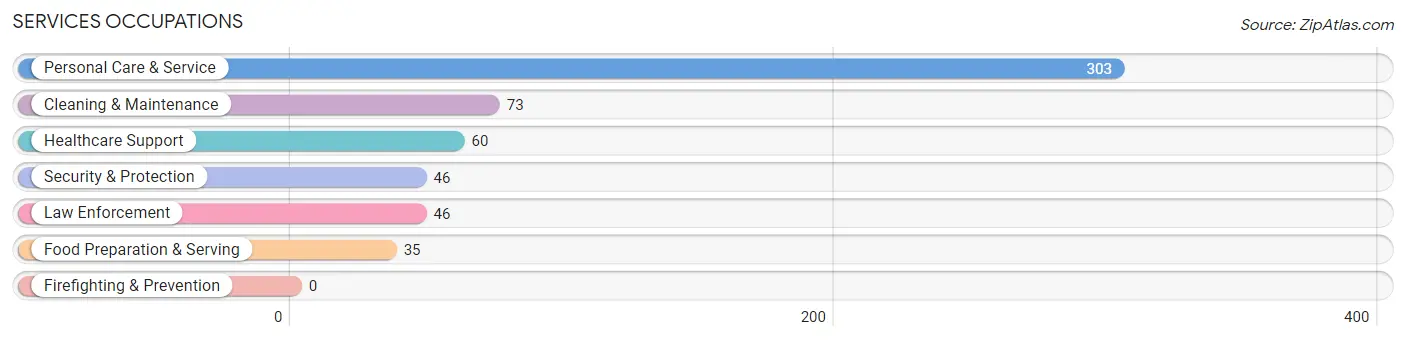
Services Occupations
The most common Services occupations in National Harbor are Personal Care & Service (303 | 9.7%), Cleaning & Maintenance (73 | 2.3%), Healthcare Support (60 | 1.9%), Security & Protection (46 | 1.5%), and Law Enforcement (46 | 1.5%).
Services Occupations by Sex
Within the Services occupations in National Harbor, the most male-oriented occupations are Personal Care & Service (52.5%), Security & Protection (45.7%), and Law Enforcement (45.7%), while the most female-oriented occupations are Healthcare Support (100.0%), Cleaning & Maintenance (100.0%), and Food Preparation & Serving (85.7%).
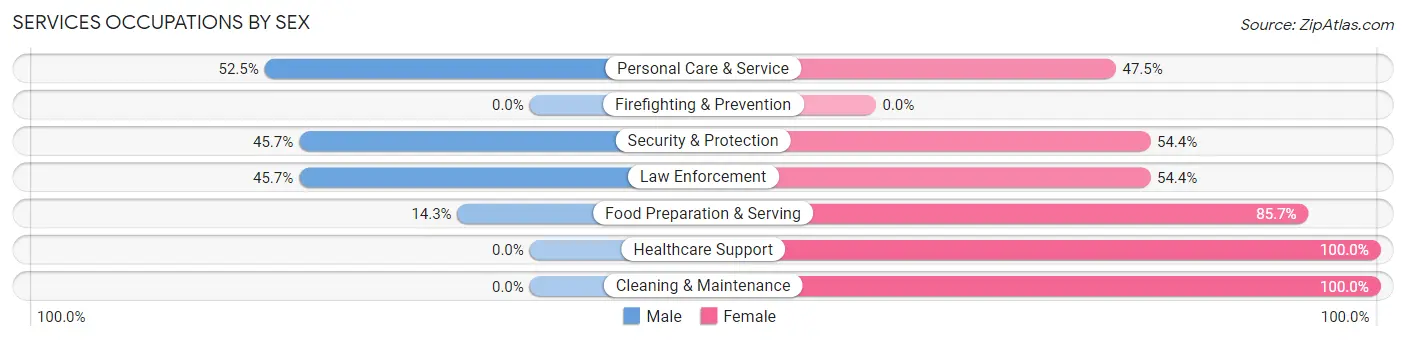
| Occupation | Male | Female |
| Healthcare Support | 0 (0.0%) | 60 (100.0%) |
| Security & Protection | 21 (45.7%) | 25 (54.3%) |
| Firefighting & Prevention | 0 (0.0%) | 0 (0.0%) |
| Law Enforcement | 21 (45.7%) | 25 (54.3%) |
| Food Preparation & Serving | 5 (14.3%) | 30 (85.7%) |
| Cleaning & Maintenance | 0 (0.0%) | 73 (100.0%) |
| Personal Care & Service | 159 (52.5%) | 144 (47.5%) |
| Total (Category) | 185 (35.8%) | 332 (64.2%) |
| Total (Overall) | 1,504 (47.9%) | 1,635 (52.1%) |
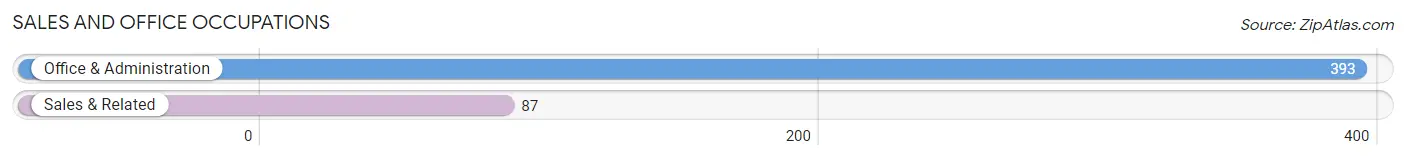
Sales and Office Occupations
The most common Sales and Office occupations in National Harbor are Office & Administration (393 | 12.5%), and Sales & Related (87 | 2.8%).
Sales and Office Occupations by Sex
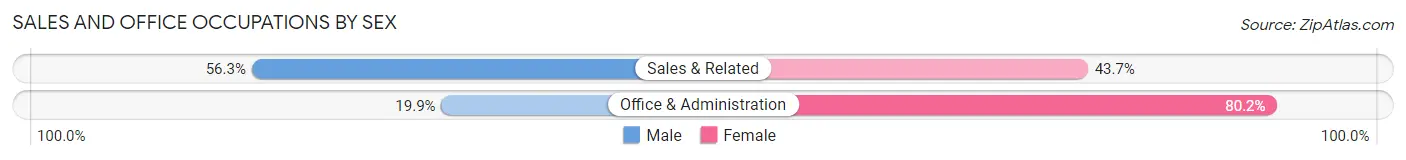
| Occupation | Male | Female |
| Sales & Related | 49 (56.3%) | 38 (43.7%) |
| Office & Administration | 78 (19.9%) | 315 (80.1%) |
| Total (Category) | 127 (26.5%) | 353 (73.5%) |
| Total (Overall) | 1,504 (47.9%) | 1,635 (52.1%) |
Natural Resources, Construction and Maintenance Occupations
The most common Natural Resources, Construction and Maintenance occupations in National Harbor are , and Construction & Extraction (109 | 3.5%).

Natural Resources, Construction and Maintenance Occupations by Sex
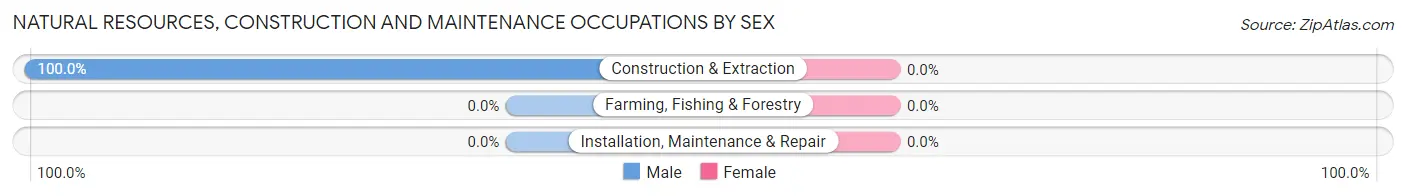
| Occupation | Male | Female |
| Farming, Fishing & Forestry | 0 (0.0%) | 0 (0.0%) |
| Construction & Extraction | 109 (100.0%) | 0 (0.0%) |
| Installation, Maintenance & Repair | 0 (0.0%) | 0 (0.0%) |
| Total (Category) | 109 (100.0%) | 0 (0.0%) |
| Total (Overall) | 1,504 (47.9%) | 1,635 (52.1%) |
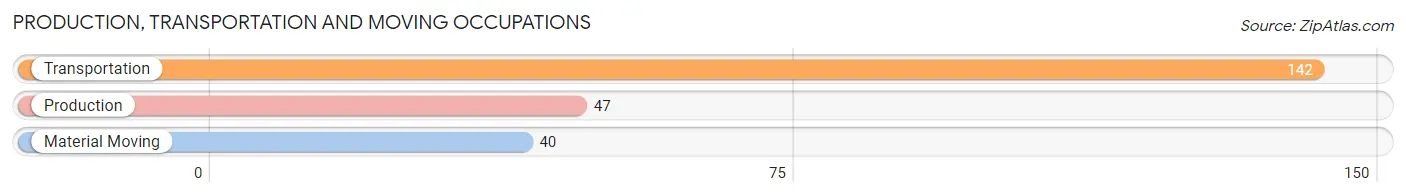
Production, Transportation and Moving Occupations
The most common Production, Transportation and Moving occupations in National Harbor are Transportation (142 | 4.5%), Production (47 | 1.5%), and Material Moving (40 | 1.3%).
Production, Transportation and Moving Occupations by Sex
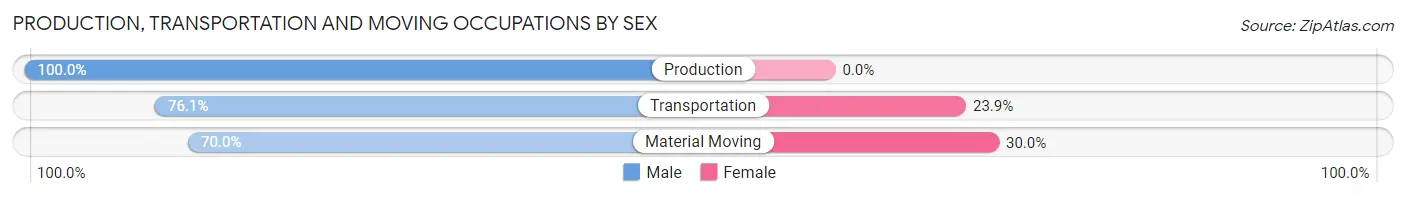
| Occupation | Male | Female |
| Production | 47 (100.0%) | 0 (0.0%) |
| Transportation | 108 (76.1%) | 34 (23.9%) |
| Material Moving | 28 (70.0%) | 12 (30.0%) |
| Total (Category) | 183 (79.9%) | 46 (20.1%) |
| Total (Overall) | 1,504 (47.9%) | 1,635 (52.1%) |
Employment Industries by Sex in National Harbor
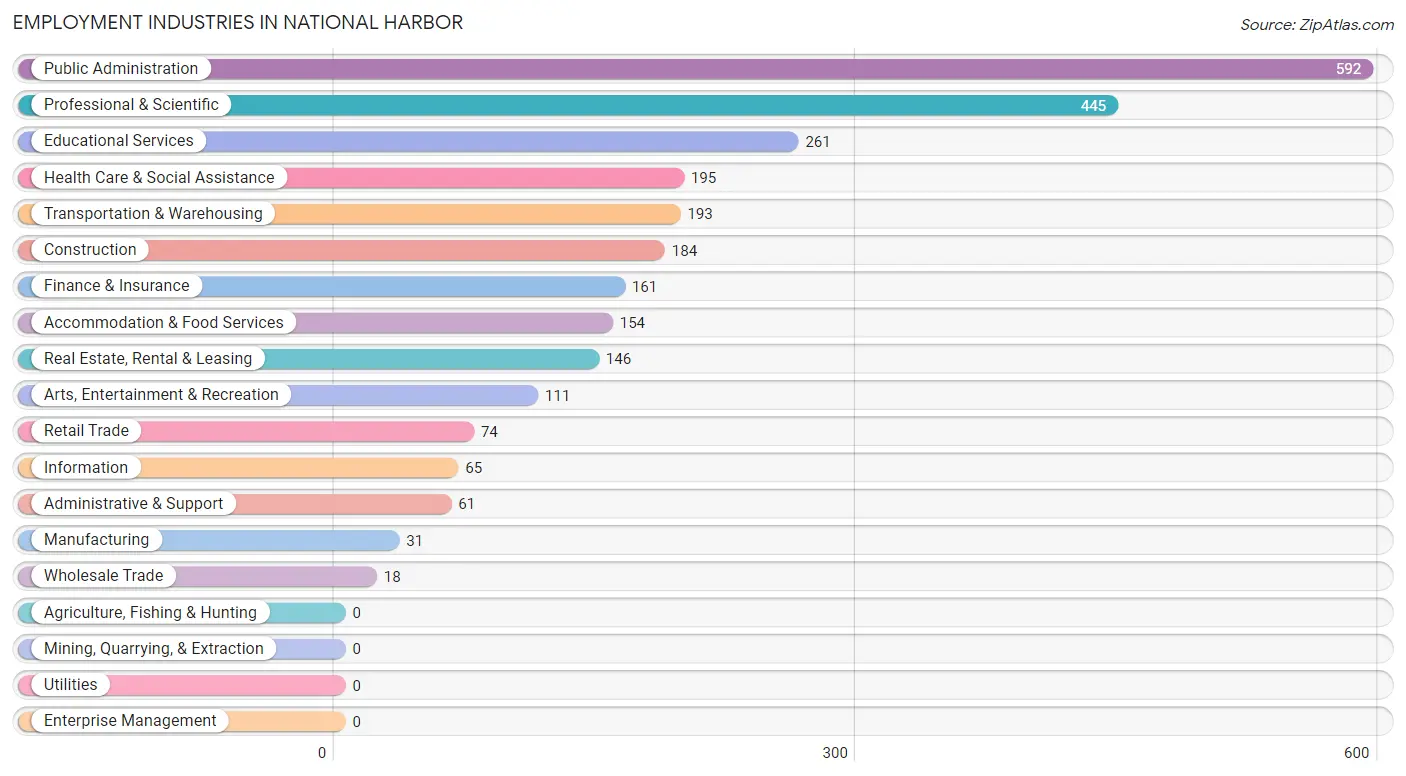
Employment Industries in National Harbor
The major employment industries in National Harbor include Public Administration (592 | 18.9%), Professional & Scientific (445 | 14.2%), Educational Services (261 | 8.3%), Health Care & Social Assistance (195 | 6.2%), and Transportation & Warehousing (193 | 6.1%).
Employment Industries by Sex in National Harbor
The National Harbor industries that see more men than women are Manufacturing (100.0%), Wholesale Trade (100.0%), and Information (75.4%), whereas the industries that tend to have a higher number of women are Health Care & Social Assistance (83.6%), Administrative & Support (80.3%), and Accommodation & Food Services (64.9%).
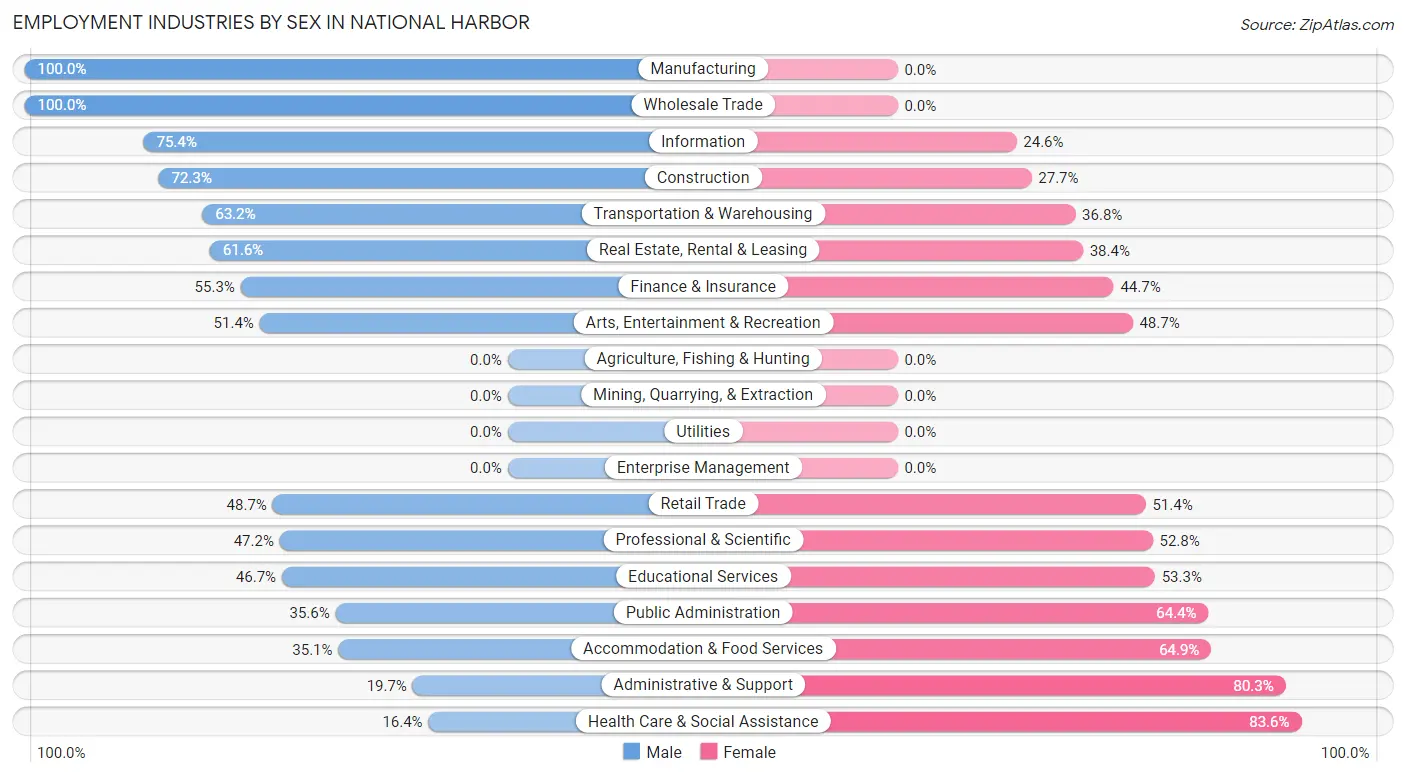
| Industry | Male | Female |
| Agriculture, Fishing & Hunting | 0 (0.0%) | 0 (0.0%) |
| Mining, Quarrying, & Extraction | 0 (0.0%) | 0 (0.0%) |
| Construction | 133 (72.3%) | 51 (27.7%) |
| Manufacturing | 31 (100.0%) | 0 (0.0%) |
| Wholesale Trade | 18 (100.0%) | 0 (0.0%) |
| Retail Trade | 36 (48.6%) | 38 (51.3%) |
| Transportation & Warehousing | 122 (63.2%) | 71 (36.8%) |
| Utilities | 0 (0.0%) | 0 (0.0%) |
| Information | 49 (75.4%) | 16 (24.6%) |
| Finance & Insurance | 89 (55.3%) | 72 (44.7%) |
| Real Estate, Rental & Leasing | 90 (61.6%) | 56 (38.4%) |
| Professional & Scientific | 210 (47.2%) | 235 (52.8%) |
| Enterprise Management | 0 (0.0%) | 0 (0.0%) |
| Administrative & Support | 12 (19.7%) | 49 (80.3%) |
| Educational Services | 122 (46.7%) | 139 (53.3%) |
| Health Care & Social Assistance | 32 (16.4%) | 163 (83.6%) |
| Arts, Entertainment & Recreation | 57 (51.3%) | 54 (48.6%) |
| Accommodation & Food Services | 54 (35.1%) | 100 (64.9%) |
| Public Administration | 211 (35.6%) | 381 (64.4%) |
| Total | 1,504 (47.9%) | 1,635 (52.1%) |
Education in National Harbor
School Enrollment in National Harbor
The most common levels of schooling among the 238 students in National Harbor are college / undergraduate (86 | 36.1%), graduate / professional (61 | 25.6%), and elementary school (50 | 21.0%).
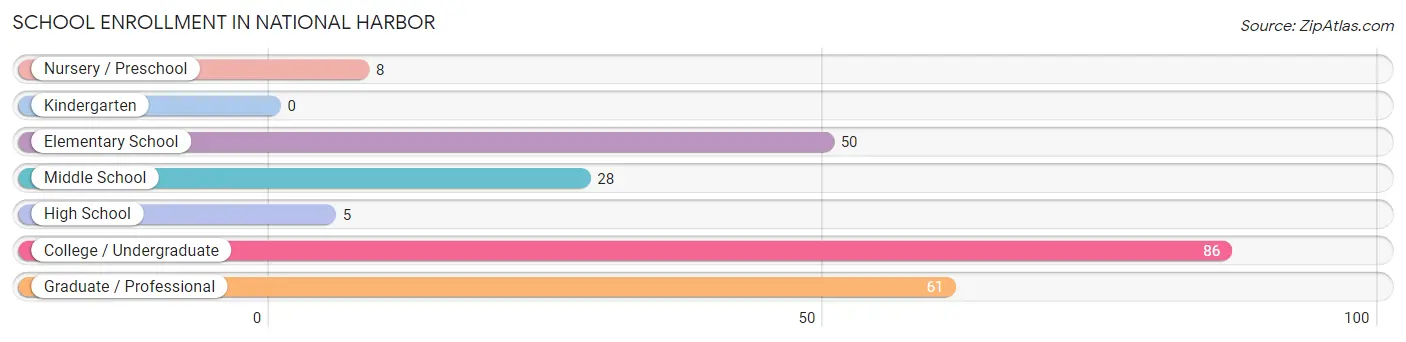
| School Level | # Students | % Students |
| Nursery / Preschool | 8 | 3.4% |
| Kindergarten | 0 | 0.0% |
| Elementary School | 50 | 21.0% |
| Middle School | 28 | 11.8% |
| High School | 5 | 2.1% |
| College / Undergraduate | 86 | 36.1% |
| Graduate / Professional | 61 | 25.6% |
| Total | 238 | 100.0% |
School Enrollment by Age by Funding Source in National Harbor
Out of a total of 238 students who are enrolled in schools in National Harbor, 19 (8.0%) attend a private institution, while the remaining 219 (92.0%) are enrolled in public schools. The age group of 10 to 14 year olds has the highest likelihood of being enrolled in private schools, with 18 (39.1% in the age bracket) enrolled. Conversely, the age group of 5 to 9 year old has the lowest likelihood of being enrolled in a private school, with 40 (100.0% in the age bracket) attending a public institution.
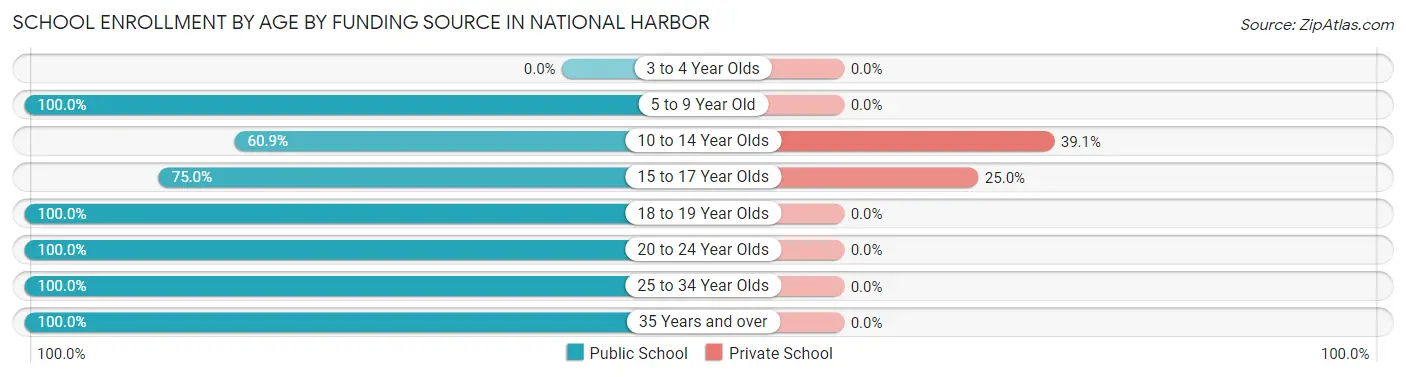
| Age Bracket | Public School | Private School |
| 3 to 4 Year Olds | 0 (0.0%) | 0 (0.0%) |
| 5 to 9 Year Old | 40 (100.0%) | 0 (0.0%) |
| 10 to 14 Year Olds | 28 (60.9%) | 18 (39.1%) |
| 15 to 17 Year Olds | 3 (75.0%) | 1 (25.0%) |
| 18 to 19 Year Olds | 1 (100.0%) | 0 (0.0%) |
| 20 to 24 Year Olds | 86 (100.0%) | 0 (0.0%) |
| 25 to 34 Year Olds | 33 (100.0%) | 0 (0.0%) |
| 35 Years and over | 28 (100.0%) | 0 (0.0%) |
| Total | 219 (92.0%) | 19 (8.0%) |
Educational Attainment by Field of Study in National Harbor
Business (688 | 34.6%), social sciences (304 | 15.3%), arts & humanities (183 | 9.2%), science & technology (133 | 6.7%), and engineering (120 | 6.0%) are the most common fields of study among 1,986 individuals in National Harbor who have obtained a bachelor's degree or higher.
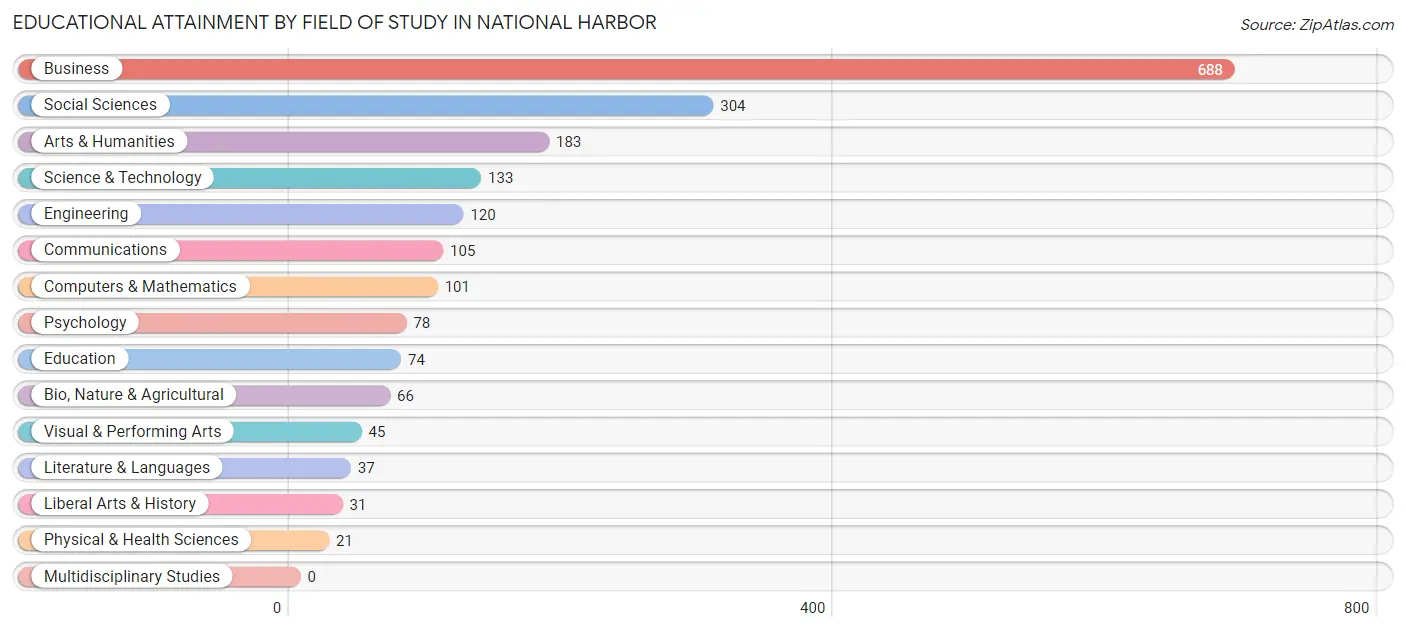
| Field of Study | # Graduates | % Graduates |
| Computers & Mathematics | 101 | 5.1% |
| Bio, Nature & Agricultural | 66 | 3.3% |
| Physical & Health Sciences | 21 | 1.1% |
| Psychology | 78 | 3.9% |
| Social Sciences | 304 | 15.3% |
| Engineering | 120 | 6.0% |
| Multidisciplinary Studies | 0 | 0.0% |
| Science & Technology | 133 | 6.7% |
| Business | 688 | 34.6% |
| Education | 74 | 3.7% |
| Literature & Languages | 37 | 1.9% |
| Liberal Arts & History | 31 | 1.6% |
| Visual & Performing Arts | 45 | 2.3% |
| Communications | 105 | 5.3% |
| Arts & Humanities | 183 | 9.2% |
| Total | 1,986 | 100.0% |
Transportation & Commute in National Harbor
Vehicle Availability by Sex in National Harbor
The most prevalent vehicle ownership categories in National Harbor are males with 2 vehicles (691, accounting for 45.2%) and females with 2 vehicles (634, making up 42.9%).
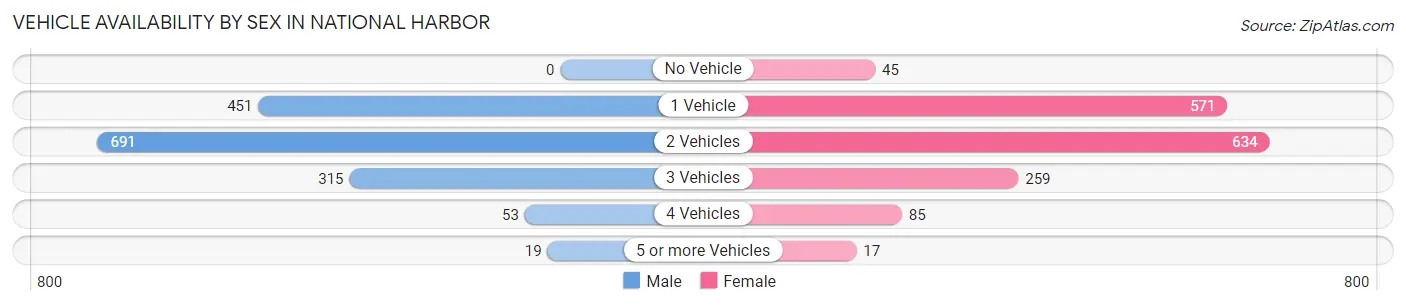
| Vehicles Available | Male | Female |
| No Vehicle | 0 (0.0%) | 45 (2.8%) |
| 1 Vehicle | 451 (29.5%) | 571 (35.4%) |
| 2 Vehicles | 691 (45.2%) | 634 (39.4%) |
| 3 Vehicles | 315 (20.6%) | 259 (16.1%) |
| 4 Vehicles | 53 (3.5%) | 85 (5.3%) |
| 5 or more Vehicles | 19 (1.2%) | 17 (1.1%) |
| Total | 1,529 (100.0%) | 1,611 (100.0%) |
Commute Time in National Harbor
The most frequently occuring commute durations in National Harbor are 30 to 34 minutes (814 commuters, 30.0%), 45 to 59 minutes (452 commuters, 16.7%), and 60 to 89 minutes (375 commuters, 13.8%).
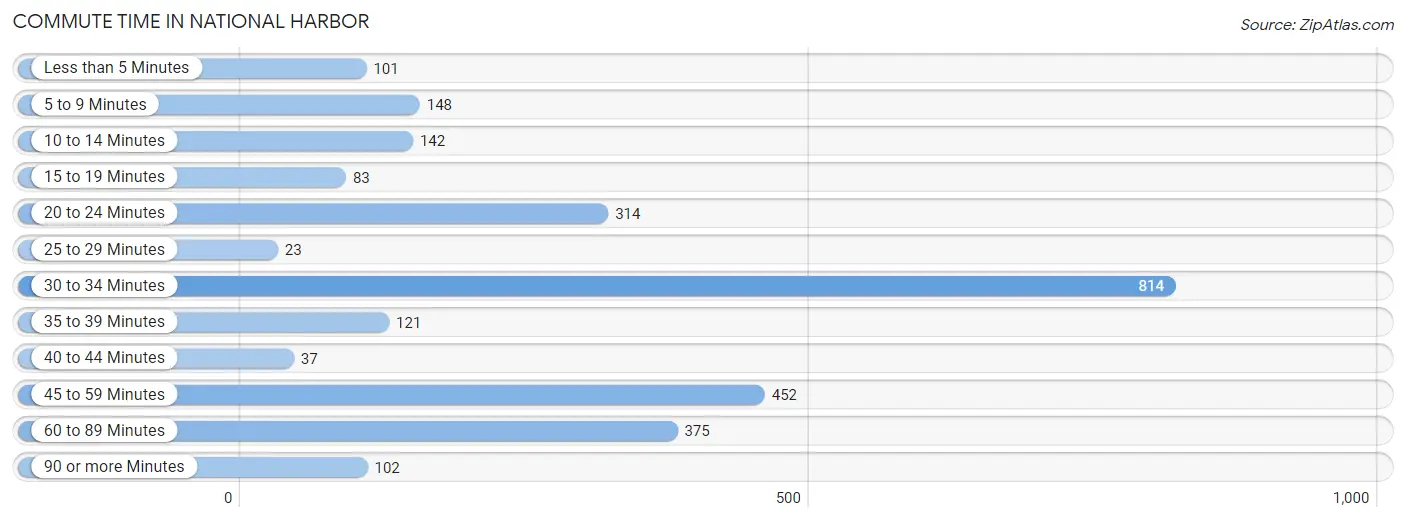
| Commute Time | # Commuters | % Commuters |
| Less than 5 Minutes | 101 | 3.7% |
| 5 to 9 Minutes | 148 | 5.5% |
| 10 to 14 Minutes | 142 | 5.2% |
| 15 to 19 Minutes | 83 | 3.1% |
| 20 to 24 Minutes | 314 | 11.6% |
| 25 to 29 Minutes | 23 | 0.9% |
| 30 to 34 Minutes | 814 | 30.0% |
| 35 to 39 Minutes | 121 | 4.5% |
| 40 to 44 Minutes | 37 | 1.4% |
| 45 to 59 Minutes | 452 | 16.7% |
| 60 to 89 Minutes | 375 | 13.8% |
| 90 or more Minutes | 102 | 3.8% |
Commute Time by Sex in National Harbor
The most common commute times in National Harbor are 30 to 34 minutes (484 commuters, 35.7%) for males and 30 to 34 minutes (330 commuters, 24.3%) for females.
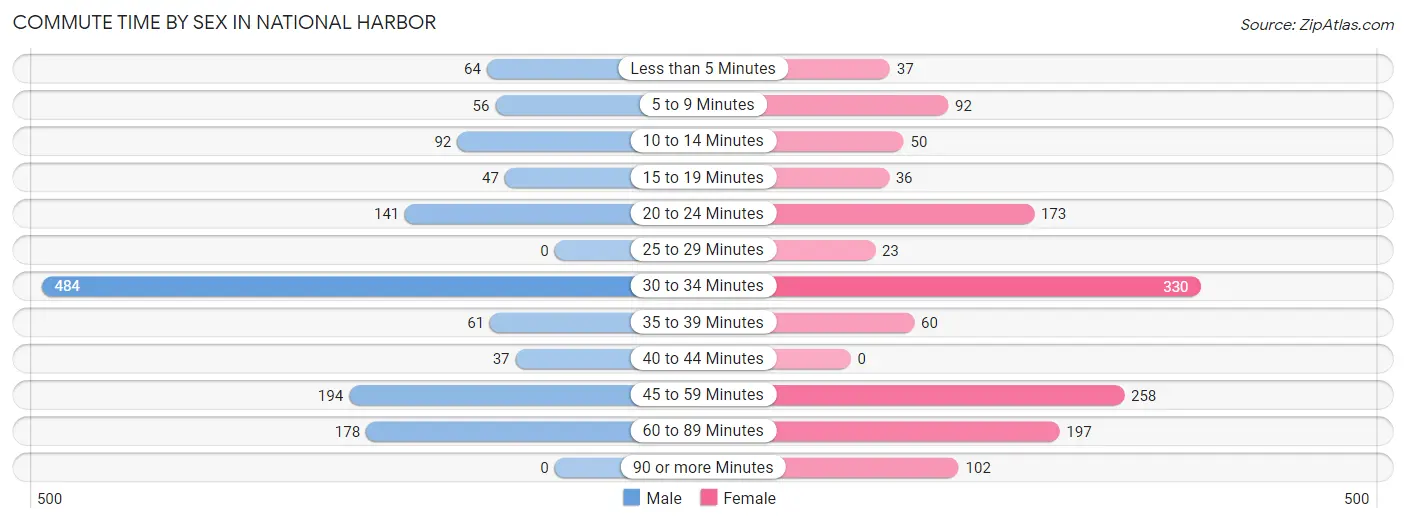
| Commute Time | Male | Female |
| Less than 5 Minutes | 64 (4.7%) | 37 (2.7%) |
| 5 to 9 Minutes | 56 (4.1%) | 92 (6.8%) |
| 10 to 14 Minutes | 92 (6.8%) | 50 (3.7%) |
| 15 to 19 Minutes | 47 (3.5%) | 36 (2.6%) |
| 20 to 24 Minutes | 141 (10.4%) | 173 (12.7%) |
| 25 to 29 Minutes | 0 (0.0%) | 23 (1.7%) |
| 30 to 34 Minutes | 484 (35.7%) | 330 (24.3%) |
| 35 to 39 Minutes | 61 (4.5%) | 60 (4.4%) |
| 40 to 44 Minutes | 37 (2.7%) | 0 (0.0%) |
| 45 to 59 Minutes | 194 (14.3%) | 258 (19.0%) |
| 60 to 89 Minutes | 178 (13.2%) | 197 (14.5%) |
| 90 or more Minutes | 0 (0.0%) | 102 (7.5%) |
Time of Departure to Work by Sex in National Harbor
The most frequent times of departure to work in National Harbor are 6:00 AM to 6:29 AM (300, 22.2%) for males and 7:00 AM to 7:29 AM (309, 22.8%) for females.

| Time of Departure | Male | Female |
| 12:00 AM to 4:59 AM | 28 (2.1%) | 44 (3.2%) |
| 5:00 AM to 5:29 AM | 54 (4.0%) | 209 (15.4%) |
| 5:30 AM to 5:59 AM | 44 (3.3%) | 20 (1.5%) |
| 6:00 AM to 6:29 AM | 300 (22.2%) | 139 (10.2%) |
| 6:30 AM to 6:59 AM | 117 (8.6%) | 75 (5.5%) |
| 7:00 AM to 7:29 AM | 255 (18.8%) | 309 (22.8%) |
| 7:30 AM to 7:59 AM | 141 (10.4%) | 234 (17.2%) |
| 8:00 AM to 8:29 AM | 229 (16.9%) | 124 (9.1%) |
| 8:30 AM to 8:59 AM | 124 (9.2%) | 54 (4.0%) |
| 9:00 AM to 9:59 AM | 25 (1.8%) | 10 (0.7%) |
| 10:00 AM to 10:59 AM | 2 (0.2%) | 23 (1.7%) |
| 11:00 AM to 11:59 AM | 0 (0.0%) | 0 (0.0%) |
| 12:00 PM to 3:59 PM | 32 (2.4%) | 117 (8.6%) |
| 4:00 PM to 11:59 PM | 3 (0.2%) | 0 (0.0%) |
| Total | 1,354 (100.0%) | 1,358 (100.0%) |
Housing Occupancy in National Harbor
Occupancy by Ownership in National Harbor
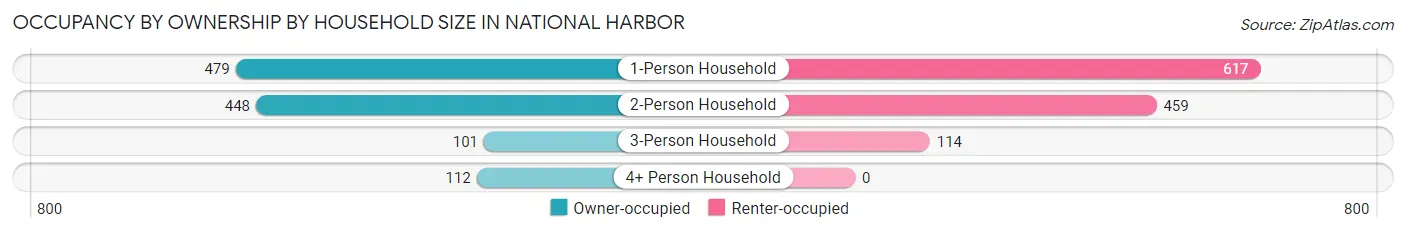
Of the total 2,330 dwellings in National Harbor, owner-occupied units account for 1,140 (48.9%), while renter-occupied units make up 1,190 (51.1%).
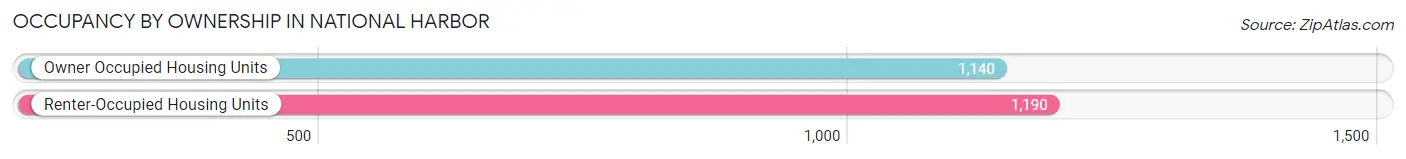
| Occupancy | # Housing Units | % Housing Units |
| Owner Occupied Housing Units | 1,140 | 48.9% |
| Renter-Occupied Housing Units | 1,190 | 51.1% |
| Total Occupied Housing Units | 2,330 | 100.0% |
Occupancy by Household Size in National Harbor
| Household Size | # Housing Units | % Housing Units |
| 1-Person Household | 1,096 | 47.0% |
| 2-Person Household | 907 | 38.9% |
| 3-Person Household | 215 | 9.2% |
| 4+ Person Household | 112 | 4.8% |
| Total Housing Units | 2,330 | 100.0% |
Occupancy by Ownership by Household Size in National Harbor
| Household Size | Owner-occupied | Renter-occupied |
| 1-Person Household | 479 (43.7%) | 617 (56.3%) |
| 2-Person Household | 448 (49.4%) | 459 (50.6%) |
| 3-Person Household | 101 (47.0%) | 114 (53.0%) |
| 4+ Person Household | 112 (100.0%) | 0 (0.0%) |
| Total Housing Units | 1,140 (48.9%) | 1,190 (51.1%) |
Occupancy by Educational Attainment in National Harbor
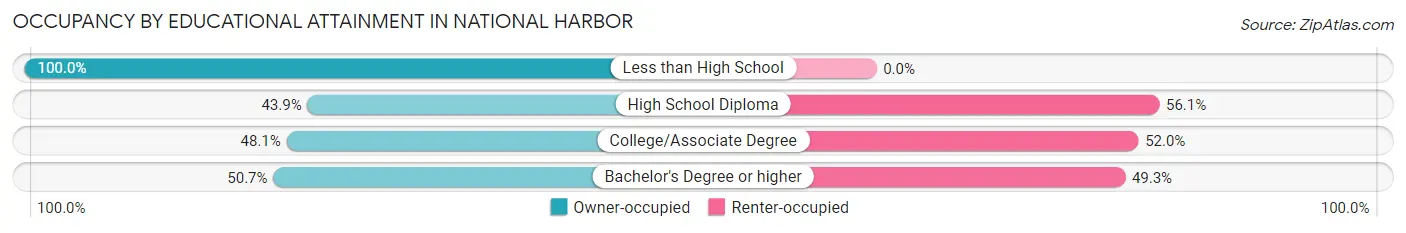
| Household Size | Owner-occupied | Renter-occupied |
| Less than High School | 13 (100.0%) | 0 (0.0%) |
| High School Diploma | 202 (43.9%) | 258 (56.1%) |
| College/Associate Degree | 296 (48.0%) | 320 (51.9%) |
| Bachelor's Degree or higher | 629 (50.7%) | 612 (49.3%) |
Occupancy by Age of Householder in National Harbor
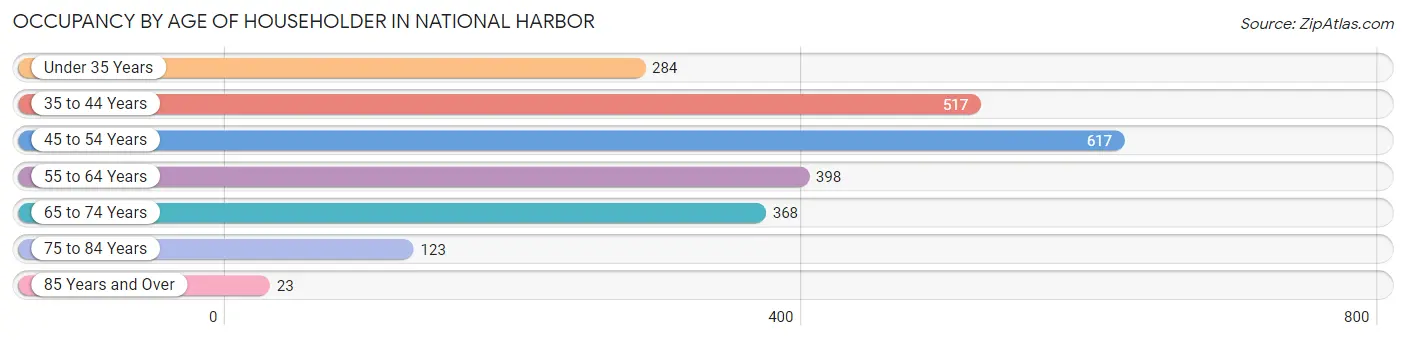
| Age Bracket | # Households | % Households |
| Under 35 Years | 284 | 12.2% |
| 35 to 44 Years | 517 | 22.2% |
| 45 to 54 Years | 617 | 26.5% |
| 55 to 64 Years | 398 | 17.1% |
| 65 to 74 Years | 368 | 15.8% |
| 75 to 84 Years | 123 | 5.3% |
| 85 Years and Over | 23 | 1.0% |
| Total | 2,330 | 100.0% |
Housing Finances in National Harbor
Median Income by Occupancy in National Harbor
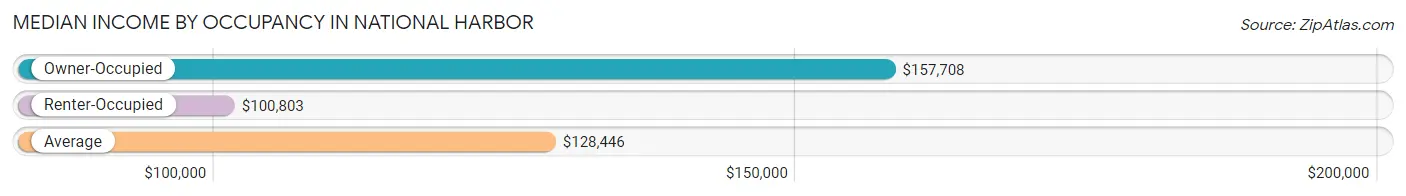
| Occupancy Type | # Households | Median Income |
| Owner-Occupied | 1,140 (48.9%) | $157,708 |
| Renter-Occupied | 1,190 (51.1%) | $100,803 |
| Average | 2,330 (100.0%) | $128,446 |
Occupancy by Householder Income Bracket in National Harbor
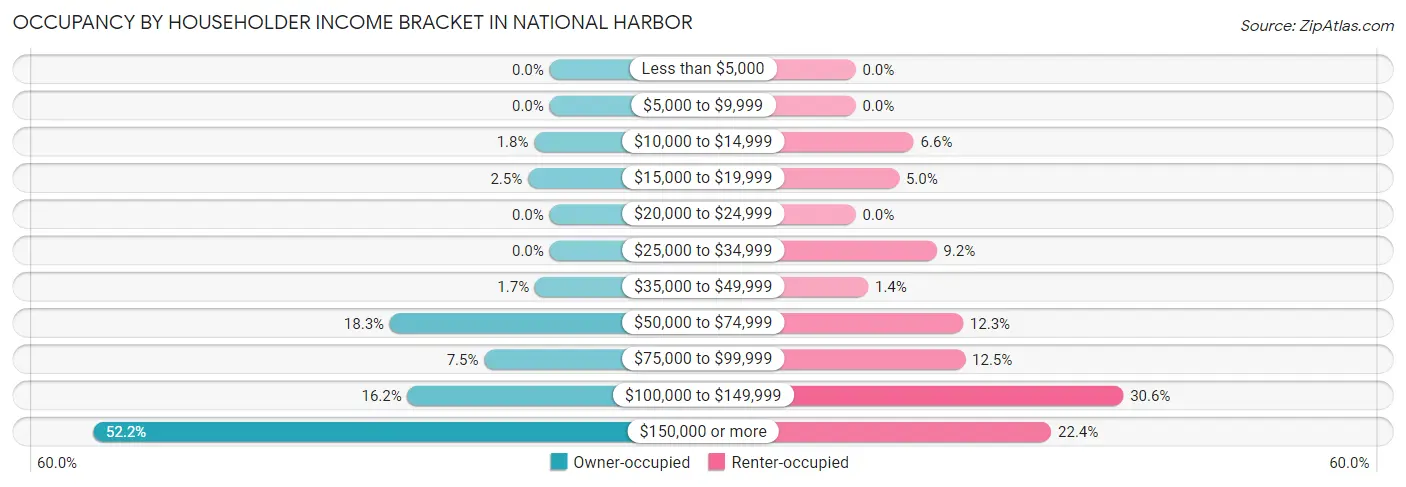
| Income Bracket | Owner-occupied | Renter-occupied |
| Less than $5,000 | 0 (0.0%) | 0 (0.0%) |
| $5,000 to $9,999 | 0 (0.0%) | 0 (0.0%) |
| $10,000 to $14,999 | 20 (1.8%) | 79 (6.6%) |
| $15,000 to $19,999 | 28 (2.5%) | 59 (5.0%) |
| $20,000 to $24,999 | 0 (0.0%) | 0 (0.0%) |
| $25,000 to $34,999 | 0 (0.0%) | 110 (9.2%) |
| $35,000 to $49,999 | 19 (1.7%) | 17 (1.4%) |
| $50,000 to $74,999 | 208 (18.2%) | 146 (12.3%) |
| $75,000 to $99,999 | 85 (7.5%) | 149 (12.5%) |
| $100,000 to $149,999 | 185 (16.2%) | 364 (30.6%) |
| $150,000 or more | 595 (52.2%) | 266 (22.4%) |
| Total | 1,140 (100.0%) | 1,190 (100.0%) |
Monthly Housing Cost Tiers in National Harbor
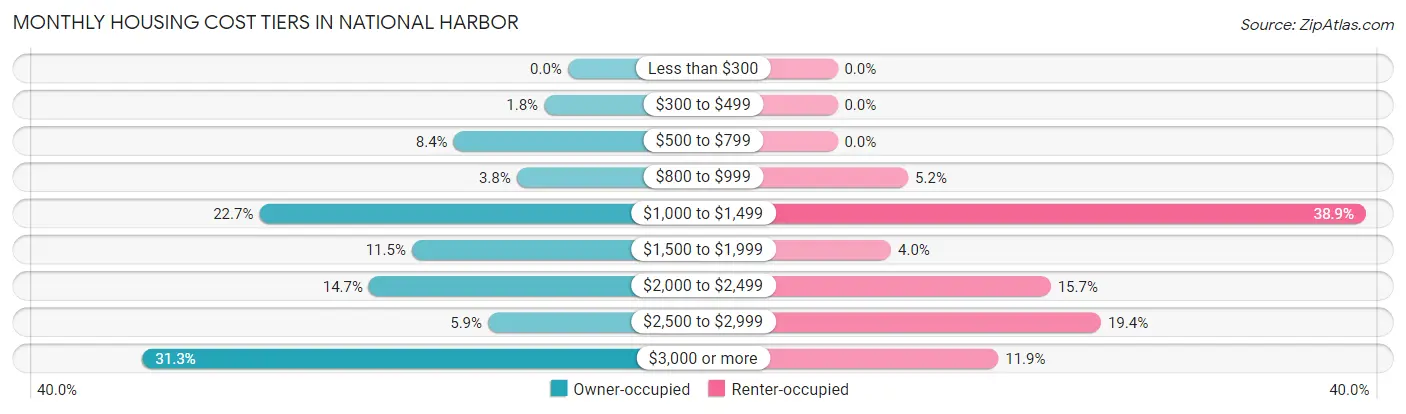
| Monthly Cost | Owner-occupied | Renter-occupied |
| Less than $300 | 0 (0.0%) | 0 (0.0%) |
| $300 to $499 | 20 (1.8%) | 0 (0.0%) |
| $500 to $799 | 96 (8.4%) | 0 (0.0%) |
| $800 to $999 | 43 (3.8%) | 62 (5.2%) |
| $1,000 to $1,499 | 259 (22.7%) | 463 (38.9%) |
| $1,500 to $1,999 | 131 (11.5%) | 47 (4.0%) |
| $2,000 to $2,499 | 167 (14.6%) | 187 (15.7%) |
| $2,500 to $2,999 | 67 (5.9%) | 231 (19.4%) |
| $3,000 or more | 357 (31.3%) | 141 (11.8%) |
| Total | 1,140 (100.0%) | 1,190 (100.0%) |
Physical Housing Characteristics in National Harbor
Housing Structures in National Harbor
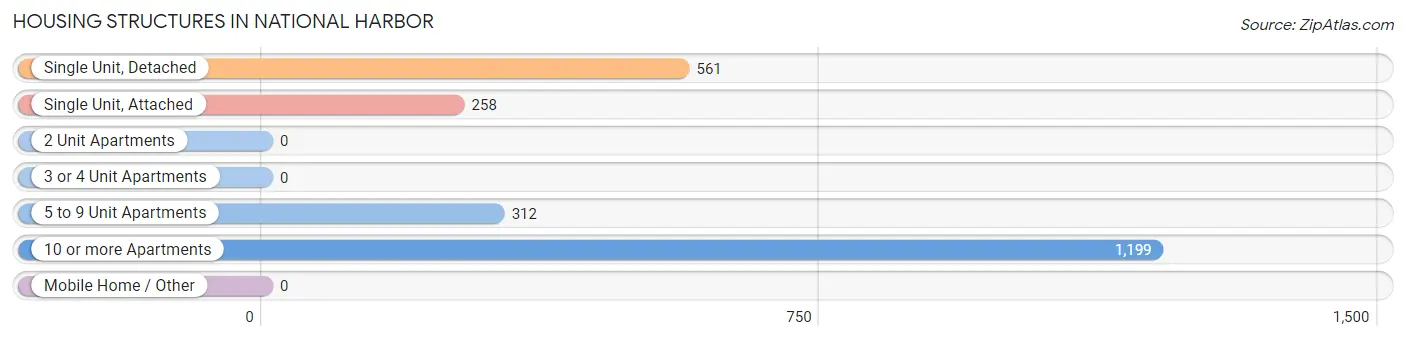
| Structure Type | # Housing Units | % Housing Units |
| Single Unit, Detached | 561 | 24.1% |
| Single Unit, Attached | 258 | 11.1% |
| 2 Unit Apartments | 0 | 0.0% |
| 3 or 4 Unit Apartments | 0 | 0.0% |
| 5 to 9 Unit Apartments | 312 | 13.4% |
| 10 or more Apartments | 1,199 | 51.5% |
| Mobile Home / Other | 0 | 0.0% |
| Total | 2,330 | 100.0% |
Housing Structures by Occupancy in National Harbor
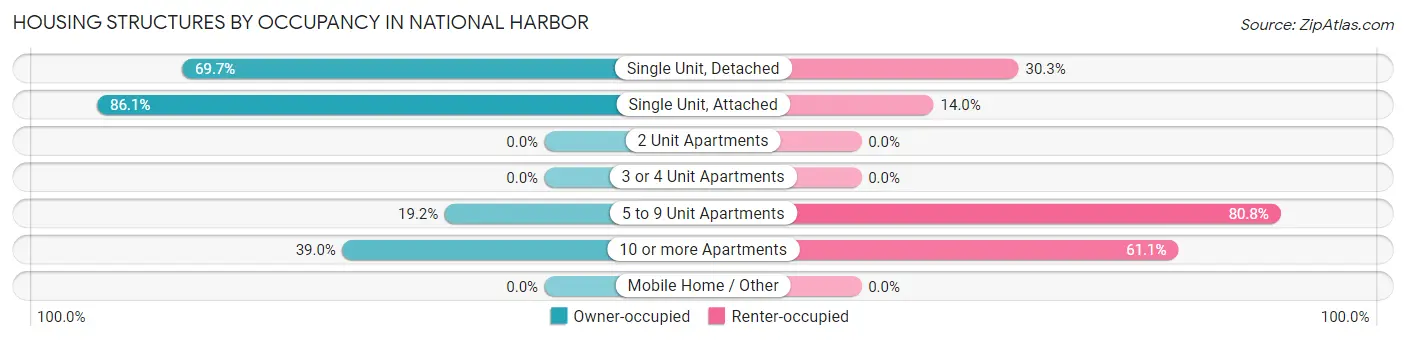
| Structure Type | Owner-occupied | Renter-occupied |
| Single Unit, Detached | 391 (69.7%) | 170 (30.3%) |
| Single Unit, Attached | 222 (86.1%) | 36 (14.0%) |
| 2 Unit Apartments | 0 (0.0%) | 0 (0.0%) |
| 3 or 4 Unit Apartments | 0 (0.0%) | 0 (0.0%) |
| 5 to 9 Unit Apartments | 60 (19.2%) | 252 (80.8%) |
| 10 or more Apartments | 467 (39.0%) | 732 (61.1%) |
| Mobile Home / Other | 0 (0.0%) | 0 (0.0%) |
| Total | 1,140 (48.9%) | 1,190 (51.1%) |
Housing Structures by Number of Rooms in National Harbor
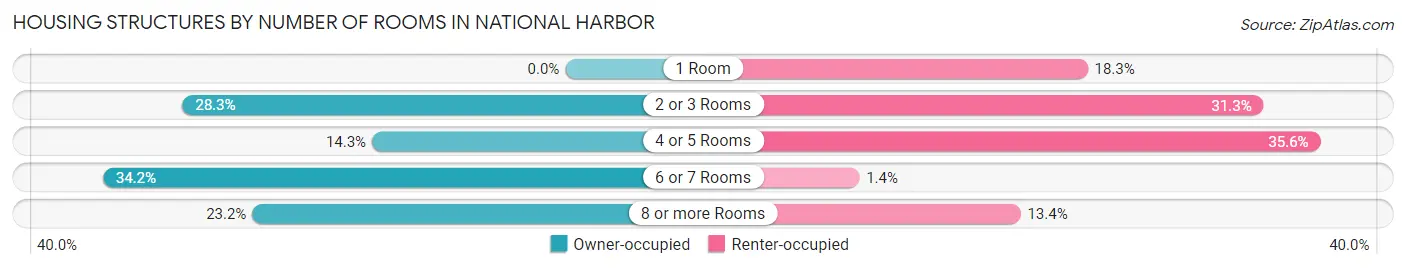
| Number of Rooms | Owner-occupied | Renter-occupied |
| 1 Room | 0 (0.0%) | 218 (18.3%) |
| 2 or 3 Rooms | 323 (28.3%) | 373 (31.3%) |
| 4 or 5 Rooms | 163 (14.3%) | 423 (35.5%) |
| 6 or 7 Rooms | 390 (34.2%) | 17 (1.4%) |
| 8 or more Rooms | 264 (23.2%) | 159 (13.4%) |
| Total | 1,140 (100.0%) | 1,190 (100.0%) |
Housing Structure by Heating Type in National Harbor
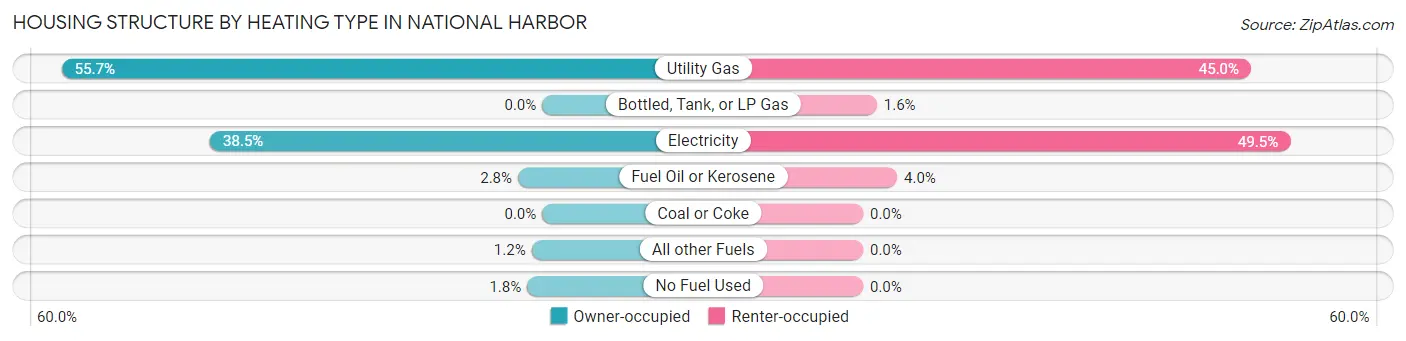
| Heating Type | Owner-occupied | Renter-occupied |
| Utility Gas | 635 (55.7%) | 535 (45.0%) |
| Bottled, Tank, or LP Gas | 0 (0.0%) | 19 (1.6%) |
| Electricity | 439 (38.5%) | 589 (49.5%) |
| Fuel Oil or Kerosene | 32 (2.8%) | 47 (4.0%) |
| Coal or Coke | 0 (0.0%) | 0 (0.0%) |
| All other Fuels | 14 (1.2%) | 0 (0.0%) |
| No Fuel Used | 20 (1.8%) | 0 (0.0%) |
| Total | 1,140 (100.0%) | 1,190 (100.0%) |
Household Vehicle Usage in National Harbor
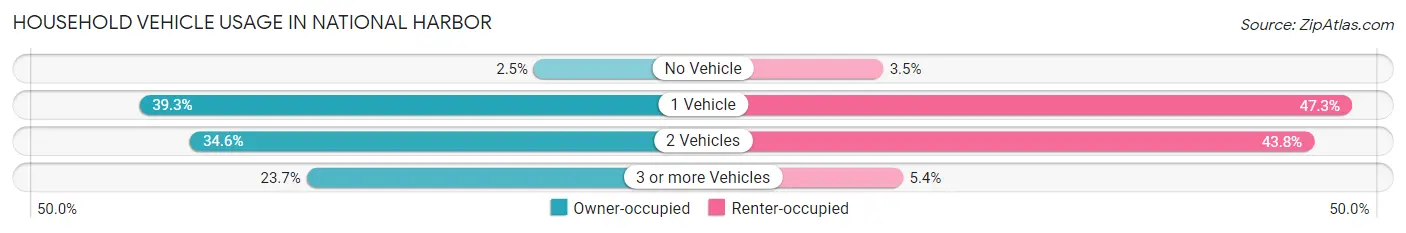
| Vehicles per Household | Owner-occupied | Renter-occupied |
| No Vehicle | 28 (2.5%) | 42 (3.5%) |
| 1 Vehicle | 448 (39.3%) | 563 (47.3%) |
| 2 Vehicles | 394 (34.6%) | 521 (43.8%) |
| 3 or more Vehicles | 270 (23.7%) | 64 (5.4%) |
| Total | 1,140 (100.0%) | 1,190 (100.0%) |
Real Estate & Mortgages in National Harbor
Real Estate and Mortgage Overview in National Harbor
| Characteristic | Without Mortgage | With Mortgage |
| Housing Units | 282 | 858 |
| Median Property Value | $312,400 | $455,400 |
| Median Household Income | $202,542 | $418 |
| Monthly Housing Costs | $881 | $357 |
| Real Estate Taxes | $3,390 | $18 |
Property Value by Mortgage Status in National Harbor
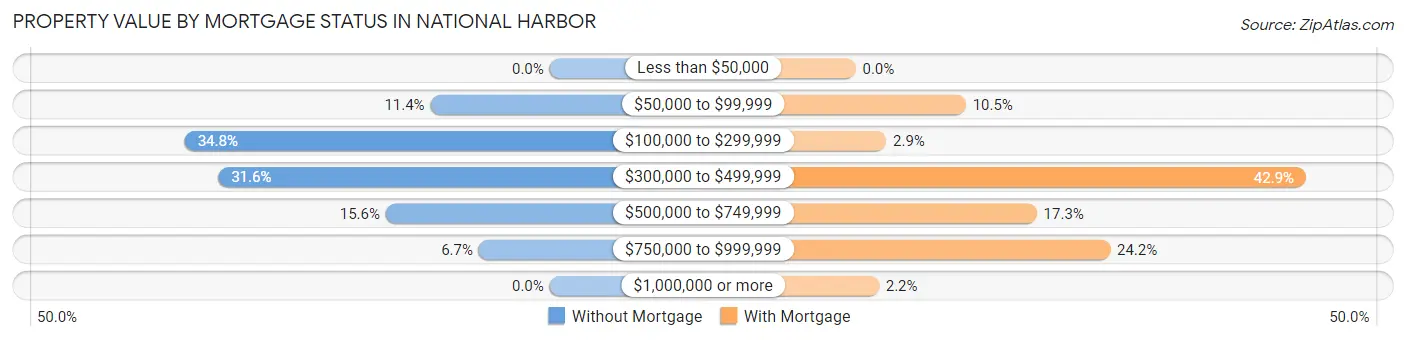
| Property Value | Without Mortgage | With Mortgage |
| Less than $50,000 | 0 (0.0%) | 0 (0.0%) |
| $50,000 to $99,999 | 32 (11.4%) | 90 (10.5%) |
| $100,000 to $299,999 | 98 (34.7%) | 25 (2.9%) |
| $300,000 to $499,999 | 89 (31.6%) | 368 (42.9%) |
| $500,000 to $749,999 | 44 (15.6%) | 148 (17.2%) |
| $750,000 to $999,999 | 19 (6.7%) | 208 (24.2%) |
| $1,000,000 or more | 0 (0.0%) | 19 (2.2%) |
| Total | 282 (100.0%) | 858 (100.0%) |
Household Income by Mortgage Status in National Harbor
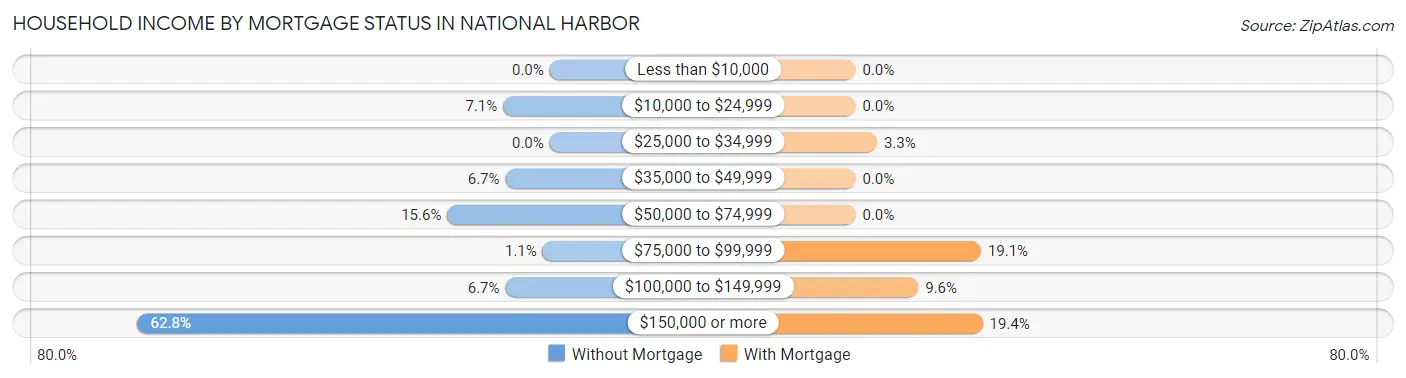
| Household Income | Without Mortgage | With Mortgage |
| Less than $10,000 | 0 (0.0%) | 0 (0.0%) |
| $10,000 to $24,999 | 20 (7.1%) | 0 (0.0%) |
| $25,000 to $34,999 | 0 (0.0%) | 28 (3.3%) |
| $35,000 to $49,999 | 19 (6.7%) | 0 (0.0%) |
| $50,000 to $74,999 | 44 (15.6%) | 0 (0.0%) |
| $75,000 to $99,999 | 3 (1.1%) | 164 (19.1%) |
| $100,000 to $149,999 | 19 (6.7%) | 82 (9.6%) |
| $150,000 or more | 177 (62.8%) | 166 (19.4%) |
| Total | 282 (100.0%) | 858 (100.0%) |
Property Value to Household Income Ratio in National Harbor
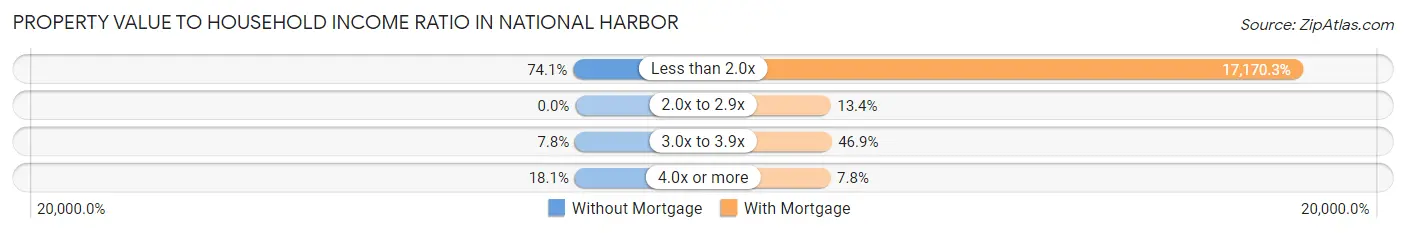
| Value-to-Income Ratio | Without Mortgage | With Mortgage |
| Less than 2.0x | 209 (74.1%) | 147,321 (17,170.3%) |
| 2.0x to 2.9x | 0 (0.0%) | 115 (13.4%) |
| 3.0x to 3.9x | 22 (7.8%) | 402 (46.9%) |
| 4.0x or more | 51 (18.1%) | 67 (7.8%) |
| Total | 282 (100.0%) | 858 (100.0%) |
Real Estate Taxes by Mortgage Status in National Harbor
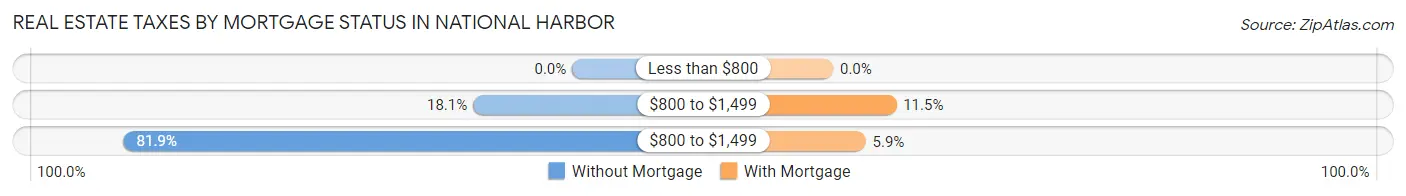
| Property Taxes | Without Mortgage | With Mortgage |
| Less than $800 | 0 (0.0%) | 0 (0.0%) |
| $800 to $1,499 | 51 (18.1%) | 99 (11.5%) |
| $800 to $1,499 | 231 (81.9%) | 51 (5.9%) |
| Total | 282 (100.0%) | 858 (100.0%) |
Health & Disability in National Harbor
Health Insurance Coverage by Age in National Harbor
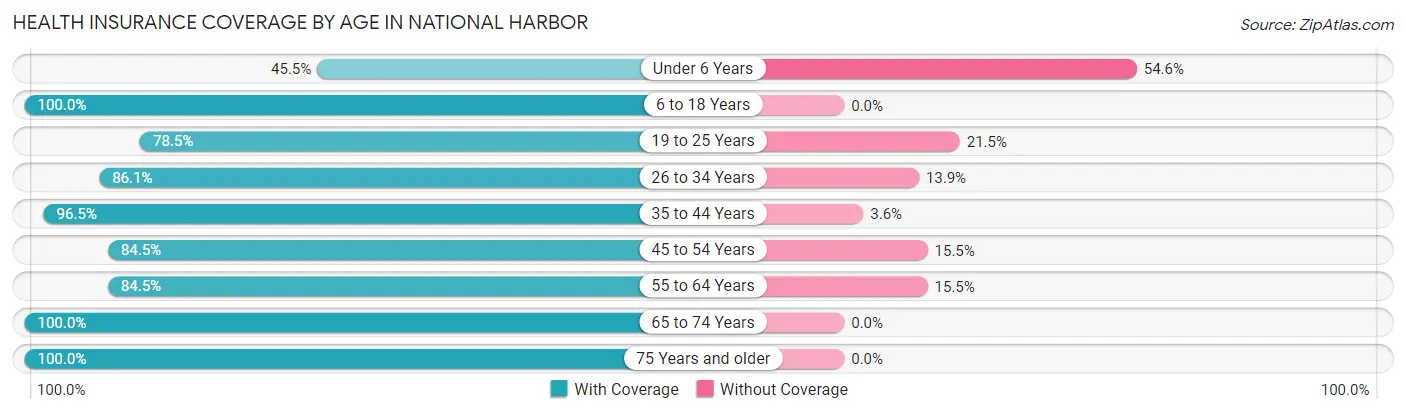
| Age Bracket | With Coverage | Without Coverage |
| Under 6 Years | 55 (45.5%) | 66 (54.5%) |
| 6 to 18 Years | 81 (100.0%) | 0 (0.0%) |
| 19 to 25 Years | 193 (78.5%) | 53 (21.5%) |
| 26 to 34 Years | 575 (86.1%) | 93 (13.9%) |
| 35 to 44 Years | 680 (96.5%) | 25 (3.5%) |
| 45 to 54 Years | 734 (84.5%) | 135 (15.5%) |
| 55 to 64 Years | 647 (84.5%) | 119 (15.5%) |
| 65 to 74 Years | 559 (100.0%) | 0 (0.0%) |
| 75 Years and older | 205 (100.0%) | 0 (0.0%) |
| Total | 3,729 (88.4%) | 491 (11.6%) |
Health Insurance Coverage by Citizenship Status in National Harbor
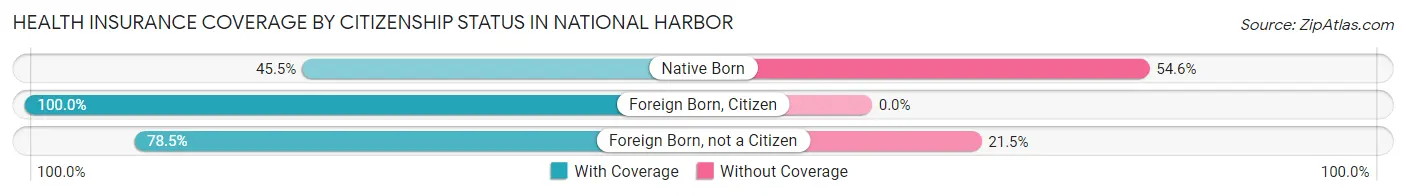
| Citizenship Status | With Coverage | Without Coverage |
| Native Born | 55 (45.5%) | 66 (54.5%) |
| Foreign Born, Citizen | 81 (100.0%) | 0 (0.0%) |
| Foreign Born, not a Citizen | 193 (78.5%) | 53 (21.5%) |
Health Insurance Coverage by Household Income in National Harbor
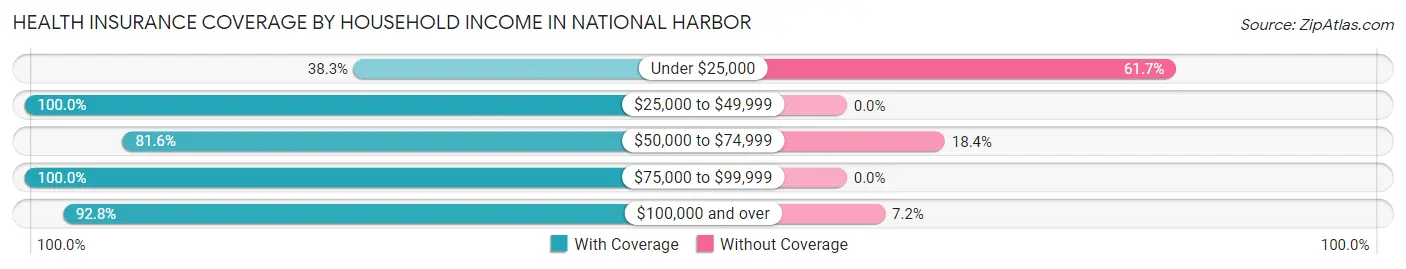
| Household Income | With Coverage | Without Coverage |
| Under $25,000 | 126 (38.3%) | 203 (61.7%) |
| $25,000 to $49,999 | 230 (100.0%) | 0 (0.0%) |
| $50,000 to $74,999 | 400 (81.6%) | 90 (18.4%) |
| $75,000 to $99,999 | 403 (100.0%) | 0 (0.0%) |
| $100,000 and over | 2,561 (92.8%) | 198 (7.2%) |
Public vs Private Health Insurance Coverage by Age in National Harbor
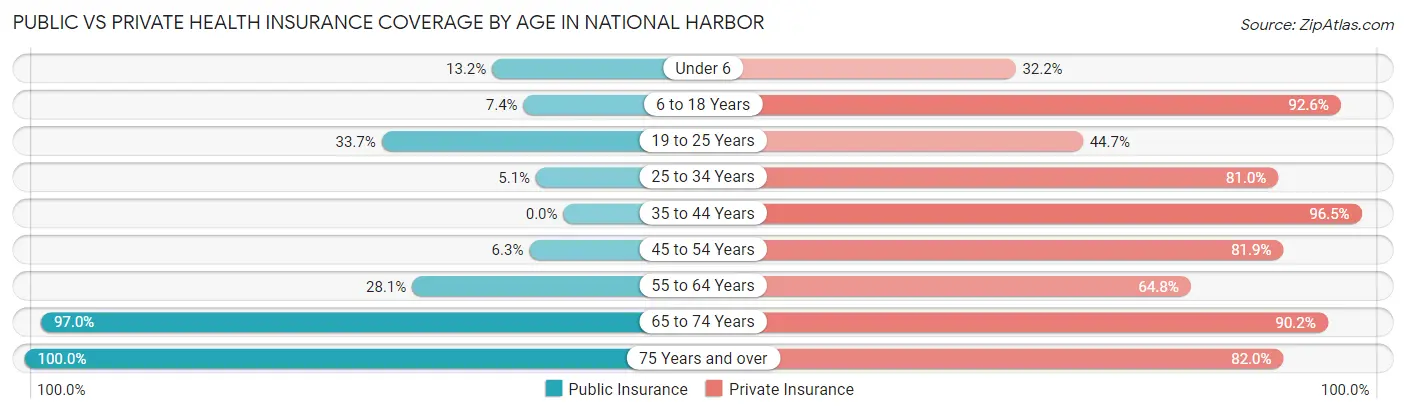
| Age Bracket | Public Insurance | Private Insurance |
| Under 6 | 16 (13.2%) | 39 (32.2%) |
| 6 to 18 Years | 6 (7.4%) | 75 (92.6%) |
| 19 to 25 Years | 83 (33.7%) | 110 (44.7%) |
| 25 to 34 Years | 34 (5.1%) | 541 (81.0%) |
| 35 to 44 Years | 0 (0.0%) | 680 (96.5%) |
| 45 to 54 Years | 55 (6.3%) | 712 (81.9%) |
| 55 to 64 Years | 215 (28.1%) | 496 (64.7%) |
| 65 to 74 Years | 542 (97.0%) | 504 (90.2%) |
| 75 Years and over | 205 (100.0%) | 168 (82.0%) |
| Total | 1,156 (27.4%) | 3,325 (78.8%) |
Disability Status by Sex by Age in National Harbor
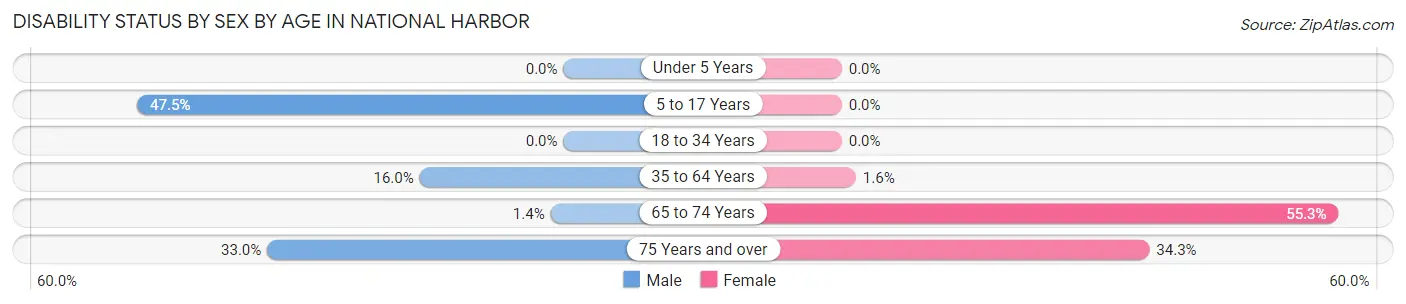
| Age Bracket | Male | Female |
| Under 5 Years | 0 (0.0%) | 0 (0.0%) |
| 5 to 17 Years | 28 (47.5%) | 0 (0.0%) |
| 18 to 34 Years | 0 (0.0%) | 0 (0.0%) |
| 35 to 64 Years | 201 (16.0%) | 17 (1.6%) |
| 65 to 74 Years | 3 (1.4%) | 193 (55.3%) |
| 75 Years and over | 32 (33.0%) | 37 (34.3%) |
Disability Class by Sex by Age in National Harbor
Disability Class: Hearing Difficulty
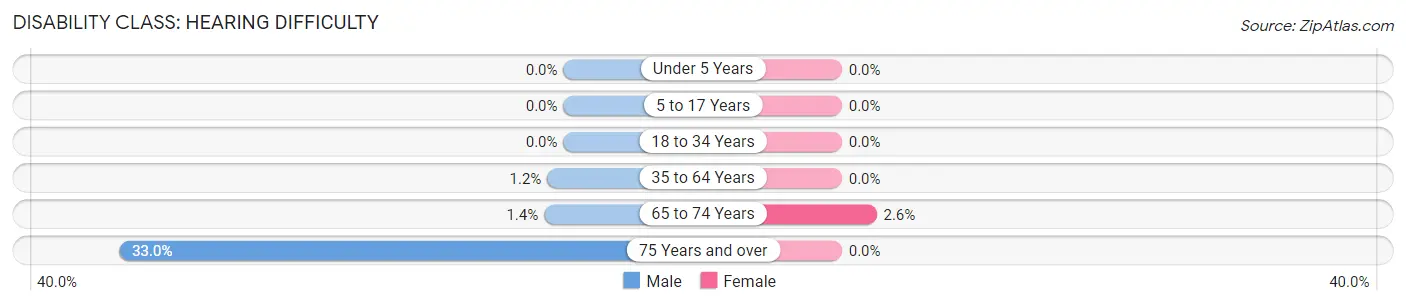
| Age Bracket | Male | Female |
| Under 5 Years | 0 (0.0%) | 0 (0.0%) |
| 5 to 17 Years | 0 (0.0%) | 0 (0.0%) |
| 18 to 34 Years | 0 (0.0%) | 0 (0.0%) |
| 35 to 64 Years | 15 (1.2%) | 0 (0.0%) |
| 65 to 74 Years | 3 (1.4%) | 9 (2.6%) |
| 75 Years and over | 32 (33.0%) | 0 (0.0%) |
Disability Class: Vision Difficulty
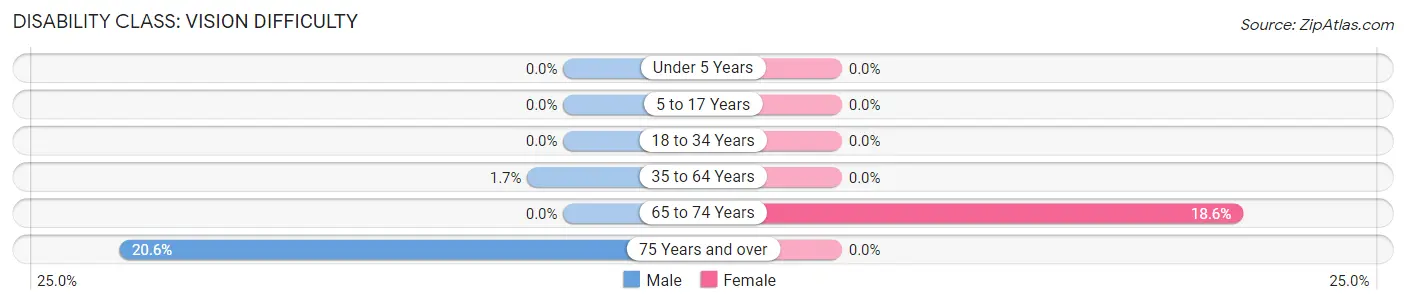
| Age Bracket | Male | Female |
| Under 5 Years | 0 (0.0%) | 0 (0.0%) |
| 5 to 17 Years | 0 (0.0%) | 0 (0.0%) |
| 18 to 34 Years | 0 (0.0%) | 0 (0.0%) |
| 35 to 64 Years | 21 (1.7%) | 0 (0.0%) |
| 65 to 74 Years | 0 (0.0%) | 65 (18.6%) |
| 75 Years and over | 20 (20.6%) | 0 (0.0%) |
Disability Class: Cognitive Difficulty
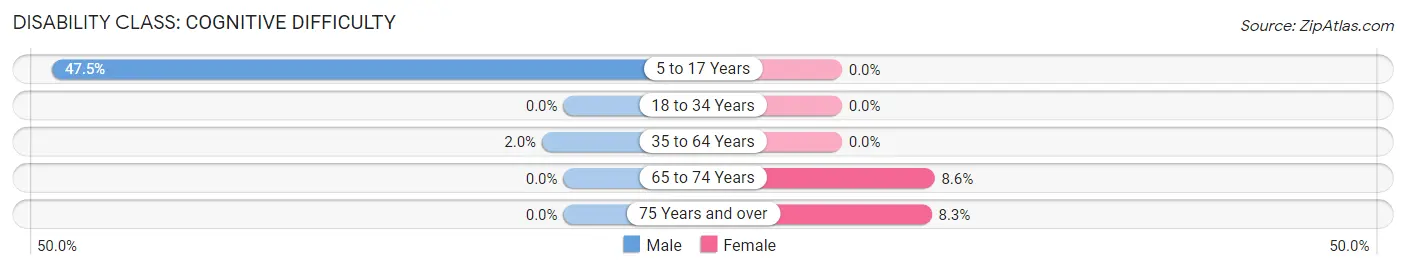
| Age Bracket | Male | Female |
| 5 to 17 Years | 28 (47.5%) | 0 (0.0%) |
| 18 to 34 Years | 0 (0.0%) | 0 (0.0%) |
| 35 to 64 Years | 25 (2.0%) | 0 (0.0%) |
| 65 to 74 Years | 0 (0.0%) | 30 (8.6%) |
| 75 Years and over | 0 (0.0%) | 9 (8.3%) |
Disability Class: Ambulatory Difficulty
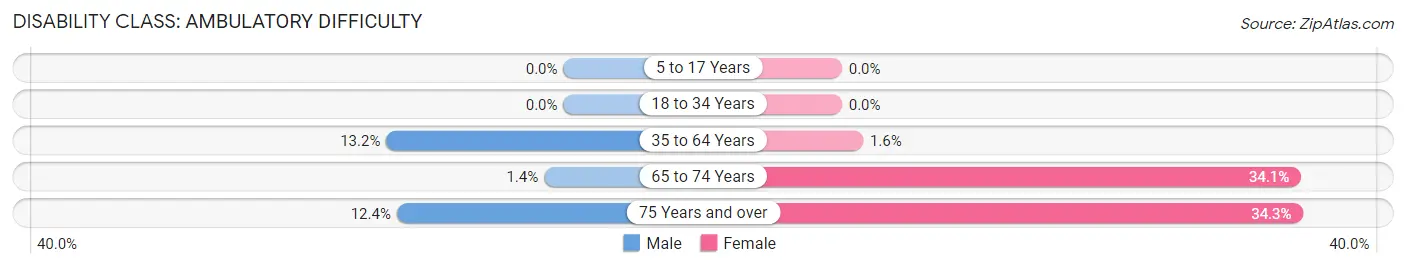
| Age Bracket | Male | Female |
| 5 to 17 Years | 0 (0.0%) | 0 (0.0%) |
| 18 to 34 Years | 0 (0.0%) | 0 (0.0%) |
| 35 to 64 Years | 165 (13.2%) | 17 (1.6%) |
| 65 to 74 Years | 3 (1.4%) | 119 (34.1%) |
| 75 Years and over | 12 (12.4%) | 37 (34.3%) |
Disability Class: Self-Care Difficulty
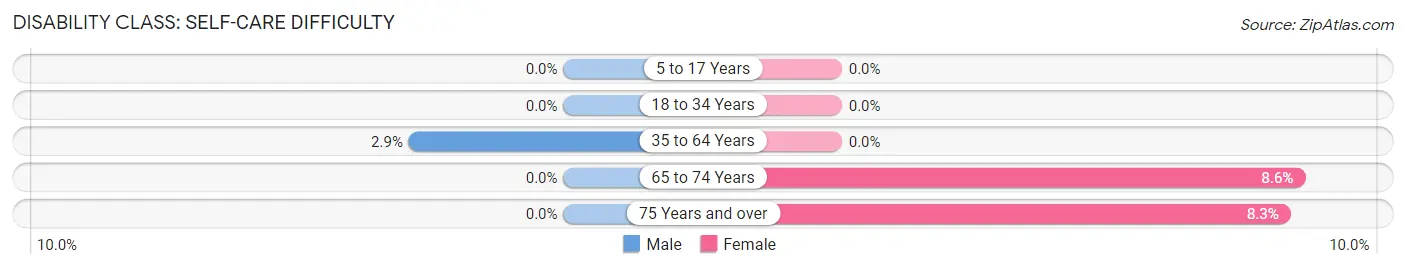
| Age Bracket | Male | Female |
| 5 to 17 Years | 0 (0.0%) | 0 (0.0%) |
| 18 to 34 Years | 0 (0.0%) | 0 (0.0%) |
| 35 to 64 Years | 36 (2.9%) | 0 (0.0%) |
| 65 to 74 Years | 0 (0.0%) | 30 (8.6%) |
| 75 Years and over | 0 (0.0%) | 9 (8.3%) |
Technology Access in National Harbor
Computing Device Access in National Harbor
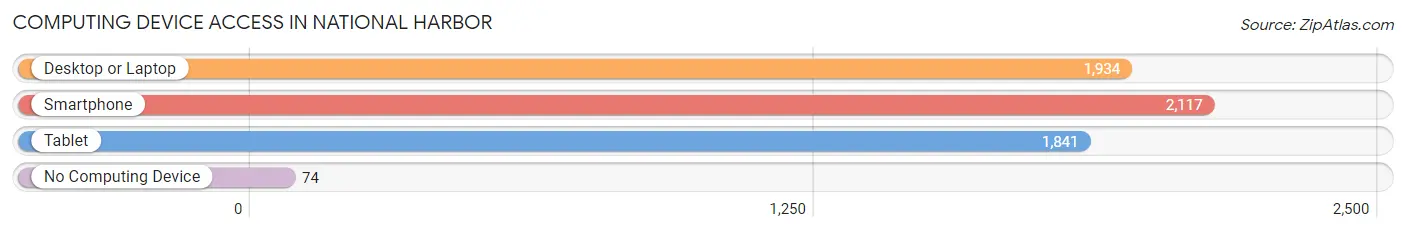
| Device Type | # Households | % Households |
| Desktop or Laptop | 1,934 | 83.0% |
| Smartphone | 2,117 | 90.9% |
| Tablet | 1,841 | 79.0% |
| No Computing Device | 74 | 3.2% |
| Total | 2,330 | 100.0% |
Internet Access in National Harbor
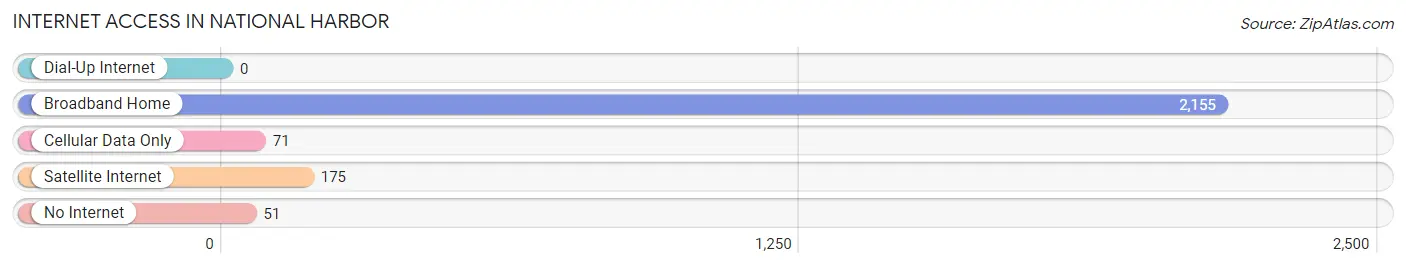
| Internet Type | # Households | % Households |
| Dial-Up Internet | 0 | 0.0% |
| Broadband Home | 2,155 | 92.5% |
| Cellular Data Only | 71 | 3.0% |
| Satellite Internet | 175 | 7.5% |
| No Internet | 51 | 2.2% |
| Total | 2,330 | 100.0% |
National Harbor Summary
History
National Harbor is a waterfront development located in Prince George’s County, Maryland, just south of Washington, D.C. The area was originally part of the Potomac River, but was filled in during the late 19th century to create a new port. The area was first developed in the early 20th century as a resort destination, with the opening of the National Hotel in 1908. The hotel was a popular destination for tourists and locals alike, and the area soon became known as “National Harbor.”
In the 1950s, the area began to decline as the popularity of the resort waned. The area was largely abandoned until the late 1990s, when the Peterson Companies began to develop the area into a mixed-use waterfront destination. The Peterson Companies purchased the land in 1997 and began to develop the area into a destination for shopping, dining, entertainment, and residential living. The development was completed in 2008, and the area has since become a popular destination for tourists and locals alike.
Geography
National Harbor is located in Prince George’s County, Maryland, just south of Washington, D.C. The area is situated on the Potomac River, and is bordered by the Woodrow Wilson Bridge to the north and the Capital Beltway to the south. The area is approximately 2.5 miles long and 1.5 miles wide, and is home to a variety of attractions, including the Gaylord National Resort and Convention Center, the Tanger Outlets, and the National Harbor Marina.
Economy
National Harbor is a major economic hub for the region, with a variety of businesses and attractions. The area is home to the Gaylord National Resort and Convention Center, which is the largest hotel and convention center in the Washington, D.C. area. The area is also home to the Tanger Outlets, which is a popular shopping destination for locals and tourists alike. Additionally, the area is home to a variety of restaurants, bars, and entertainment venues.
The area is also home to a variety of businesses, including the National Harbor Business Association, which is a non-profit organization that works to promote economic development in the area. Additionally, the area is home to a variety of government offices, including the U.S. Department of Homeland Security, the U.S. Coast Guard, and the U.S. Customs and Border Protection.
Demographics
As of the 2010 census, the population of National Harbor was 2,845. The population is largely African American, with a median age of 36. The median household income is $68,945, and the median home value is $521,000. The area is home to a variety of businesses, including restaurants, bars, and entertainment venues. Additionally, the area is home to a variety of government offices, including the U.S. Department of Homeland Security, the U.S. Coast Guard, and the U.S. Customs and Border Protection.
Common Questions
What is the Total Population of National Harbor?
Total Population of National Harbor is 4,268.
What is the Total Male Population of National Harbor?
Total Male Population of National Harbor is 2,017.
What is the Total Female Population of National Harbor?
Total Female Population of National Harbor is 2,251.
What is the Ratio of Males per 100 Females in National Harbor?
There are 89.60 Males per 100 Females in National Harbor.
What is the Ratio of Females per 100 Males in National Harbor?
There are 111.60 Females per 100 Males in National Harbor.
What is the Median Population Age in National Harbor?
Median Population Age in National Harbor is 48.9 Years.
What is the Average Family Size in National Harbor
Average Family Size in National Harbor is 2.6 People.
What is the Average Household Size in National Harbor
Average Household Size in National Harbor is 1.8 People.
What is Per Capita Income in National Harbor?
Per Capita income in National Harbor is $80,048.
What is the Median Family Income in National Harbor?
Median Family Income in National Harbor is $157,793.
What is the Median Household income in National Harbor?
Median Household Income in National Harbor is $128,446.
What is Income or Wage Gap in National Harbor?
Income or Wage Gap in National Harbor is 12.6%.
Women in National Harbor earn 87.4 cents for every dollar earned by a man.
What is Inequality or Gini Index in National Harbor?
Inequality or Gini Index in National Harbor is 0.40.
How Large is the Labor Force in National Harbor?
There are 3,267 People in the Labor Forcein in National Harbor.
What is the Percentage of People in the Labor Force in National Harbor?
80.3% of People are in the Labor Force in National Harbor.
What is the Unemployment Rate in National Harbor?
Unemployment Rate in National Harbor is 2.6%.