Cities with the Highest Percentage of Immigrants from Philippines in Massachusetts
RELATED REPORTS & OPTIONS
Philippines
Massachusetts
Compare Cities
Map of Cities with the Highest Percentage of Immigrants from Philippines in Massachusetts
0.00%
1.50%
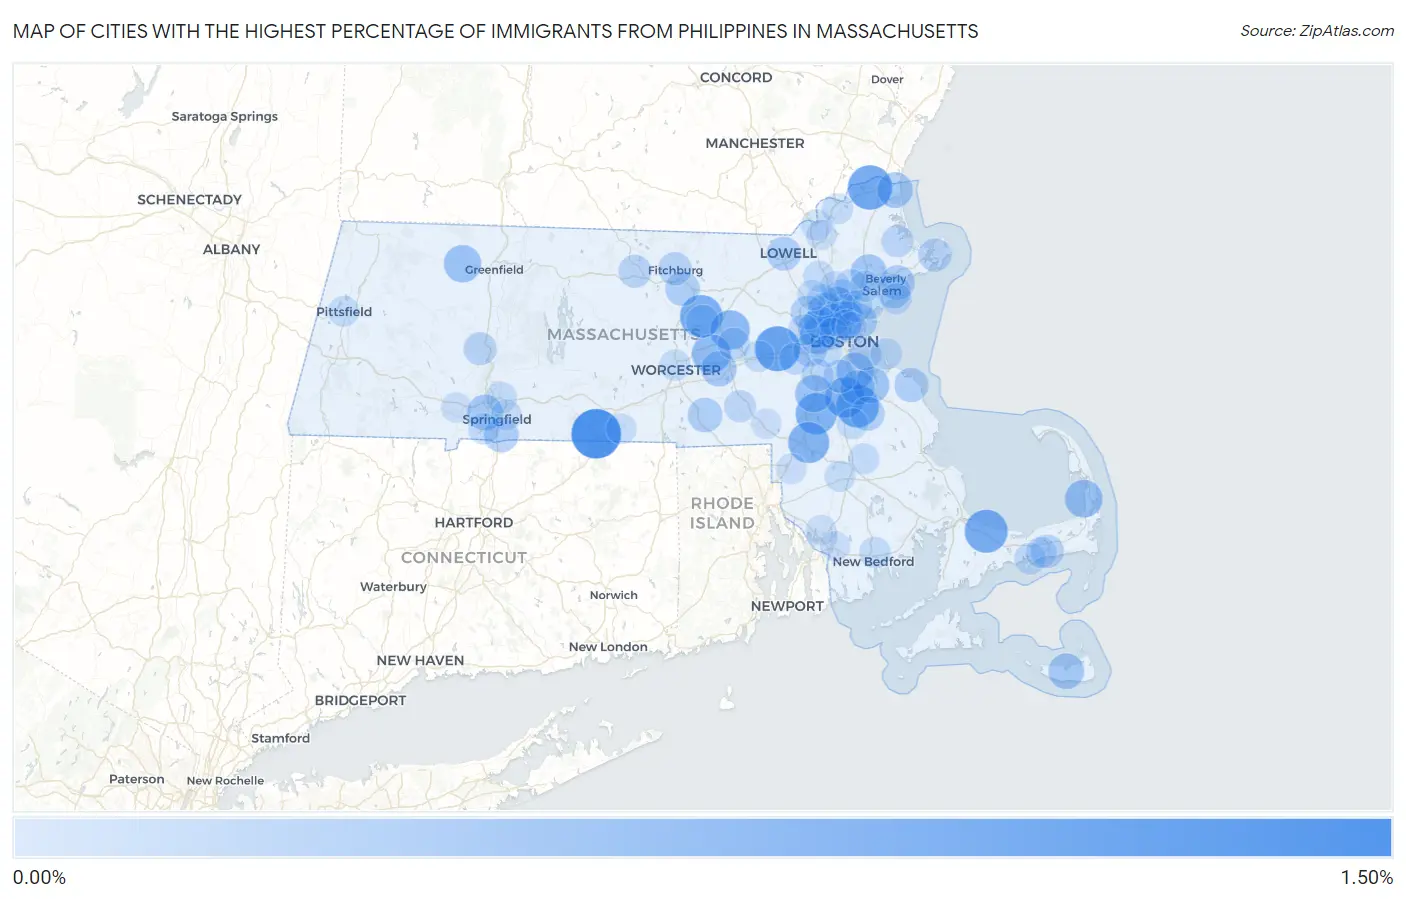
Cities with the Highest Percentage of Immigrants from Philippines in Massachusetts
| City | Philippines | vs State | vs National | |
| 1. | Holland | 1.45% | 0.15%(+1.29)#-1 | 0.60%(+0.847)#0 |
| 2. | Cochituate | 1.11% | 0.15%(+0.955)#0 | 0.60%(+0.510)#1 |
| 3. | Amesbury Town | 1.05% | 0.15%(+0.893)#18 | 0.60%(+0.448)#654 |
| 4. | East Sandwich | 0.95% | 0.15%(+0.796)#19 | 0.60%(+0.351)#655 |
| 5. | Holbrook | 0.92% | 0.15%(+0.762)#20 | 0.60%(+0.318)#656 |
| 6. | South Lancaster | 0.91% | 0.15%(+0.759)#21 | 0.60%(+0.314)#657 |
| 7. | Sharon | 0.82% | 0.15%(+0.664)#22 | 0.60%(+0.219)#658 |
| 8. | Mansfield Center | 0.81% | 0.15%(+0.651)#23 | 0.60%(+0.207)#659 |
| 9. | Randolph Town | 0.76% | 0.15%(+0.606)#24 | 0.60%(+0.161)#660 |
| 10. | Hudson | 0.69% | 0.15%(+0.536)#25 | 0.60%(+0.091)#661 |
| 11. | Northborough | 0.64% | 0.15%(+0.489)#26 | 0.60%(+0.044)#662 |
| 12. | North Eastham | 0.56% | 0.15%(+0.403)#27 | 0.60%(-0.042)#663 |
| 13. | Shelburne Falls | 0.53% | 0.15%(+0.375)#28 | 0.60%(-0.070)#664 |
| 14. | Belmont | 0.52% | 0.15%(+0.368)#29 | 0.60%(-0.077)#665 |
| 15. | Norwood | 0.52% | 0.15%(+0.365)#30 | 0.60%(-0.080)#666 |
| 16. | Quincy | 0.51% | 0.15%(+0.358)#31 | 0.60%(-0.087)#803 |
| 17. | Stoneham | 0.45% | 0.15%(+0.298)#32 | 0.60%(-0.147)#804 |
| 18. | Weymouth Town | 0.45% | 0.15%(+0.295)#33 | 0.60%(-0.149)#805 |
| 19. | Danvers | 0.44% | 0.15%(+0.286)#34 | 0.60%(-0.159)#806 |
| 20. | Watertown Town | 0.41% | 0.15%(+0.257)#35 | 0.60%(-0.188)#807 |
| 21. | West Springfield Town | 0.41% | 0.15%(+0.252)#36 | 0.60%(-0.193)#808 |
| 22. | Nantucket | 0.40% | 0.15%(+0.246)#37 | 0.60%(-0.199)#809 |
| 23. | Salisbury | 0.40% | 0.15%(+0.244)#38 | 0.60%(-0.201)#810 |
| 24. | Westborough | 0.39% | 0.15%(+0.233)#39 | 0.60%(-0.212)#811 |
| 25. | Malden | 0.36% | 0.15%(+0.206)#40 | 0.60%(-0.239)#812 |
| 26. | Longmeadow | 0.34% | 0.15%(+0.181)#41 | 0.60%(-0.264)#813 |
| 27. | Beverly | 0.33% | 0.15%(+0.173)#42 | 0.60%(-0.272)#814 |
| 28. | Whitinsville | 0.32% | 0.15%(+0.161)#43 | 0.60%(-0.283)#815 |
| 29. | Braintree Town | 0.31% | 0.15%(+0.160)#44 | 0.60%(-0.285)#816 |
| 30. | Winchester | 0.31% | 0.15%(+0.157)#45 | 0.60%(-0.288)#817 |
| 31. | Leominster | 0.31% | 0.15%(+0.152)#46 | 0.60%(-0.293)#818 |
| 32. | North Scituate | 0.30% | 0.15%(+0.145)#47 | 0.60%(-0.300)#819 |
| 33. | Salem | 0.30% | 0.15%(+0.144)#48 | 0.60%(-0.301)#985 |
| 34. | Revere | 0.28% | 0.15%(+0.129)#49 | 0.60%(-0.316)#986 |
| 35. | Abington | 0.28% | 0.15%(+0.128)#50 | 0.60%(-0.317)#987 |
| 36. | Lowell | 0.28% | 0.15%(+0.127)#51 | 0.60%(-0.318)#988 |
| 37. | Somerville | 0.27% | 0.15%(+0.117)#52 | 0.60%(-0.328)#989 |
| 38. | Lexington | 0.26% | 0.15%(+0.102)#53 | 0.60%(-0.343)#990 |
| 39. | Wakefield | 0.25% | 0.15%(+0.097)#54 | 0.60%(-0.348)#991 |
| 40. | Newton | 0.24% | 0.15%(+0.080)#55 | 0.60%(-0.365)#1,102 |
| 41. | Fitchburg | 0.23% | 0.15%(+0.073)#56 | 0.60%(-0.371)#1,103 |
| 42. | Gloucester | 0.23% | 0.15%(+0.073)#57 | 0.60%(-0.372)#1,104 |
| 43. | West Dennis | 0.22% | 0.15%(+0.065)#58 | 0.60%(-0.380)#1,105 |
| 44. | Milton | 0.22% | 0.15%(+0.063)#59 | 0.60%(-0.382)#1,106 |
| 45. | Northampton | 0.21% | 0.15%(+0.054)#60 | 0.60%(-0.391)#1,107 |
| 46. | Gardner | 0.21% | 0.15%(+0.054)#61 | 0.60%(-0.391)#1,108 |
| 47. | Boston | 0.21% | 0.15%(+0.053)#62 | 0.60%(-0.392)#1,109 |
| 48. | Clinton | 0.20% | 0.15%(+0.049)#63 | 0.60%(-0.396)#1,110 |
| 49. | Amherst | 0.17% | 0.15%(+0.019)#64 | 0.60%(-0.426)#1,111 |
| 50. | Dedham | 0.17% | 0.15%(+0.012)#65 | 0.60%(-0.433)#1,112 |
| 51. | Medford | 0.16% | 0.15%(+0.009)#66 | 0.60%(-0.436)#1,113 |
| 52. | Melrose | 0.15% | 0.15%(-0.006)#67 | 0.60%(-0.450)#1,114 |
| 53. | Arlington | 0.15% | 0.15%(-0.009)#68 | 0.60%(-0.454)#1,115 |
| 54. | Ipswich | 0.14% | 0.15%(-0.011)#69 | 0.60%(-0.456)#1,116 |
| 55. | Milford | 0.14% | 0.15%(-0.017)#70 | 0.60%(-0.462)#1,117 |
| 56. | Marlborough | 0.13% | 0.15%(-0.022)#71 | 0.60%(-0.467)#1,118 |
| 57. | Wellesley | 0.13% | 0.15%(-0.028)#72 | 0.60%(-0.472)#1,119 |
| 58. | Lynnfield | 0.12% | 0.15%(-0.031)#73 | 0.60%(-0.476)#1,120 |
| 59. | Cambridge | 0.12% | 0.15%(-0.034)#74 | 0.60%(-0.479)#1,121 |
| 60. | Saugus | 0.12% | 0.15%(-0.036)#75 | 0.60%(-0.481)#1,122 |
| 61. | Greenfield | 0.12% | 0.15%(-0.036)#76 | 0.60%(-0.481)#1,123 |
| 62. | West Yarmouth | 0.11% | 0.15%(-0.040)#77 | 0.60%(-0.485)#1,124 |
| 63. | Brookline | 0.11% | 0.15%(-0.046)#78 | 0.60%(-0.491)#1,125 |
| 64. | Hull | 0.099% | 0.15%(-0.056)#79 | 0.60%(-0.501)#1,126 |
| 65. | Agawam Town | 0.098% | 0.15%(-0.057)#80 | 0.60%(-0.502)#1,127 |
| 66. | Woburn | 0.098% | 0.15%(-0.057)#81 | 0.60%(-0.502)#1,128 |
| 67. | New Bedford | 0.095% | 0.15%(-0.059)#82 | 0.60%(-0.504)#1,129 |
| 68. | Lynn | 0.091% | 0.15%(-0.063)#83 | 0.60%(-0.508)#1,130 |
| 69. | Chicopee | 0.090% | 0.15%(-0.065)#84 | 0.60%(-0.510)#1,131 |
| 70. | Waltham | 0.088% | 0.15%(-0.067)#85 | 0.60%(-0.512)#1,210 |
| 71. | South Yarmouth | 0.085% | 0.15%(-0.070)#86 | 0.60%(-0.515)#1,211 |
| 72. | Worcester | 0.080% | 0.15%(-0.074)#87 | 0.60%(-0.519)#1,212 |
| 73. | Peabody | 0.079% | 0.15%(-0.075)#88 | 0.60%(-0.520)#1,213 |
| 74. | Brockton | 0.078% | 0.15%(-0.076)#89 | 0.60%(-0.521)#1,214 |
| 75. | Methuen Town | 0.078% | 0.15%(-0.077)#90 | 0.60%(-0.522)#1,215 |
| 76. | Marblehead | 0.074% | 0.15%(-0.081)#91 | 0.60%(-0.526)#1,216 |
| 77. | Wilmington | 0.073% | 0.15%(-0.081)#92 | 0.60%(-0.526)#1,217 |
| 78. | Framingham | 0.072% | 0.15%(-0.082)#93 | 0.60%(-0.527)#1,218 |
| 79. | Haverhill | 0.070% | 0.15%(-0.085)#94 | 0.60%(-0.530)#1,219 |
| 80. | Pittsfield | 0.064% | 0.15%(-0.091)#95 | 0.60%(-0.536)#1,220 |
| 81. | Bridgewater Town | 0.063% | 0.15%(-0.092)#96 | 0.60%(-0.537)#1,221 |
| 82. | Taunton | 0.062% | 0.15%(-0.093)#97 | 0.60%(-0.537)#1,222 |
| 83. | Springfield | 0.059% | 0.15%(-0.096)#98 | 0.60%(-0.541)#1,223 |
| 84. | Burlington | 0.057% | 0.15%(-0.097)#99 | 0.60%(-0.542)#1,224 |
| 85. | Chelsea | 0.055% | 0.15%(-0.100)#100 | 0.60%(-0.545)#1,225 |
| 86. | Everett | 0.043% | 0.15%(-0.112)#101 | 0.60%(-0.557)#1,226 |
| 87. | Southbridge Town | 0.040% | 0.15%(-0.115)#102 | 0.60%(-0.560)#1,227 |
| 88. | Westfield | 0.032% | 0.15%(-0.123)#103 | 0.60%(-0.568)#1,228 |
| 89. | Reading | 0.031% | 0.15%(-0.123)#104 | 0.60%(-0.568)#1,229 |
| 90. | Attleboro | 0.028% | 0.15%(-0.127)#105 | 0.60%(-0.572)#1,230 |
| 91. | Somerset | 0.027% | 0.15%(-0.127)#106 | 0.60%(-0.572)#1,231 |
| 92. | Franklin Town | 0.024% | 0.15%(-0.130)#107 | 0.60%(-0.575)#1,232 |
| 93. | Lawrence | 0.020% | 0.15%(-0.134)#108 | 0.60%(-0.579)#1,233 |
| 94. | Fall River | 0.013% | 0.15%(-0.142)#109 | 0.60%(-0.587)#1,234 |
Common Questions
What are the Top 10 Cities with the Highest Percentage of Immigrants from Philippines in Massachusetts?
Top 10 Cities with the Highest Percentage of Immigrants from Philippines in Massachusetts are:
#1
1.45%
#2
1.11%
#3
1.05%
#4
0.95%
#5
0.92%
#6
0.91%
#7
0.82%
#8
0.81%
#9
0.76%
#10
0.69%
What city has the Highest Percentage of Immigrants from Philippines in Massachusetts?
Holland has the Highest Percentage of Immigrants from Philippines in Massachusetts with 1.45%.
What is the Percentage of Immigrants from Philippines in the State of Massachusetts?
Percentage of Immigrants from Philippines in Massachusetts is 0.15%.
What is the Percentage of Immigrants from Philippines in the United States?
Percentage of Immigrants from Philippines in the United States is 0.60%.