Cities with the Highest Percentage of Immigrants from Philippines in North Carolina
RELATED REPORTS & OPTIONS
Philippines
North Carolina
Compare Cities
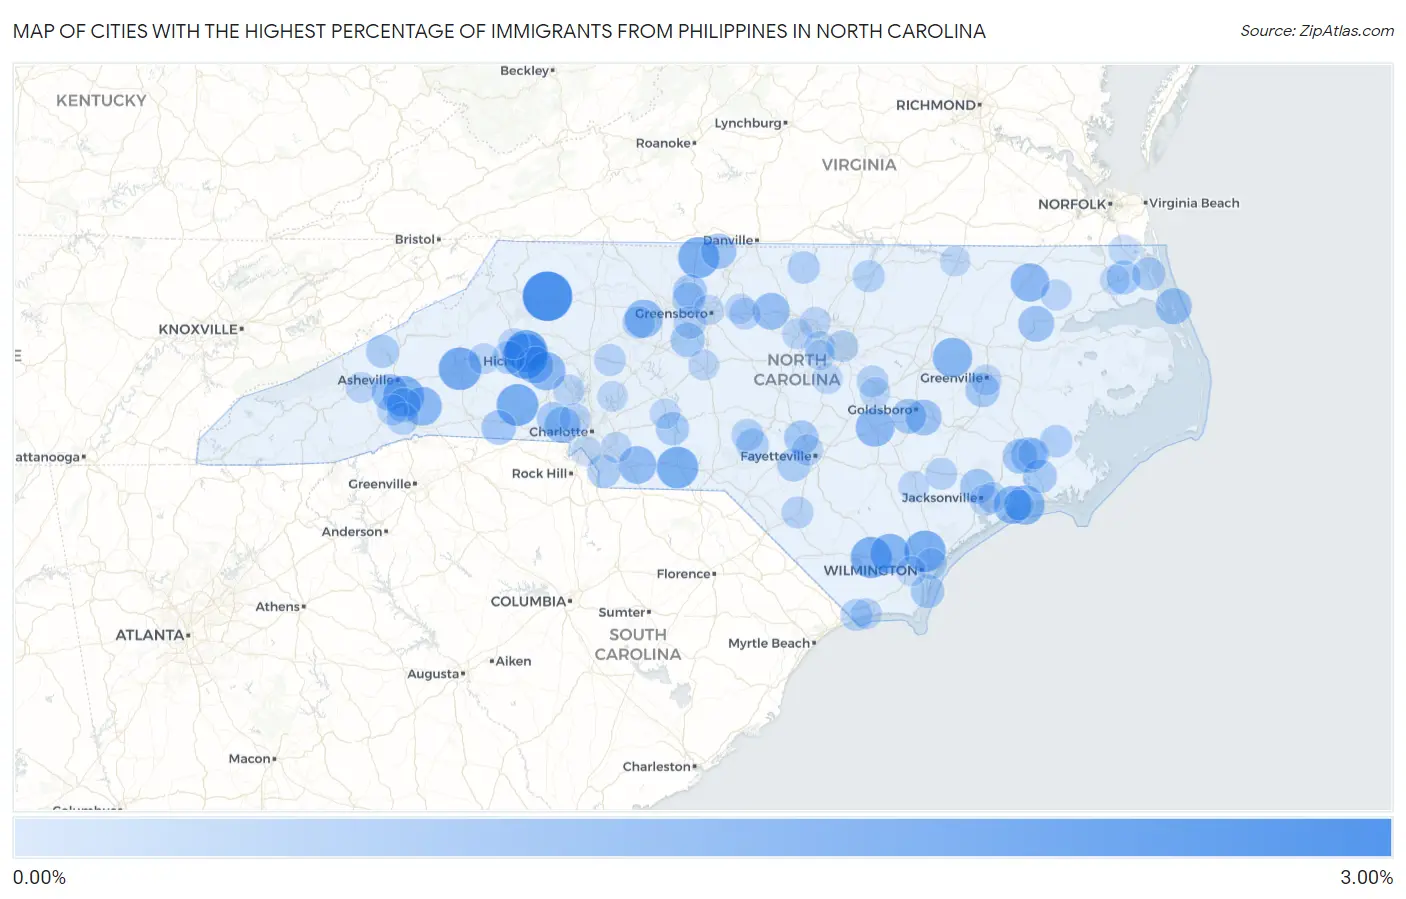
Map of Cities with the Highest Percentage of Immigrants from Philippines in North Carolina
0.00%
3.00%
Cities with the Highest Percentage of Immigrants from Philippines in North Carolina
| City | Philippines | vs State | vs National | |
| 1. | Millers Creek | 2.85% | 0.20%(+2.65)#-1 | 0.60%(+2.25)#0 |
| 2. | Jackson Springs | 2.46% | 0.20%(+2.26)#0 | 0.60%(+1.86)#1 |
| 3. | Rhodhiss | 2.23% | 0.20%(+2.04)#1 | 0.60%(+1.63)#2 |
| 4. | Marion | 1.91% | 0.20%(+1.71)#2 | 0.60%(+1.31)#3 |
| 5. | Granite Falls | 1.88% | 0.20%(+1.69)#3 | 0.60%(+1.29)#4 |
| 6. | Fallston | 1.79% | 0.20%(+1.59)#4 | 0.60%(+1.19)#5 |
| 7. | Wadesboro | 1.78% | 0.20%(+1.58)#5 | 0.60%(+1.18)#6 |
| 8. | Castle Hayne | 1.75% | 0.20%(+1.55)#6 | 0.60%(+1.15)#7 |
| 9. | Bolton | 1.72% | 0.20%(+1.52)#7 | 0.60%(+1.12)#8 |
| 10. | Stoneville | 1.71% | 0.20%(+1.51)#8 | 0.60%(+1.11)#9 |
| 11. | Royal Pines | 1.67% | 0.20%(+1.47)#9 | 0.60%(+1.07)#48 |
| 12. | Riegelwood | 1.52% | 0.20%(+1.32)#10 | 0.60%(+0.920)#49 |
| 13. | Macclesfield | 1.49% | 0.20%(+1.29)#11 | 0.60%(+0.893)#50 |
| 14. | Bogue | 1.47% | 0.20%(+1.27)#12 | 0.60%(+0.873)#51 |
| 15. | Edneyville | 1.38% | 0.20%(+1.18)#13 | 0.60%(+0.779)#52 |
| 16. | Newton | 1.37% | 0.20%(+1.17)#14 | 0.60%(+0.767)#53 |
| 17. | Newton Grove | 1.37% | 0.20%(+1.17)#15 | 0.60%(+0.766)#54 |
| 18. | Ahoskie | 1.36% | 0.20%(+1.17)#16 | 0.60%(+0.764)#55 |
| 19. | Clemmons | 1.30% | 0.20%(+1.10)#17 | 0.60%(+0.702)#56 |
| 20. | Swansboro | 1.28% | 0.20%(+1.08)#18 | 0.60%(+0.677)#57 |
| 21. | Wingate | 1.23% | 0.20%(+1.03)#19 | 0.60%(+0.631)#58 |
| 22. | Brookford | 1.15% | 0.20%(+0.952)#20 | 0.60%(+0.550)#59 |
| 23. | Mebane | 1.13% | 0.20%(+0.936)#21 | 0.60%(+0.534)#60 |
| 24. | Bent Creek | 1.11% | 0.20%(+0.909)#22 | 0.60%(+0.507)#61 |
| 25. | Southern Shores | 1.03% | 0.20%(+0.835)#23 | 0.60%(+0.433)#62 |
| 26. | Lowell | 1.00% | 0.20%(+0.805)#24 | 0.60%(+0.402)#63 |
| 27. | Windsor | 1.00% | 0.20%(+0.804)#25 | 0.60%(+0.402)#64 |
| 28. | Elroy | 1.00% | 0.20%(+0.804)#26 | 0.60%(+0.402)#65 |
| 29. | James City | 0.96% | 0.20%(+0.766)#27 | 0.60%(+0.364)#66 |
| 30. | Eden | 0.94% | 0.20%(+0.741)#28 | 0.60%(+0.338)#67 |
| 31. | Mar Mac | 0.89% | 0.20%(+0.688)#29 | 0.60%(+0.286)#68 |
| 32. | Half Moon | 0.87% | 0.20%(+0.673)#30 | 0.60%(+0.271)#69 |
| 33. | Brices Creek | 0.87% | 0.20%(+0.672)#31 | 0.60%(+0.270)#70 |
| 34. | Boiling Springs | 0.84% | 0.20%(+0.646)#32 | 0.60%(+0.244)#71 |
| 35. | Fletcher | 0.81% | 0.20%(+0.615)#33 | 0.60%(+0.213)#72 |
| 36. | Winterville | 0.81% | 0.20%(+0.611)#34 | 0.60%(+0.209)#73 |
| 37. | Spring Lake | 0.80% | 0.20%(+0.605)#35 | 0.60%(+0.203)#74 |
| 38. | Trinity | 0.78% | 0.20%(+0.587)#36 | 0.60%(+0.185)#75 |
| 39. | Stokesdale | 0.75% | 0.20%(+0.548)#37 | 0.60%(+0.146)#76 |
| 40. | Havelock | 0.73% | 0.20%(+0.536)#38 | 0.60%(+0.134)#77 |
| 41. | Dallas | 0.73% | 0.20%(+0.533)#39 | 0.60%(+0.130)#78 |
| 42. | Camden | 0.73% | 0.20%(+0.532)#40 | 0.60%(+0.129)#79 |
| 43. | Sea Breeze | 0.72% | 0.20%(+0.520)#41 | 0.60%(+0.118)#80 |
| 44. | Norwood | 0.69% | 0.20%(+0.491)#42 | 0.60%(+0.088)#81 |
| 45. | Waxhaw | 0.68% | 0.20%(+0.480)#43 | 0.60%(+0.078)#359 |
| 46. | Coinjock | 0.66% | 0.20%(+0.467)#44 | 0.60%(+0.065)#360 |
| 47. | Spout Springs | 0.65% | 0.20%(+0.457)#45 | 0.60%(+0.055)#361 |
| 48. | Marshall | 0.65% | 0.20%(+0.452)#46 | 0.60%(+0.050)#362 |
| 49. | Rockfish | 0.64% | 0.20%(+0.447)#47 | 0.60%(+0.045)#363 |
| 50. | Valdese | 0.62% | 0.20%(+0.422)#48 | 0.60%(+0.020)#364 |
| 51. | Oak Ridge | 0.62% | 0.20%(+0.418)#49 | 0.60%(+0.016)#365 |
| 52. | Aberdeen | 0.60% | 0.20%(+0.402)#50 | 0.60%(-0.000)#366 |
| 53. | Bayboro | 0.58% | 0.20%(+0.381)#51 | 0.60%(-0.021)#367 |
| 54. | Bermuda Run | 0.58% | 0.20%(+0.380)#52 | 0.60%(-0.022)#368 |
| 55. | High Point | 0.58% | 0.20%(+0.378)#53 | 0.60%(-0.024)#448 |
| 56. | Anderson Creek | 0.56% | 0.20%(+0.363)#54 | 0.60%(-0.039)#449 |
| 57. | Roxboro | 0.55% | 0.20%(+0.356)#55 | 0.60%(-0.046)#450 |
| 58. | Pinehurst | 0.54% | 0.20%(+0.340)#56 | 0.60%(-0.062)#704 |
| 59. | Laurel Park | 0.54% | 0.20%(+0.338)#57 | 0.60%(-0.064)#705 |
| 60. | Henderson | 0.53% | 0.20%(+0.336)#58 | 0.60%(-0.066)#706 |
| 61. | Sunset Beach | 0.50% | 0.20%(+0.304)#59 | 0.60%(-0.098)#707 |
| 62. | Lumberton | 0.49% | 0.20%(+0.289)#60 | 0.60%(-0.113)#994 |
| 63. | Beulaville | 0.49% | 0.20%(+0.289)#61 | 0.60%(-0.113)#995 |
| 64. | Cleveland | 0.48% | 0.20%(+0.285)#62 | 0.60%(-0.117)#996 |
| 65. | Wilson S Mills | 0.46% | 0.20%(+0.267)#63 | 0.60%(-0.135)#997 |
| 66. | Raleigh | 0.46% | 0.20%(+0.267)#64 | 0.60%(-0.135)#998 |
| 67. | Burlington | 0.44% | 0.20%(+0.247)#65 | 0.60%(-0.155)#999 |
| 68. | Fayetteville | 0.41% | 0.20%(+0.212)#66 | 0.60%(-0.190)#1,208 |
| 69. | Kings Grant | 0.41% | 0.20%(+0.211)#67 | 0.60%(-0.191)#1,209 |
| 70. | Mount Holly | 0.41% | 0.20%(+0.210)#68 | 0.60%(-0.192)#1,210 |
| 71. | Denver | 0.40% | 0.20%(+0.204)#69 | 0.60%(-0.198)#1,211 |
| 72. | Jacksonville | 0.40% | 0.20%(+0.203)#70 | 0.60%(-0.199)#1,212 |
| 73. | Mills River | 0.39% | 0.20%(+0.197)#71 | 0.60%(-0.205)#1,213 |
| 74. | Fairfield Harbour | 0.39% | 0.20%(+0.193)#72 | 0.60%(-0.209)#1,214 |
| 75. | Durham | 0.39% | 0.20%(+0.192)#73 | 0.60%(-0.210)#1,293 |
| 76. | Colerain | 0.39% | 0.20%(+0.191)#74 | 0.60%(-0.211)#1,294 |
| 77. | Greenville | 0.37% | 0.20%(+0.176)#75 | 0.60%(-0.227)#1,295 |
| 78. | Ocean Isle Beach | 0.37% | 0.20%(+0.173)#76 | 0.60%(-0.229)#1,296 |
| 79. | West Canton | 0.37% | 0.20%(+0.172)#77 | 0.60%(-0.230)#1,297 |
| 80. | Glen Alpine | 0.37% | 0.20%(+0.172)#78 | 0.60%(-0.231)#1,298 |
| 81. | Cajah S Mountain | 0.37% | 0.20%(+0.171)#79 | 0.60%(-0.231)#1,299 |
| 82. | Hemby Bridge | 0.36% | 0.20%(+0.166)#80 | 0.60%(-0.236)#1,300 |
| 83. | Chapel Hill | 0.36% | 0.20%(+0.162)#81 | 0.60%(-0.240)#1,301 |
| 84. | Asheboro | 0.36% | 0.20%(+0.160)#82 | 0.60%(-0.242)#1,302 |
| 85. | Piney Green | 0.35% | 0.20%(+0.154)#83 | 0.60%(-0.248)#1,303 |
| 86. | Rose Hill | 0.34% | 0.20%(+0.144)#84 | 0.60%(-0.258)#1,304 |
| 87. | Fuquay Varina | 0.34% | 0.20%(+0.141)#85 | 0.60%(-0.261)#1,305 |
| 88. | Kannapolis | 0.33% | 0.20%(+0.129)#86 | 0.60%(-0.273)#1,306 |
| 89. | Smithfield | 0.32% | 0.20%(+0.123)#87 | 0.60%(-0.279)#1,307 |
| 90. | Cedar Point | 0.32% | 0.20%(+0.121)#88 | 0.60%(-0.281)#1,308 |
| 91. | Morrisville | 0.32% | 0.20%(+0.118)#89 | 0.60%(-0.284)#1,309 |
| 92. | Greensboro | 0.31% | 0.20%(+0.109)#90 | 0.60%(-0.293)#1,310 |
| 93. | Moyock | 0.30% | 0.20%(+0.107)#91 | 0.60%(-0.295)#1,311 |
| 94. | Roanoke Rapids | 0.30% | 0.20%(+0.106)#92 | 0.60%(-0.296)#1,312 |
| 95. | Elizabeth City | 0.30% | 0.20%(+0.099)#93 | 0.60%(-0.304)#1,313 |
| 96. | Gibsonville | 0.29% | 0.20%(+0.097)#94 | 0.60%(-0.305)#1,314 |
| 97. | Albemarle | 0.29% | 0.20%(+0.088)#95 | 0.60%(-0.314)#1,315 |
| 98. | Cary | 0.28% | 0.20%(+0.080)#96 | 0.60%(-0.322)#1,316 |
| 99. | Pineville | 0.28% | 0.20%(+0.078)#97 | 0.60%(-0.324)#1,317 |
| 100. | Leland | 0.27% | 0.20%(+0.076)#98 | 0.60%(-0.326)#1,318 |
Common Questions
What are the Top 10 Cities with the Highest Percentage of Immigrants from Philippines in North Carolina?
Top 10 Cities with the Highest Percentage of Immigrants from Philippines in North Carolina are:
#1
2.85%
#2
2.23%
#3
1.91%
#4
1.88%
#5
1.79%
#6
1.78%
#7
1.75%
#8
1.72%
#9
1.71%
#10
1.67%
What city has the Highest Percentage of Immigrants from Philippines in North Carolina?
Millers Creek has the Highest Percentage of Immigrants from Philippines in North Carolina with 2.85%.
What is the Percentage of Immigrants from Philippines in the State of North Carolina?
Percentage of Immigrants from Philippines in North Carolina is 0.20%.
What is the Percentage of Immigrants from Philippines in the United States?
Percentage of Immigrants from Philippines in the United States is 0.60%.